





Introduction
Antibiotic Stewardship Programs (ASPs) are required in all hospitals across the United States, and rigorous evaluation of ASP effectiveness using accepted metrics is essential. Currently, the Standardized Antimicrobial Administration Ratio (SAAR) has been introduced as a US national benchmarking metric. Reference Edwards and Srinivasan1 However, it has several important limitations, including the absence of patient-level risk adjustment. Previous studies indicate that patient characteristics, such as age, comorbidities, and infection type, largely explain interhospital variation in antibiotic use. Reference Aldeyab, McElnay and Scott2–Reference Yu, Moisan and Tartof8 The SAAR’s inability to adjust for non-modifiable patient-level factors that influence antibiotic use prevents fair and meaningful benchmarking of hospitals
Building on this rationale, we previously developed novel metrics that adjust for differences in patient case-mix across hospitals to support more informative stewardship benchmarking. Reference Livorsi, Merchant and Cho9 Specifically, we constructed two risk-standardized metrics: a risk-standardized ratio for days of therapy (RSR-DOT) and an RSR for days of antibiotic spectrum coverage (RSR-DASC). Reference Livorsi, Merchant and Cho9 DASC provides a quantitative measure of antibiotic spectrum, and prior studies have shown that DASC offers a more comprehensive assessment of inpatient antibiotic use than DOT alone. Reference Kakiuchi, Livorsi and Perencevich10–Reference Murakami, Akazawa and Honda12 The RSR metrics were developed using a modified Delphi process that integrated expert-driven and data-driven approaches to identify non-modifiable risk factors associated with appropriate inpatient antibiotic prescribing.
Although inclusion of patient-level data in both RSR metrics may enhance their face validity to clinicians, it remains uncertain whether hospital performance on these electronically derived measures truly reflects the quality of antibiotic prescribing. Establishing this construct validity is essential to determine whether these new metrics can serve as meaningful benchmarking tools for stewardship performance.
In this study, we assessed the construct validity of these metrics by focusing on two common infectious diseases: lower respiratory tract infections (LRIs) and urinary tract infections (UTIs). These were selected because they are among the most common indications for antibiotic prescribing in hospitalized patients and represent frequent targets of stewardship interventions. Reference Sevin, Daniau and Alfandari13–Reference Magill, Edwards and Beldavs15 Evaluating these common infections provides an opportunity to assess whether hospital-level performance on these electronic metrics reflects antibiotic-prescribing decisions in routine practice.
Therefore, the aim of this study was to evaluate whether hospital performance on risk-standardized antibiotic use metrics (RSR-DOT and RSR-DASC) is associated with the quality of antibiotic selection and duration of therapy for patients hospitalized with LRIs and UTIs.
Methods
Study cohort
Administrative and clinical data from 121 acute-care hospitals in the Veterans Health Administration from October 1, 2020, through September 30, 2021, were used. Hospitals were classified according to whether their RSR-DOT and RSR-DASC values Reference Livorsi, Merchant and Cho9 were relatively low, intermediate, or high. Excluding the intermediate–intermediate combination, this yielded eight joint categories, from each of which three hospitals were purposively selected, for a total of 24 hospitals, for detailed chart review of antibiotic prescribing practices. The Institutional Review Board of the University of Iowa and Iowa City Veterans Health Care System approved this study. The analysis used existing electronic health records and administrative data and posed minimal risk to participants; informed consent was therefore waived.
Case sampling and eligibility criteria
Within each selected hospital, we randomly sampled inpatient admissions in which patients received systemic antibiotic therapy for at least 72 hours and had a discharge diagnosis consistent with one of the following infections: LRIs, including acute exacerbation of chronic obstructive pulmonary disease (COPD) or uncomplicated community-acquired pneumonia (CAP); and UTIs, including cystitis or pyelonephritis. We also excluded cases involving complex infections requiring prolonged or specialized therapy. These details are described in Supplemental materials. For each hospital, 10 cases of LRI and 10 cases of UTI were reviewed, yielding a total of 20 reviewed admissions per hospital. This sample size, which was designed to include a diversity of hospitals, was selected based on what was deemed feasible to review given available project resources.
Chart review procedures
All chart reviews of antibiotic-prescribing quality were manually conducted by an Infectious Diseases physician (T.W.) who was blinded to the hospital’s performance on the RSR metrics. The details are shown in Supplemental materials. All criteria applied to assessments of LRI cases were based on professional guidelines available between 2020 and 2021. Reference Halpin, Criner and Papi16,Reference Metlay, Waterer and Long17 For cases of UTI, which lack professional guidelines for male patients, we used recommendations from our local antibiotic-prescribing guidelines available at that same time. Reference Hoff, Ford and Ince18
The primary assessment time point for antibiotic selection was treatment day 3. Day 0 was defined as the day of hospital admission or the day antibiotics were initiated, if therapy began after admission. Day 3 corresponded to the third full day of antibiotic therapy. Antibiotic regimens prescribed on day 3 were evaluated based on infection syndrome, microbiologic data, and guideline-concordant empiric recommendations. A major rationale for performing these assessments on day 3 was that any microbiologic cultures, including antibiotic susceptibilities, should have been available to the clinician by day 3 and ideally would have informed their antibiotic selection.
Antibiotic selection was categorized in the following classifications: 1) Unnecessary therapy, defined as antibiotic continuation despite absence of bacterial infection or after completion of an adequate antibiotic course, and further classified as unnecessary antibiotics stopped by day 3 or continued beyond day 3; 2) Undertreatment, defined as prescribing an antibiotic that lacked activity against the suspected or confirmed pathogens ; 3) Too broad, defined as prescribing unnecessarily broad-spectrum therapy when narrower agents would have sufficed, with severity classified as moderate or excessive based on spectrum score thresholds; and 4) Optimal therapy, defined as guideline-concordant, optimally narrow treatment active against the suspected or isolated pathogen. In addition, patients with LRIs who received empiric therapy that was narrower than what guidelines would recommend but were clinically improving on day 3 were also categorized as Optimal. This typically happened when patients who would have qualified for broad-spectrum antibiotics based on the American Thoracic Society and Infectious Diseases Society of America CAP guidelines instead received standard antibiotics for CAP, e.g. ceftriaxone plus azithromycin. Reference Metlay, Waterer and Long17
Total antibiotic duration was calculated as the number of days of active antibiotic therapy received both during hospitalization and at discharge. Duration was compared with guideline-recommended treatment lengths for each infection syndrome. Antibiotic duration was classified as an ordinal outcome: Optimal, if within ±1 day of the recommended duration; Too long, if exceeding recommendations by ≥2 days; or Too short, if shorter than recommendations by ≥2 days; Not applicable, if antibiotic selection was deemed unnecessary or undertreatment. The rationale for the “not applicable” designation is that, if antibiotics are unnecessary or not active against the pathogen (i.e., undertreatment), then it is impossible to count days of active therapy.
Composite outcome for optimal antibiotic use
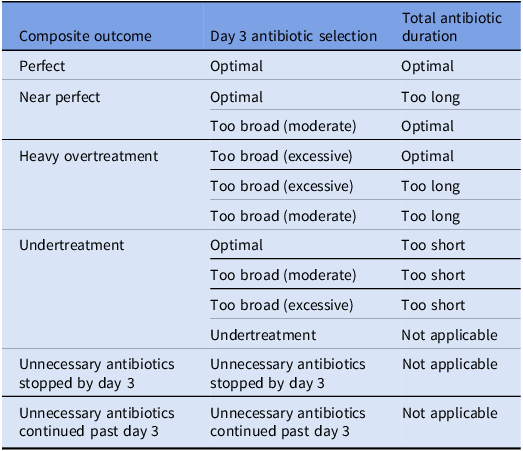
To capture the overall quality of antibiotic use, we created a 6-level ordinal composite outcome by combining the categorical assessments of antibiotic selection and duration. This composite outcome reflected the overall degree and direction of antibiotic-prescribing quality and was used as the dependent variable in ordinal logistic regression analyses. Detailed mappings of the day 3 antibiotic selection categories and duration categories to the composite outcome are shown in Table 1.
Composite outcome for optimality of antibiotic use

Table 1. Long description
A table categorizing antibiotic use quality based on selection and duration. The table has 6 rows and 3 columns. The columns are labeled Composite outcome, Day 3 antibiotic selection, and Total antibiotic duration. The rows are labeled Perfect, Near perfect, Heavy overtreatment, Undertreatment, Unnecessary antibiotics stopped by day 3, and Unnecessary antibiotics continued past day 3. Each row details the specific combinations of antibiotic selection and duration that lead to each composite outcome.
Statistical analysis
Associations between hospital-level RSR metrics Reference Livorsi, Merchant and Cho9 (RSR-DOT and RSR-DASC) and antibiotic-prescribing quality were evaluated using regression models. The dependent variable was a prespecified 6-level ordinal composite outcome (Table 1), ordered from optimal prescribing to unnecessary antibiotics continued past day 3. Ordinal logistic regression was chosen to retain this ordering and distinctions among clinically different forms of suboptimal prescribing; dichotomization would discard this information, whereas a multinomial model would treat the categories as unordered and require more parameters. Separate models were fit for the LRI and UTI groups and the combined cohort, with either RSR-DOT or RSR-DASC entered as the predictor. Regression coefficients were estimated to quantify the direction and magnitude of the association between hospital-level RSR metrics and antibiotic quality outcomes. Standard errors (SEs) were reported to reflect the uncertainty of these estimates. Statistical significance was assessed using two-sided p-values, with P < .05 considered statistically significant.
Model fit was evaluated using McFadden, Nagelkerke, and Cox-Snell pseudo-R 2 values and by comparing Akaike information criteria (AIC) across null, single-predictor, and two-predictor models. To directly compare the explanatory performance of RSR-DOT and RSR-DASC, we performed bootstrap resampling with 1,000 iterations within each analytic cohort and summarized the distribution of the difference in McFadden pseudo-R 2 between the DOT and DASC models.
Results
RSR distribution and characteristics of the 24 selected hospitals
The details of selected 24 hospitals are shown in Supplementary Table 1. Larger RSR values indicate greater-than-expected risk-standardized antibiotic use (i.e., RSR >1), whereas smaller RSR values indicate lower-than-expected use (i.e., RSR ratio <1). Overall, RSR-DOT ranged from 0.88 to 1.13 and RSR-DASC ranged from 0.86 to 1.15. Among the 24 selected hospitals, 10 (42%) had 50–99 beds, 9 (38%) had 100–149 beds, 2 (8%) had 150–199 beds, and 1 each (4%) had 0–49, 200–249, or 250–299 beds.
Characteristics of patients
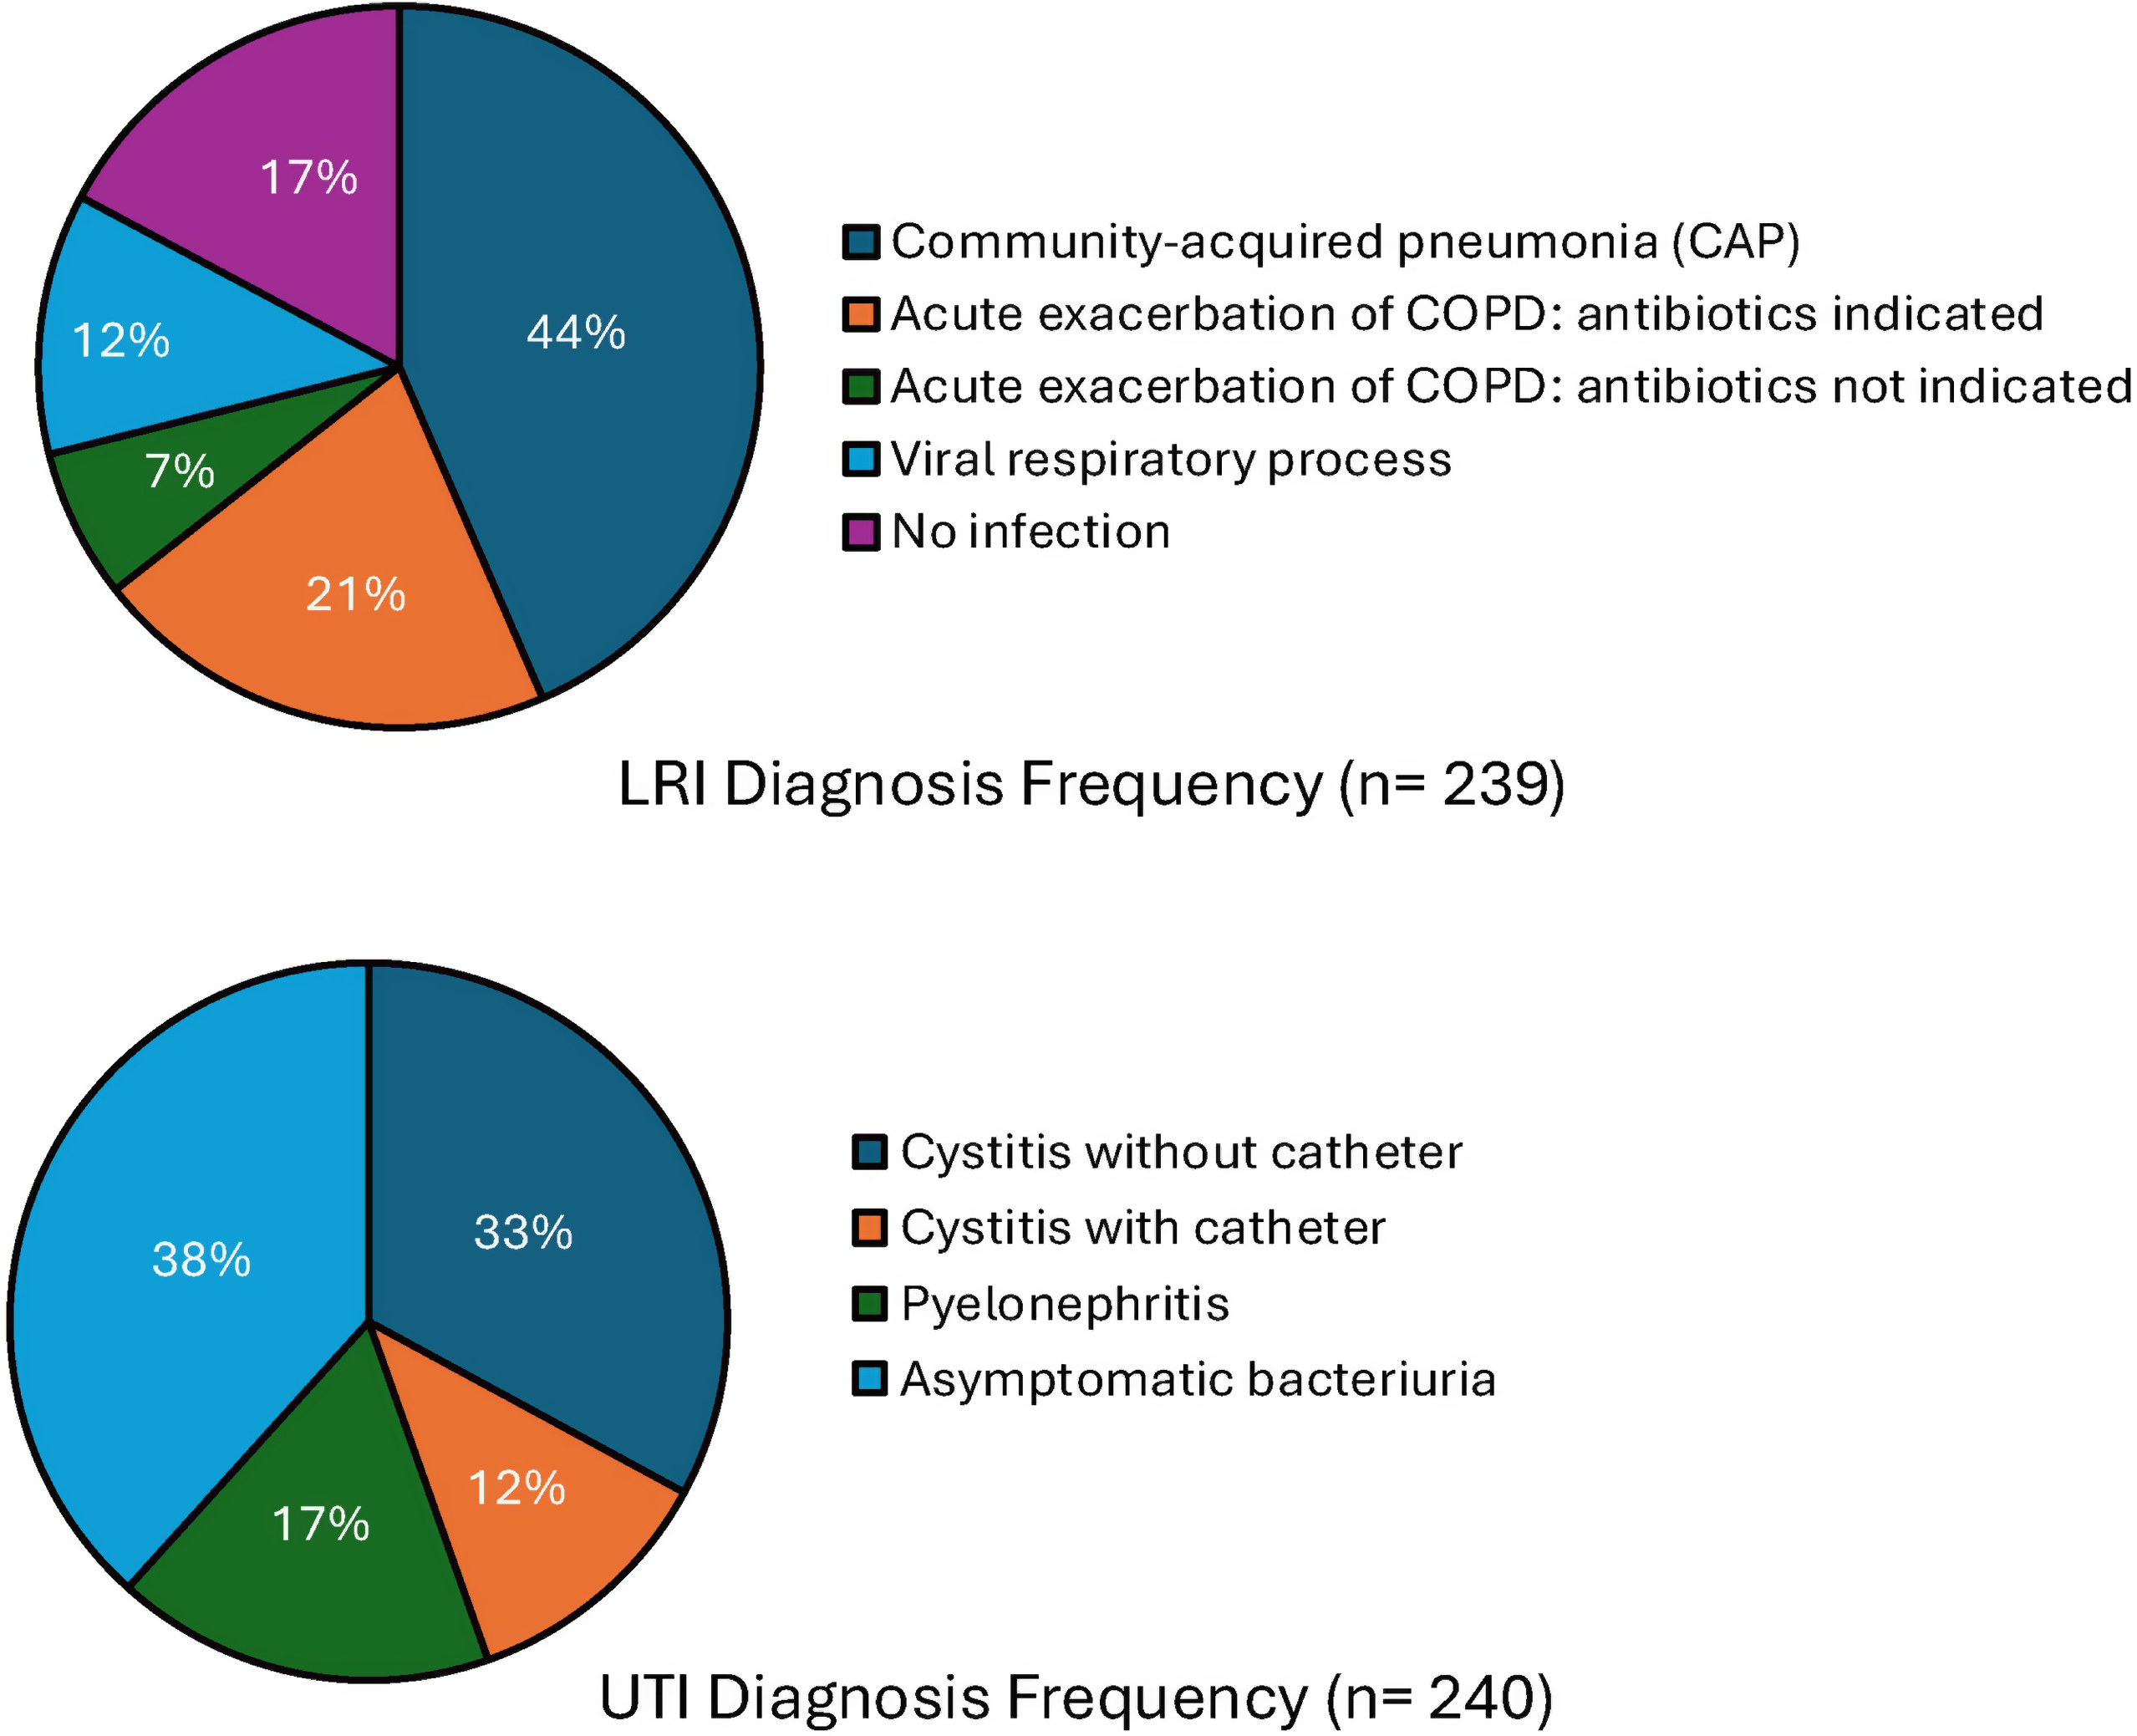
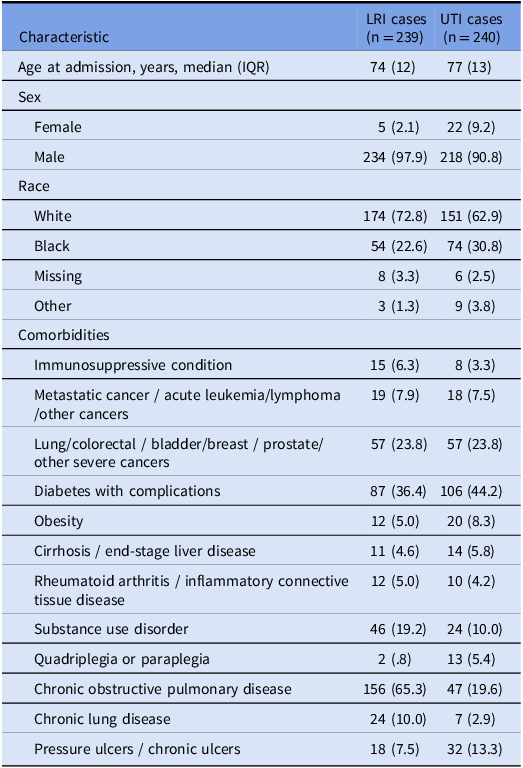
A total of 479 admissions underwent manual chart review, including 239 categorized as LRI cases and 240 categorized as UTI cases. One hospital had one fewer eligible LRI case. As shown in Table 2, patients were older and predominantly male in both groups (median age, 74 years for LRI and 77 years for UTI; male, 234 [98%] and 218 [91%]), and most were White (174 [73%] and 151 [63%]). The most common comorbidities were COPD in LRI cases (156 [65%]) and diabetes with complications in UTI cases (106 [44%]). As shown in Figure 1, among LRI cases (n = 239), the most common diagnosis was CAP (104 [44%]), followed by acute exacerbation of COPD with antibiotics indicated (50 [21%]). Among UTI cases (n = 240), asymptomatic bacteriuria was most the frequent diagnosis (92 [38%]), followed by cystitis without catheter.
Final chart-adjudicated diagnoses. Cystitis without catheter: pyuria ( ≥5 white blood cells per high-power field), positive urine culture. Abbreviations: CAP, community-acquired pneumonia; COPD, chronic obstructive pulmonary disease; HPF, high-power field; LRI, lower respiratory tract infection; UTI, urinary tract infection; WBCs, white blood cells.

Patient characteristics of the chart review cohort

Table 2. Long description
A table comparing characteristics of patients with lower respiratory infections (LRI) and urinary tract infections (UTI). The table has 12 rows and 3 columns. The columns are labeled ‘Characteristic’, ‘LRI cases (n = 239)’, and ‘UTI cases (n = 240)’. The rows include characteristics such as age at admission, sex, race, and various comorbidities. Row 1: Age at admission, years, median (IQR), LRI cases: 74 (12), UTI cases: 77 (13). Row 2: Sex, Female, LRI cases: 5 (2.1), UTI cases: 22 (9.2). Row 3: Sex, Male, LRI cases: 234 (97.9), UTI cases: 218 (90.8). Row 4: Race, White, LRI cases: 174 (72.8), UTI cases: 151 (62.9). Row 5: Race, Black, LRI cases: 54 (22.6), UTI cases: 74 (30.8). Row 6: Race, Missing, LRI cases: 8 (3.3), UTI cases: 6 (2.5). Row 7: Race, Other, LRI cases: 3 (1.3), UTI cases: 9 (3.8). Row 8: Comorbidities, Immunosuppressive condition, LRI cases: 15 (6.3), UTI cases: 8 (3.3). Row 9: Comorbidities, Metastatic cancer / acute leukemia / lymphoma / other cancers, LRI cases: 19 (7.9), UTI cases: 18 (7.5). Row 10: Comorbidities, Lung / colorectal / bladder / breast / prostate / other severe cancers, LRI cases: 57 (23.8), UTI cases: 57 (23.8). Row 11: Comorbidities, Diabetes with complications, LRI cases: 87 (36.4), UTI cases: 106 (44.2). Row 12: Comorbidities, Obesity, LRI cases: 12 (5.0), UTI cases: 20 (8.3).
Comorbidities were ascertained using inpatient and outpatient codes recorded in the 12 months prior to admission; immunosuppressive conditions were identified using codes from the 12 months prior to admission or during the index hospitalization. IQR, interquartile range; LRI, lower respiratory tract infection; UTI, urinary tract infection.
Antibiotic-prescribing quality
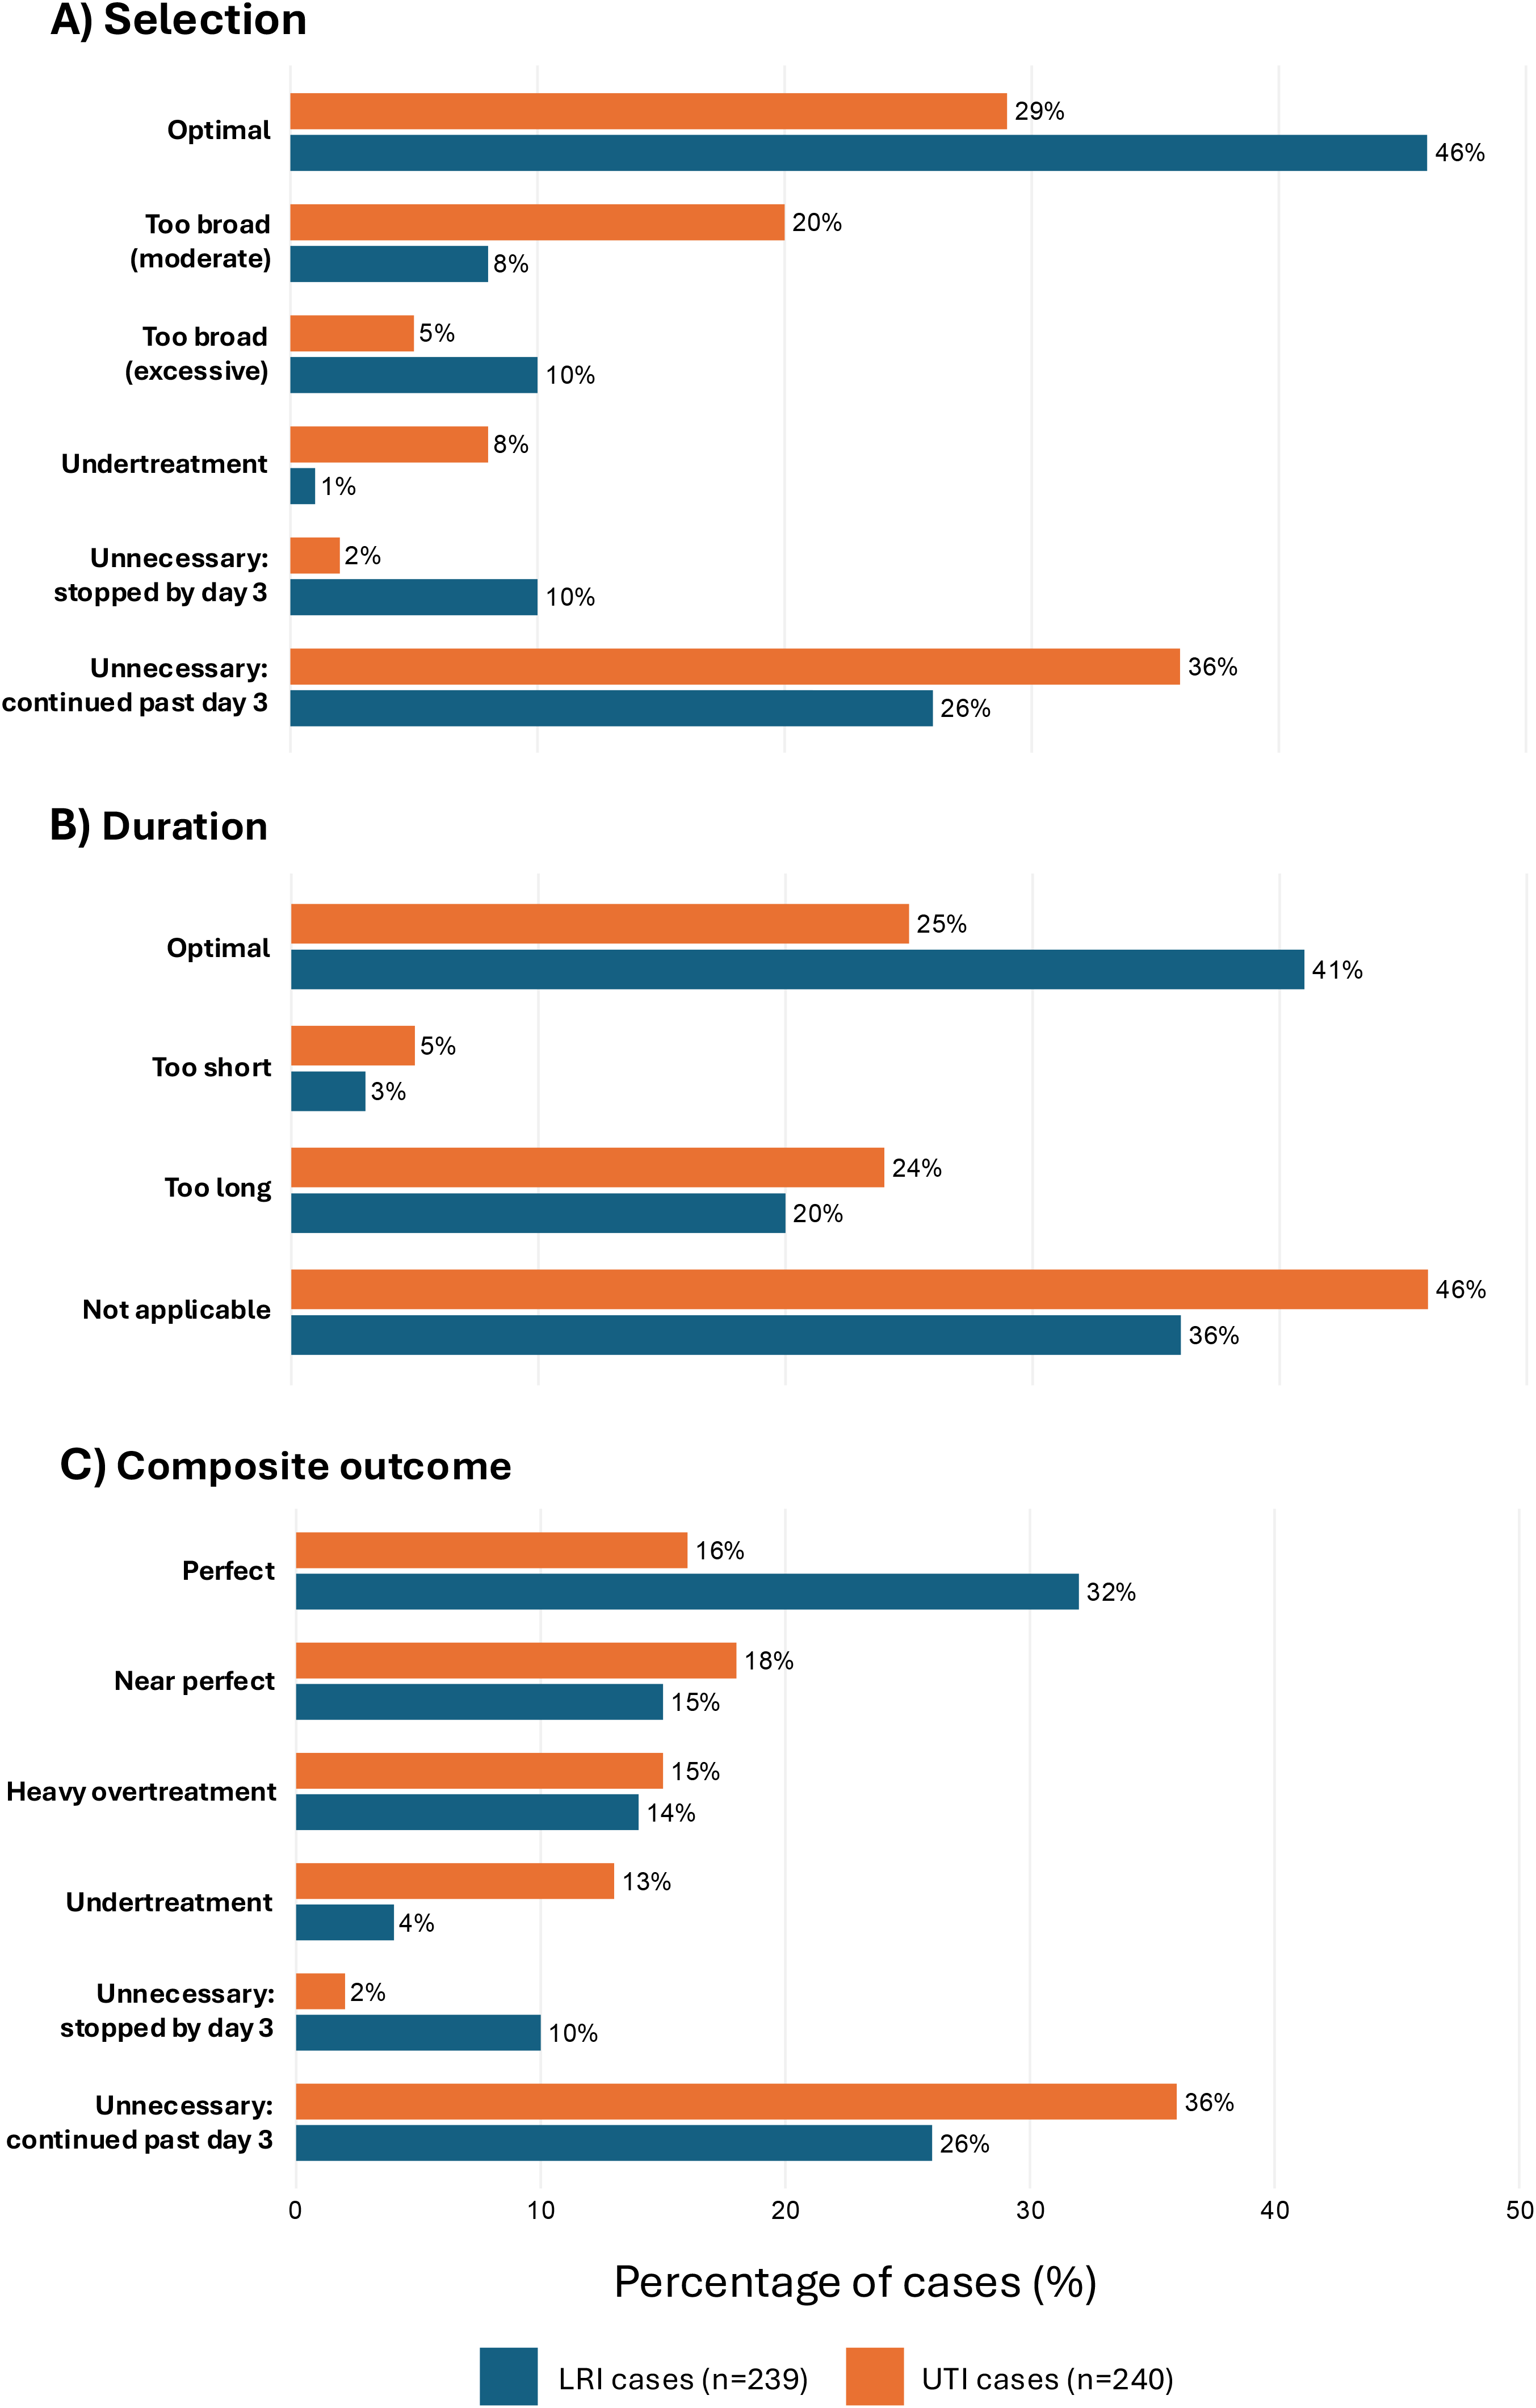
Figure 2 summarizes the chart-adjudicated quality of antibiotic use for LRI (n = 239) and UTI (n = 240) cases. As shown in Figure 2A, optimal antibiotic selection was more frequent in LRI than UTI cases (111 [46%] vs 69 [29%]). Unnecessary antibiotics continued beyond day 3 were common in both groups, particularly among UTI cases (61 [26%] vs 87 [36%]). The frequency of antibiotic selection that was too broad differed by syndrome: too broad (excessive) was more frequent in LRI (23 [10%] vs 13 [5%]), whereas too broad (moderate) was more frequent in UTI (19 [8%] vs 48 [20%]).
Chart-adjudicated optimality of antibiotic use among LRI and UTI cases. LRI, lower respiratory tract infection; UTI, urinary tract infection.

Regarding total antibiotic duration, we categorized as “not applicable” when antibiotic selection was deemed either “unnecessary” or “undertreatment.” As shown in Figure 2B, not applicable assessments were frequent in both groups (86 [36%] for LRI vs 110 [46%] for UTI). Optimal duration was observed in 99 (41%) of LRI cases and 60 (25%) of UTI cases; too long duration was more frequent than too short duration in both groups (LRI: 47 [20%] vs 7 [3%]; UTI: 57 [24%] vs 13 [5%]).
As shown in Figure 2C, the composite outcome differed between syndromes. The perfect category was more common in LRI than in UTI (77 [32%] for LRI vs 38 [16%] for UTI), whereas unnecessary antibiotics continued past day 3 were more frequent in UTI (61 [26%] for LRI vs 87 [36%] for UTI). The undertreatment composite category was more common in UTI than in LRI (9 [4%] for LRI vs 31 [13%] for UTI).
Associations between hospital-level RSR metrics and optimality outcomes
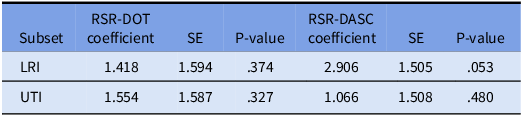
Using the ordinal composite outcome, lower hospital-level RSR-DASC tended to be associated with a higher quality of antibiotic use among LRI cases (coefficient, 2.906; SE, 1.505; P = .053), whereas RSR-DOT showed no clear association (coefficient, 1.418; SE, 1.594; P = .374). In UTI, neither RSR-DASC nor RSR-DOT was associated with the composite outcome (Table 3).
Association between hospital-level RSR metrics and the composite outcome for optimality of antibiotic use

Table 3. Long description
The table presents data on the association between hospital-level RSR metrics and the composite outcome for optimality of antibiotic use. It has four rows and six columns. The columns are labeled Subset, RSR-DOT coefficient, SE, P-value, RSR-DASC coefficient, SE, and P-value. The rows are labeled LRI and UTI. For LRI, the RSR-DOT coefficient is 1.418, SE is 1.594, and P-value is .374. The RSR-DASC coefficient is 2.906, SE is 1.505, and P-value is .053. For UTI, the RSR-DOT coefficient is 1.554, SE is 1.587, and P-value is .327. The RSR-DASC coefficient is 1.066, SE is 1.508, and P-value is .480.
Larger positive coefficients indicate a stronger association of higher RSR values with worse optimality. RSR, risk-standardized ratio; DOT, days of therapy; DASC, days of antibiotic spectrum coverage; SE, standard error; LRI, lower respiratory tract infection; UTI, urinary tract infection. The six-level outcome was coded from 1 (Perfect) to 6 (Unnecessary antibiotics continued past day 3); therefore, a positive coefficient indicates that higher RSR values were associated with greater odds of being classified into a worse prescribing-quality category.
Model-fit statistics and bootstrap comparisons
For LRI, the RSR-DASC model showed better fit than the RSR-DOT model, with a lower AIC and higher pseudo-R 2 values (Supplementary Table 2). A similar pattern was observed in the combined cohort, whereas little difference in model fit was observed for UTI. Bootstrap comparisons of model performance also favored RSR-DASC in LRI and in the combined cohort (Supplementary Table 3). However, the 95% bootstrap intervals crossed zero in all subgroups.
Discussion
In this study, we evaluated the construct validity of the RSR metrics by examining whether hospital performance on these metrics corresponded to the chart-adjudicated quality of antibiotic use for two common infections, LRI and UTI. Although a significant difference was not observed, lower hospital-level RSR-DASC showed a more consistent association with better overall antibiotic use in LRI than RSR-DOT, whereas neither metric demonstrated a clear association in UTI. In LRI, this pattern was not limited to the regression estimates; the DASC-based metric more consistently tracked chart-adjudicated prescribing quality across multiple analyses. Overall, these results suggest that RSR-DASC may reflect optimal antibiotic prescribing in LRI more closely than RSR-DOT.
Our findings are consistent with longstanding concerns regarding DOT-based benchmarking metrics, including the SAAR. Reference Edwards and Srinivasan1,Reference Goodman, Pineles and Magder3,Reference Polk, Hohmann, Medvedev and Ibrahim7,Reference Yu, Moisan and Tartof8 Prior studies have noted that aggregate utilization measures are influenced by differences in patient-level characteristics, which may limit fair comparisons across hospitals. Reference Aldeyab, McElnay and Scott2–Reference Yu, Moisan and Tartof8 Furthermore, DOT assigns equal weight to narrow- and broad-spectrum agents and therefore does not capture spectrum optimization, such as de-escalation or avoidance of unnecessarily broad empiric therapy. Reference Barlam, Cosgrove and Abbo19 In this context, incorporating spectrum information through RSR-DASC may better align benchmarking metrics with clinically meaningful stewardship constructs, at least for LRI, whereas RSR-DOT may be less closely linked to prescribing quality.
One reason why RSR-DASC may have shown a closer relationship with antibiotic-prescribing quality in LRI is the clinical trajectory and decision points typical of hospitalized respiratory infections, Reference Metlay, Waterer and Long17,Reference Jones, Chapman and Ying20 particularly CAP, which accounted for the largest subgroup of LRI cases. In hospitalized CAP, diagnostic uncertainty at presentation often necessitates empiric therapy, but most improving patients achieve clinical stability within 48 to 72 hours, making reassessment around day 3 clinically plausible. Reference Metlay, Waterer and Long17,Reference Jones, Chapman and Ying20 At that point, CAP guidelines available during the period we assessed recommended that duration be guided by clinical stability and that most patients receive a total of 5 days of therapy. Reference Metlay, Waterer and Long17 CAP studies have shown that day 3 clinical stability and microbiologic testing are associated with antibiotic de-escalation. Reference Metlay, Waterer and Long17,Reference Deshpande, Richter and Haessler21,Reference Abelenda-Alonso, Rombauts and Gudiol22 Because DASC reflects antibiotic spectrum breadth, it may therefore be more sensitive than DOT to whether empiric therapy is optimally narrowed during this reassessment. Reference Kakiuchi, Livorsi and Perencevich10
On the other hand, the absence of clear associations for UTI may reflect syndrome-specific features of inpatient urinary diagnoses and their stewardship targets. Reference Nicolle, Gupta and Bradley23–Reference Grigoryan, Naik and Lichtenberger27 . Compared with LRI, microbiologic data such as urine cultures are often obtained early and may become available in a time frame that supports antibiotic tailoring, potentially reducing between-hospital variability in selection among cases where treatment is truly indicated. At the same time, the high frequency of asymptomatic bacteriuria in this cohort suggests that a substantial portion of unnecessary antibiotic use may be driven less by spectrum-based selection and more by diagnostic and indication decisions Reference Nicolle, Gupta and Bradley23–Reference Grigoryan, Naik and Lichtenberger27 . This interpretation is supported by the fact that selection was classified as unnecessary in 38% of UTI cases. When sub-optimal use primarily reflects treatment of asymptomatic bacteriuria rather than incorrect antibiotic selection, facility-level metrics such as RSR may show weaker correspondence with chart-adjudicated antibiotic quality categories. For example, a facility that frequently treats asymptomatic bacteriuria with narrow-spectrum antibiotics may have a lower DASC despite poorer prescribing quality, compared with a facility that generally prescribes antibiotics in a more optimal manner but uses relatively broader-spectrum agents.
A key strength of this study is that it was designed to assess construct validity by comparing risk-standardized antibiotic use metrics with chart-adjudicated antibiotic-prescribing quality. By focusing on two common inpatient infections, our adjudication framework was well positioned to capture real-world prescribing decisions. The use of a composite outcome also allowed us to summarize antibiotic quality in a way that integrated multiple stewardship-relevant dimensions of care. Importantly, our findings did not rely on regression coefficients alone; the RSR-DASC model showed more favorable fit, including a lower AIC and higher McFadden, Nagelkerke, and Cox-Snell pseudo-R 2 values, and bootstrap analyses were directionally consistent, favoring RSR-DASC in 81.4% of LRI resamples and 73.5% of combined-cohort resamples, although the 95% bootstrap intervals crossed zero in all subgroups.
There are some limitations. First, chart adjudication was necessarily based on documentation in the medical record. Therefore, assessments of antibiotic-prescribing quality remained partly context-dependent, and incomplete documentation may have led to misclassification. Second, project resources precluded use of a second reviewer, but we acknowledge that having two physicians independently review each case would have provided more rigor. Third, this study assessed construct validity using a purposive sample of LRI and UTI cases from 24 VA facilities selected based on the extremes of RSR performance. While this design improves comparisons of metric performance and is efficient for chart review, it may limit generalizability to mid-performing facilities and reduce the precision of facility-specific estimates. Fourth, our assessment of antibiotic selection was only performed on day 3, thereby ignoring the appropriateness of antibiotic selection on every other day of therapy and excluding patients who were discharged before day 3. Fifth, our ordinal scale for ranking whether antibiotic therapy was optimal was somewhat subjective, favoring antibiotic therapy that was indicated—even if it was broader than necessary—over antibiotic therapy that was unnecessary. While there were other reasonable ways to design this scale, those too would likely be subjective, as the major drivers of antibiotic resistance remain poorly defined. Sixth, our assessments of whether antibiotics were optimal does not reflect some recent updates to professional guidelines, namely the recommendation to give a fluoroquinolone for as short as 5 days in males with a complicated UTI who are improving clinically. Reference Trautner, Cortes-Penfield and Gupta28 Seventh, the study period overlapped with the COVID-19 pandemic, during which stewardship activities and usual clinical operations may have been disrupted at some facilities. Future studies are needed to determine whether similar relationships between these metrics and prescribing quality are observed in more diverse hospital settings, across different study periods, and in infection syndromes beyond LRI and UTI.
In conclusion, lower hospital-level RSR-DASC showed a more consistent association than RSR-DOT with better overall quality of antibiotic use in LRI. In UTI, neither metric showed a clear relationship with antibiotic quality. We interpret our findings as supportive, but not definitive, evidence for the value of spectrum-informed, risk-standardized metrics as stewardship benchmarking tools. At a minimum, RSR-DASC appears to be a promising measure that warrants further validation across additional infectious syndromes, larger samples, and other hospital settings.
Supplementary material
The supplementary material for this article can be found at https://doi.org/10.1017/ice.2026.10562
Data availability statement
Study protocol and analytical code can be made available upon request to the authors. Study data cannot be shared per the data usage agreement and data security protocol of the US Department of Veterans Affairs.
Acknowledgements
DL had full access to all data in the study and takes responsibility for the integrity and accuracy of the data analysis. SI used ChatGPT 5.6 (OpenAI, San Francisco, CA, USA) for grammar and typographical error checking of this manuscript. The authors reviewed and edited the output as needed and take full responsibility for the content of the manuscript.
Financial support
This work was supported by an investigator-initiated research grant (I01 HX003595) from the United States Department of Veterans Affairs Health Services Research and Development Service (PI: D. Livorsi and M. Goto).
Competing interests
All authors report no relevant conflicts of interest.


 Open access

