1. Introduction
The number of Preferential Trade Agreements (PTAs) has increased dramatically in the last quarter century.Footnote 1 While 50 trade agreements were in force and notified to the WTO in 1990, the number increased to 279 by the end of 2015. This dramatic change has spurred a large debate among researchers and policy makers on the rationale for preferential arrangements, their impact on trade flows, growth, and welfare of member and non-member countries, as well as their relationship with the broader system of global trade governance. Many questions have emerged, including the following: Do PTAs allow members to commit their trade policy and internalize cross-border policy spillovers? Do they create more than divert trade? Do they serve as building blocks or stumbling blocks of the multilateral trading system? A large body of literature has been devoted to investigate these and other issues.Footnote 2
An often overlooked factor in this debate is that, alongside their increasing number, PTAs are becoming deeper over time. While before the 1990s trade arrangements mostly focused on tariff reductions, PTAs that are more recent include a set of provisions covering policy areas that go well beyond this.Footnote 3 Specifically, a number of recent studies (e.g. Horn et al., Reference Horn, Mavroidis and Sapir2010; WTO, 2011; Dür et al., Reference Dür, Baccini and Elsig2014; Kohl et al., Reference Kohl, Brakman and Garretsen2016) document that many trade agreements cover regulatory issues, such as services, intellectual property rights protection, investment, and competition policy, among others. Thus, abstracting from the expanding scope of trade agreements will lead to inaccurate and/or incomplete answers to the questions posed above on the rationale and effects of trade agreements. In particular, the lack of systematic information on the content of PTAs limits the possibility of addressing those questions with the proper tools of economics.Footnote 4
The primary purpose of this study is to analyze in detail the content of PTAs as an essential step to inform the debate on their rationale and impact. Building on the methodology developed by Horn et al. (Reference Horn, Mavroidis and Sapir2010), we collected information for all PTAs in force and notified to the WTO in 2015. Specifically, the database contains information on the inclusion of 52 policy areas and their legal enforceability in 279 PTAs among 189 countries.Footnote 5 Previous data collection efforts on the content of trade agreements either focus on a smaller set of PTAs (e.g. Horn et al., Reference Horn, Mavroidis and Sapir2010; WTO, 2011) or on a smaller set of policy areas (e.g. Dür et al., Reference Dür, Baccini and Elsig2014; Kohl et al., Reference Kohl, Brakman and Garretsen2016).Footnote 6
Some novel stylized facts emerge from the analysis of the new data on PTAs. First, the new database can inform on the content of PTAs. In addition to tariff reductions, more than half of the PTAs in the database include legally enforceable regulations in some policy areas that fall under the current mandate of the WTO. These provisions (referred to as ‘WTO plus’ or ‘WTO+’ in the literature) include areas such as customs regulations, export taxes, anti-dumping, countervailing measures, technical barriers to trade (TBT), or sanitary and phytosanitary standards (SPS), among others. Provisions outside the WTO mandate (usually called ‘WTO extra’ or ‘WTO-X’) include a wide-ranging set of policy areas from investment to environmental laws, or to nuclear safety. Legally enforceable WTO-X provisions are included in more than one-third of PTAs.
PTA provisions can be disaggregated in different ways depending on the specific question under investigation. In this paper, we divide them into ‘core’ versus ‘non-core’, border versus non-border, and preferential versus non-discriminatory provisions. Core provisions are the ones that the literature identifies as more meaningful from an economic point of view (e.g. Baldwin, Reference Baldwin2008; Damuri, Reference Damuri2012) and include all WTO+ provisions and four WTO-X areas (competition policy, investment, movement of capital, and intellectual property rights protection). Along with WTO+ provisions, those four core WTO-X policy areas appear most frequently in PTAs. Almost 90% of agreements include at least one of the ‘core’ WTO-X provisions and one-third of PTAs include all ‘core’ WTO-X provisions.
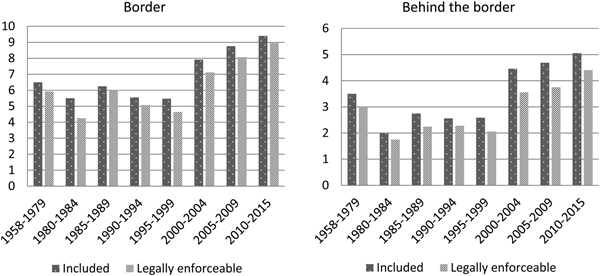
The coverage of both border provisions, such as anti-dumping duties, and behind the border provisions, such as competition policy, has increased over time. On average, five border provisions were included in PTAs signed before 2000; while PTAs signed in the last five years include on average nine border provisions. Generally speaking, the average number of behind the border provisions included in PTAs increased from two to four. Provisions can also be classified according to their application on a multilateral or preferential basis. Discriminatory provisions are the ones that apply only to members of PTAs, such as the reduction in tariffs; non-discriminatory provisions are the ones that affect both members and non-members such as a limitation in the use of subsidies. The average number of both Most Favored Nation (MFN) and preferential provisions increased over time from less than four before 2000 to more than eight for PTAs entered into force between 2010 and 2015.
Second, the data inform on the changing depth of preferential trade agreements and confirm some of the patterns in previous studies, such as WTR (2011), Dür et al. (Reference Dür, Baccini and Elsig2014), Orefice and Rocha (Reference Orefice and Rocha2014), and Kohl et al. (Reference Kohl, Brakman and Garretsen2016). The detailed information that we collected can be aggregated to construct synthetic measures of depth capturing the scope of PTAs. The first index of depth, referred to as ‘total depth’, is the simple count of policy areas with (legally enforceable) provisions included in a PTA. Total depth increased from an average of around eight in the 1990s to more than 17 in the last five years. An index of ‘core depth’ can be constructed in a similar way by counting how many core policy areas are included and legally enforceable in a PTA. Core depth increased from around seven in the 1990s to almost 14 in the period 2010–2015. Finally, we show that these measures of the depth of PTAs that capture their expanding content are highly correlated with other measures of PTA depth found in the literature (e.g. Dür et al., Reference Dür, Baccini and Elsig2014).
Third, the wide country coverage of the data set allows us to analyze the heterogeneity of deep PTAs across regions and income levels. We do this through a simple comparison of depth indicators and, more formally, by constructing indicators of similarity across PTAs that have been used in the literature (e.g. Alschner et al., Reference Alschner, Seiermann and Skougarevskiy2017). Europe is the region with the highest number of PTAs signed. Moreover, these PTAs are also the deepest mainly because of the EC-Treaty and subsequent enlargements of the EU. The average total depth of EU agreements is 25. Members of EFTA, Japan, and the Republic of Korea also tend to sign deep PTAs with an average of 23, 21, and 20 policy areas respectively. PTAs signed between developed and developing countries (i.e. North–South PTAs) include on average almost as many policy areas as North–North PTAs. The depth of North–North PTAs in force is around 22 while the depth of North–South PTAs is 20. However, legal enforceability especially of WTO-X policy areas is generally weaker in North–South PTAs relative to North–North. Finally, South–South trade agreements tend to be shallower than other PTAs with an average total depth of 13. This reflects the fact that most trade agreements among developing countries mainly focus on more traditional trade policy issues included in the set of WTO+ provisions.
Fourth, the information in the database allows us to apply standard economic tools to analyze the impact of deep PTAs on trade and other relevant economic variables. In this paper, we intuitively show that the scope of PTAs is correlated with the intensity of trade global value chain (GVC) trade. The expanding scope of PTAs, even including policy areas not necessarily closely related to trade (such as many of the WTO-X provisions), does appear to have a positive association with trade. The data are used in two recent studies (Mattoo et al., Reference Mattoo, Mulabdic and Ruta2017; Osnago et al., Reference Osnago, Rocha and Ruta2018a), which use a standard gravity approach to carefully look at the impact that deep PTAs have on goods and on global value chains trade, respectively, while controlling for other determinants of trade flows and for endogeneity problems.
The rest of the paper is structured as follows. Section 2 presents the legal background and methodology of the study, including the scope of the analysis and the definition of legal enforceability. Section 3 takes a first look at the data by focusing on the content and depth of PTAs. Section 4 analyzes how deep agreements vary by region and income level, and sheds light on their correlation with trade intensity. The final section discusses knowledge gaps and specific needs for further data mining on the content of PTAs.
2. The new database: coverage and legal issues
This section discusses the scope of the analysis and the key legal issues. We first review previous studies on the content of trade agreements. We then present the policy areas covered in the current database and the notion of legal enforceability used in this paper. The last subsection focuses on the methodology used to code the agreements.
2.1 Previous studies on the content of PTAs
In 2010, Horn, Mavroidis and Sapir (hereinafter referred to as ‘HMS’) published a paper on the content of preferential trade agreements. By focusing on the content of 14 US and 14 EU PTAs, their research developed a methodology to classify the provisions covered by PTAs and to assess their legal enforceability. Specifically, HMS identified a set of 52 reoccurring policy areas in PTAs, that were then further divided into WTO plus or ‘WTO+’ and WTO extra or ‘WTO-X’ provisions. According to HMS, WTO+ stands for those policy areas that fall under the current mandate of the WTO, while WTO-X refers to obligations outside the WTO's mandate. Furthermore, HMS classified provisions as legally enforceable if the legal language is sufficiently clear and the use of dispute settlement under the PTA has not been excluded. Meanwhile, a provision with no reference to dispute settlement procedures under the Agreement or with weak legal language is considered not legally enforceable.
Building on HMS, in 2011 the WTO conducted an in-depth study on PTAs and their embedment in the multilateral trading system. The research, published in the World Trade Report 2011 (hereinafter referred to as ‘WTR 2011’), extended the previous database to 100 PTAs signed by 178 countries. The WTO report highlighted potential overlaps between the multilateral trading system and existing PTAs with a central part of it analyzing content, commitments as well as the depth and legal enforceability of provisions. Moreover, the WTR 2011 elaborated on the nature of trade relations, commitments undertaken in PTAs, as well as on countries’ motivations for entering into such trade agreements. In this regard, a key novel finding of the WTR 2011, supported with a background study by Orefice and Rocha (Reference Orefice and Rocha2014), was the positive association between deeper integration and trade in parts and components, a proxy of GVC integration.
In recent years, a number of different studies have picked up on the HMS methodology, either expanding or applying it to a new focus.Footnote 7 Kleimann (Reference Kleimann2014) used the HMS methodology partly as a basis to study the coverage and depth of the ASEAN agreement as well as of agreements concluded by individual ASEAN members with third countries. In addition, Kleimann (Reference Kleimann2014) also attempts to analyze the depth of some WTO+ provisions, i.e. to what extent the PTAs create rules that go beyond the WTO legal status quo.Footnote 8 Villalta Puig and Dalke (Reference Villalta Puig and Dalke2016) apply the HMS methodology to analyze the legal enforceability of sanitary and phytosanitary measures (SPS) and technical barriers to trade (TBT) provisions in Canada's PTAs. Kohl et al. (Reference Kohl, Brakman and Garretsen2016) focus on 13 WTO+ and 4 WTO-X provisions identified by HMS and expand the coverage of preferential trade agreements to 296.Footnote 9 Similarly to all these studies, the new database is built on the methodology developed by HMS. Differently from HMS and WTR 2011, we investigate a much broader sample of PTAs. Also differently from Kleimann (Reference Kleimann2014), Villalta Puig and Dalke (Reference Villalta Puig and Dalke2016), and Kohl et al. (Reference Kohl, Brakman and Garretsen2016), the new database assesses the coverage of an extended set of policy areas in PTAs, and is not focused on a selected number of provisions. This latter feature allows us to investigate in Sections 3 and 4 the non-core provisions in PTAs, the broader scope of trade agreements, the similarities/differences in content across PTAs by income and geography groups, and the impact of deep PTAs on trade flows.
Nevertheless, the HMS approach to the collection and analysis of the content of PTAs is not the only one. The Design of Trade Agreements Database (DESTA) developed by Dür et al. (Reference Dür, Baccini and Elsig2014) looks in more detail at the content and depth of specific provisions in PTAs for a sample of over 620 trade agreements, which include both PTAs in force and those no longer in force. While coverage is limited to ten policy areas, the coding evaluates a number of aspects for each area ranging from the inclusion of a chapter on the PTA to details on national treatment or harmonization of policies.Footnote 10 In this respect, DESTA offers a first attempt to analyze the stringency of specific rules and policy commitments in PTAs, therefore providing information that is complemented by our new database. A number of studies based on DESTA have analyzed the relationship between the changing content of PTAs and trade flows (Dür et al., Reference Dür, Baccini and Elsig2014), the content of specific trade agreements such as the Canada–EU agreement (Allee et al., Reference Allee, Elsig and Lugg2017), or the evolving content of specific provisions in PTAs, such as dispute settlement rules (Allee and Elsig, Reference Allee and Elsig2016).Footnote 11
Recent studies have looked at the content of PTAs from the perspective of a single policy area. Acharya (Reference Acharya2016) is a collection of papers mapping in detail a number of provisions related to, among others, anti-dumping, safeguards, TBT, and rules of origin. Current work at the WTO and the World Bank is also focusing on a more detailed mapping of different sets of policy areas included in all PTAs in force in order to examine when and how PTAs go beyond WTO obligations.
The new database presented in this paper covers all PTAs notified to the WTO and in force as of December 2015.Footnote 12 This amounts to a total of 279 PTAs signed by 189 countries between 1958 and 2015.Footnote 13 The database helps to gain a better understanding on the extent to which countries regulate policy areas covered by the WTO in their PTAs, as well as those aspects not regulated by the latter. The database allows for extended research on the evolution of the content and depth of PTAs over time, by region, and by level of development. The central idea is, hence, to provide a picture on deep integration at the global scale. We use economic intuition and statistical methods to develop new measures on the content and the depth of PTAs.
2.2 Areas covered in the database
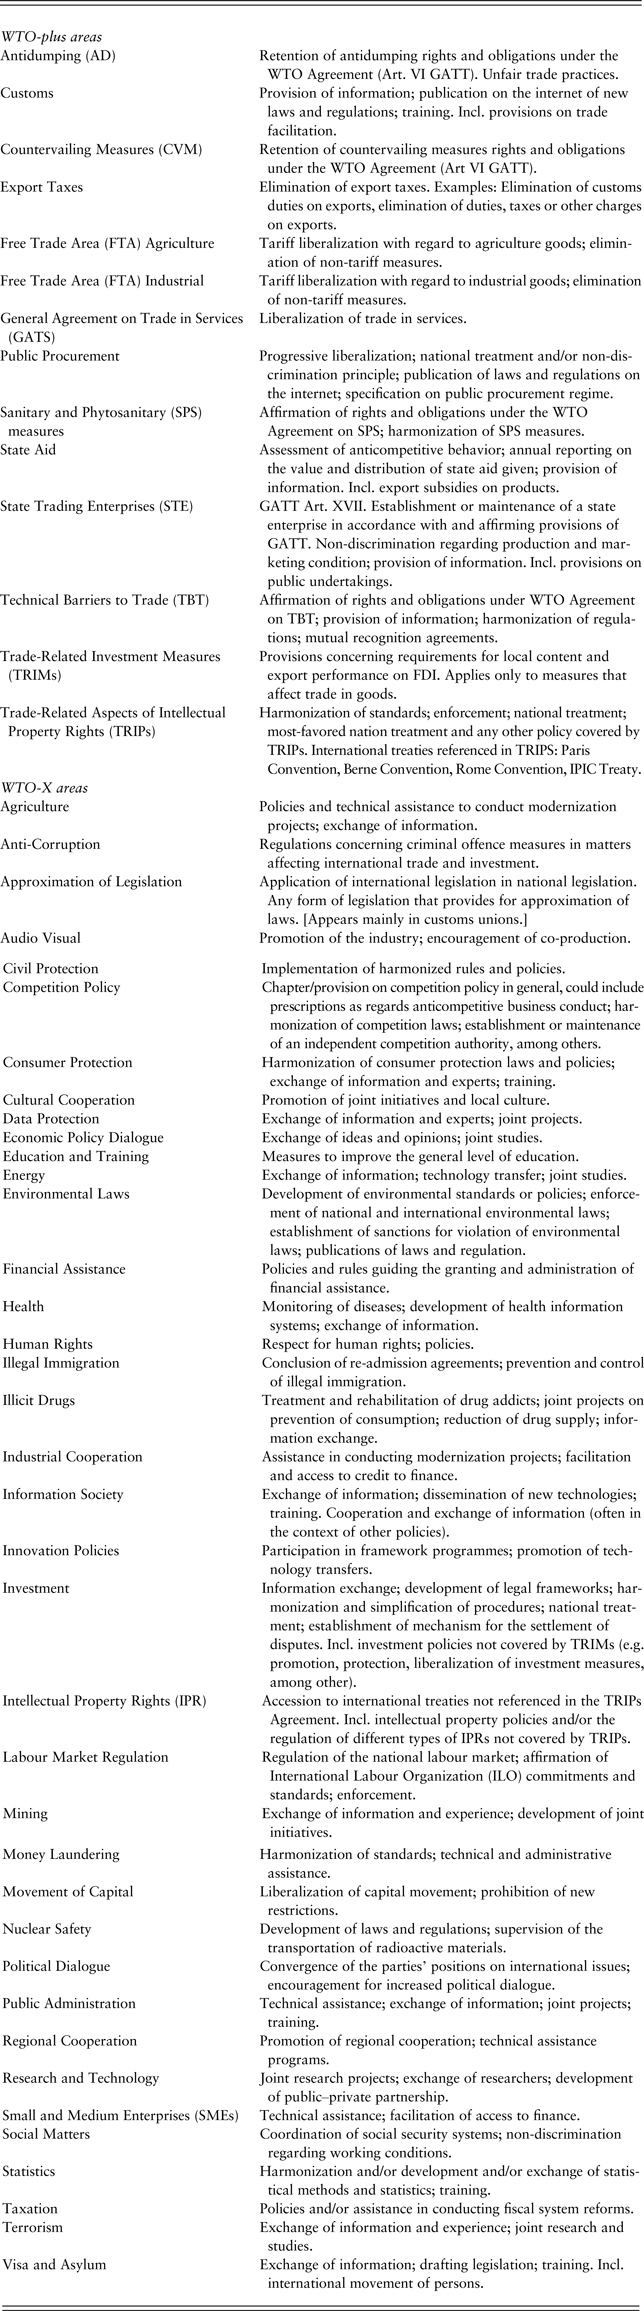
Our approach covers 52 policy areas that are further divided into two groups of 14 WTO ‘plus’ or WTO+ and 38 WTO ‘extra’ or WTO-X areas (Table 1). WTO+ provisions in PTAs reconfirm existing commitments and, in some cases, provide for further additional obligations. WTO-X provisions, on the contrary, refer to policy areas that are not yet regulated by the WTO. A policy area is considered as being ‘covered’ by an agreement if the agreement contains an article, chapter, or provision, providing for some form of undertaking in this field.Footnote 14 The next subsection discusses the methodology for the assessment of legal enforceability of provisions.
Description of policy areas and coverage

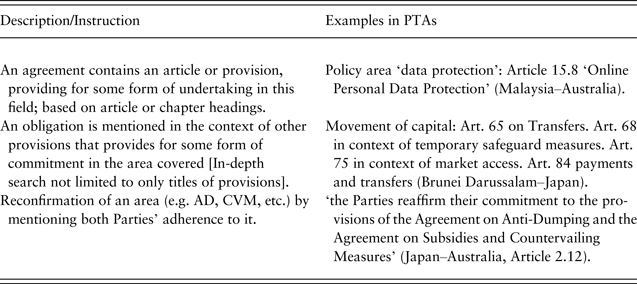
In assessing coverage of the agreements, we looked for the presence of provisions explicitly covering one of the 52 policy areas. Some areas, such as antidumping or environmental laws, are fairly straightforward and could be easily identified. During the mapping of PTAs, we noticed that most agreements that cover these two policy areas contain either a clear provision titled ‘antidumping’ or ‘unfair trade practices’, or – in the case of environment – provisions or chapters on environmental laws and policies. Nevertheless, other policies need more explanation in terms of their coverage and interpretation. Such areas include, inter alia, export taxes or state trading enterprises. In the case of export taxes, agreements often refer to ‘(customs) duties on exports’;Footnote 15 state trading enterprises are sometimes referred to as ‘public undertakings’,Footnote 16 and state aid is often disguised as ‘export subsidies on (agricultural) products’.Footnote 17 As a consequence, coverage is not always straightforward, which is why an in-depth analysis of the agreements is needed that goes beyond the search for keywords or provisions.
In addition, some policy areas covered by PTAs might be divided into different provisions. This is the case for investment and intellectual property as commitments in these areas have been undertaken in the WTO with regard to some obligations, but not others. Consequently, the policy is divided between WTO+ and WTO-X, which – in the mapping of such areas – requires exact knowledge on the extent of regulation in the WTO. Specifically, the category of TRIMS measures is included in WTO+ and covers anything that reconfirms commitments undertaken in the WTO Agreement on Trade-Related Investment Measures. This includes provisions on requirements for local content and export performance on foreign direct investment, and applies only to measures that affect trade in goods. On the other hand, investment policies are covered by WTO-X if a PTA contains a chapter or provisions on the more general topic of investment such as on the promotion, protection, and liberalization of investment measures or common investment policies. Similarly, the policy area of TRIPS in WTO+ covers anything that reconfirms commitments undertaken in the WTO. This includes, inter alia, harmonization of standards, enforcement of intellectual property rights, national treatment, or most-favored nation treatment in areas of intellectual property covered by the Agreement. The policy area of IPRs included in the WTO-X category covers anything that goes beyond commitments undertaken in TRIPS (e.g. reconfirmation of adherence to Intellectual Property treaties not cited in TRIPS).
Moreover, in some policy areas, the distinction between WTO+ and WTO-X imposes some limitations to the analysis. This is most clearly the case for services trade. The area of services is considered as a whole and covered under GATS in WTO+, although it could have further been divided into different services sectors each one allocated to either WTO+ or WTO-X. In order to broadly follow HMS’ approach, we consider services as a single policy area, which may or may not be included in a PTA. Nonetheless, several of the PTAs in our database contain provisions on services that go beyond GATS, breaking new ground such as transport services, e-commerce, air services, telecommunication services, or financial services, just to name a few. For instance, e-commerce provisions in PTAs have largely increased after 2000, most likely in response to the growing importance of digital trade. The current categorization does not provide the level of granularity that would allow highlighting these developments.
Another important issue to consider is that there are significant differences in the drafting and structuring of PTAs depending on whether these are Free Trade Agreements (FTAs) between two or more countries, customs unions, or enlargement and accession agreements. We analyze all these agreements with the same parameters, even though this approach presents difficulties as each individual type of PTA has its own particularities. An example is the coding of accession agreements. These agreements usually confirm, amend, or modify what has been agreed upon in the original PTA by adding a few specifics for the acceding country. However, sometimes the accession agreement as such does not repeat explicitly all areas covered in the original PTA and is drafted and structured in a different way. Hence, an area covered by the agreement that a country is acceding to might not specifically appear in the text of the accession documents of the acceding country. Thus, there is a need to evaluate the content of these agreements in conjunction with the original text of the PTA the country is acceding to.
2.3 Considerations on the notion of legal enforceability
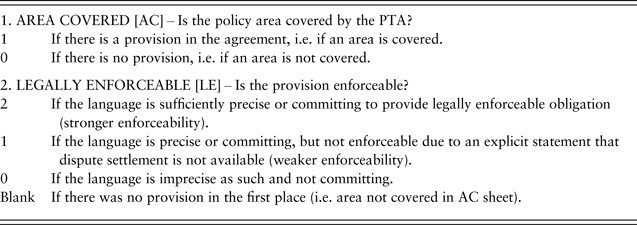
In a second step, we analyze and define the legal content of an obligation.Footnote 18 An area that is covered might still not be legally enforceable due to unclear or loosely formulated legal language. In general terms, a policy area is considered as legally enforceable if the language used is sufficiently precise and committing and if it has not been excluded from dispute settlement procedures under the PTA. Our database allows distinguishing between the different scenarios.
While a complete classification is not possible, below we provide examples of language that we consider characterize legally enforceable provisions.
• ‘Control, inspection and approval procedures shall be carried out in accordance with the provisions of Article 8 and Annex C of the SPS Agreement’ (PTA China–Costa Rica, Article 64, Chapter 6 on Sanitary and Phytosanitary Measures) [emphasis added].
• ‘Neither Party may maintain or institute any duties, taxes or other fees and charges imposed on, or in connection with, the exportation of goods to the other Party, or any internal taxes, fees and charges on goods exported to the other Party that are in excess of those imposed on like goods destined for internal sale’ (PTA EU–Republic of Korea, Article 2.11, Section C on Non-Tariff Measures) [emphasis added].
• ‘Panama shall adhere to the Patent Cooperation Treaty (Washington 1970, last modified in 2001) within a period no longer than two years, beginning on the date of entry into force of this Agreement’ (PTA EU–Central America, Article 276, Title VI Intellectual Property) [emphasis added].
Similarly, the following examples offer an idea of provisions that contain language we classified as not being legally enforceable.
• ‘Each Party should encourage enterprises operating within its territory or subject to its jurisdiction to voluntarily incorporate internationally recognized standards of corporate social responsibility in their practices and their internal policies, including statements of principle[s] … such as … anti-corruption’ (PTA Canada–Republic of Korea, Article 8.16 on Corporate Social Responsibility and corruption in investment measures) [emphasis added].
• ‘The Parties shall strengthen their co-operation in the field of technical regulations, standards and conformity assessment, with a view to increasing the mutual understanding of their respective systems and facilitating access to their respective markets’ (PTA EFTA–Chile, Article 17 on technical regulations) [emphasis added].
• ‘The Parties recognize the importance of regional and multilateral initiatives to eliminate bribery and corruption in international trade and investment. The Parties shall work jointly to encourage and support appropriate initiatives in relevant international fora (PTA US–Panama, Article 18.9 on cooperation in international fora) [emphasis added].
The current study bases its consideration on whether a policy area is legally enforceable or not on the drafting of the legal language as well as on the availability of dispute settlement under the PTA. In other words, first we look at whether the language of provisions for a particular policy area is sufficiently strong and, if so, in a second step, we review if dispute settlement under the PTA is available for the specific policy. Several PTAs also foresee the exhaustion of other means of redress or internal remedies within a reasonable period of time before dispute settlement under the PTA becomes available. This ‘reservation of domestic policy space’ does not explicitly exclude them from the use of dispute settlement, it nevertheless implies a ‘weaker’ mechanism to solve disputes and has also been coded as such in this study.Footnote 19 This procedure might be less strong than direct referral to a fully developed dispute settlement mechanism with thorough processes, but it is also a means to resolve the issue peacefully and in a cost-effective manner.
Users of the database should be mindful of a few caveats concerning legal enforceability. Dispute settlement in this study focuses on the settlement of disputes under the PTA. Hence, it has to be taken into consideration that if dispute settlement is not made available under the PTA or if reference is made to national or international legislation to solve trade quarrels, a policy area is not necessarily less likely to be implemented in practice. Moreover, even though in some cases recourse to dispute resolution under the PTA is excluded, the drafting and precision of some of the provisions might still lead to the impression of an area being enforceable. While some of the agreements contain elaborate procedures in the form of a whole chapter on dispute settlement, others rather restrict their consideration of settling disputes to one provision of general nature. Hence, there are quite some differences as regards the structure, drafting, and enforceability of dispute settlement itself – even if made available for a particular policy area.
In addition, some PTAs further regulate the manner in which dispute settlement is available for particular policy areas and go beyond the clear-cut distinction that is looked at in this study. In the PTA ‘Mexico–Uruguay’, specific distinctions are made for invoking dispute settlement for, inter alia, cases of nullification or impairment of benefits. In other words, a Party is allowed to refer a specific case to dispute settlement under the PTA even if the Agreement as such has not been violated, but it is felt that one Party is deprived of a benefit due to the other Party's actions. This scenario – referred to as the nullification or impairment of benefits – is only available for certain policy areas under the PTA. However, violation complaints regarding the specific infringement of a provision can be made with regard to any possible scenario under the agreement. Moreover, as a second observation, some PTAs also specify those measures subject to the General Exceptions. In other words, not all provisions can be justified under the General Exceptions provisions, which is restricted to certain policy areas only. In this regard, it has to be kept in mind that the research undertaken is solely based on whether dispute settlement is available in general terms and does not go into the depth of specific dispute settlement procedures as such under the PTA as demonstrated in this paragraph.
Finally, the use of different legal language depending on the year in which the PTAs were drafted poses an additional challenge to the construction of the database. PTAs that were negotiated more than 20 years ago were generally drafted in a different and simpler way than recent ones. This difference in style, however, does not necessarily mean that only provisions in recent PTAs based on language that is more complex are legally enforceable. Hence, the question of enforceability has to be considered as well in its historical context, which includes another degree of discretion.Footnote 20
2.4 Coding procedure
The methodology applied to code the PTAs follows Horn et al. (Reference Horn, Mavroidis and Sapir2010), which was also applied by the WTO in its World Trade Report 2011. Some of the authors played an active part in the research conducted for the WTR 2011 and thus ensured that the methodology and its implementation were in line with the coding of the 100 original PTAs mapped by the WTO. The legal team that undertook the coding for this study was trained and instructed by the authors who also reviewed and double-checked the coding of all PTAs.Footnote 21
The methodology entails two steps. The first step of the coding procedure is to determine whether a policy area is covered. Table 2 lists the three cases in which a policy area is considered covered by an agreement along with illustrative examples. In the second step, we analyze and determine the legal enforceability of each policy area following the reasoning discussed in the previous subsection. Table 3 shows all the possible numerical values associated to each variable in the dataset used in the coding. The results of the coding are summarized in an excel file containing four sheets: (1) WTO+ provisions – area covered; (2) WTO+ provisions – legal enforceability; (3) WTO-X provisions area covered; and (4) WTO-X provisions – legal enforceability.
Conditions for area covered

Coding of areas covered and legal enforceability

3. The depth and content of PTAs
This section takes a first look at the new data. Our focus is on the content and depth of the preferential trade agreements covered in our sample. Specifically, we propose different classifications of the content of trade agreements and develop new measures of the depth of PTAs.
3.1 The content of PTAs
The large number of provisions identified and coded in the data set allows us to analyze in detail the content of each PTA. Provisions can be divided into different categories that shed light on different aspects of the disciplines included in PTAs. From a legal perspective, provisions can be split into areas that are already covered by the WTO (WTO+ provisions) and those that go beyond the current WTO mandate (WTO-X). Furthermore, some provisions are more economically relevant than others and form a set of ‘core’ rules for market access and for the smooth functioning of global value chains (Baldwin, Reference Baldwin2008; Damuri, Reference Damuri2012). These ‘core’ provisions can be analyzed using two different lenses. The first categorization reflects whether core provisions are implemented at the border or behind the border. Alternatively, some core provisions are intrinsically discriminatory (or preferential) while others cannot be applied bilaterally and are therefore applied on a non-discriminatory (or MFN, for Most Favored Nation) basis.
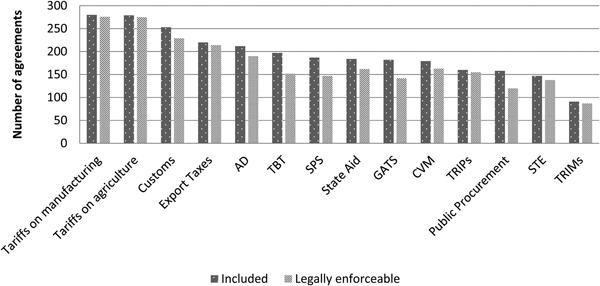
A large number of PTAs cover policy areas that fall under the current mandate of the WTO and go beyond tariff reductions (see Figure 1). All PTAs in force in 2015 include tariff reductions on manufactured goods. More than 200 PTAs include customs, export taxes, and anti-dumping provisions. All other WTO+ provisions except TRIMS are included in more than half of the PTAs. Moreover, customs, export taxes, anti-dumping, state-aid provisions, and countervailing measures are legally enforceable in more than 160 PTAs. Technical barriers to trade (TBT) and sanitary and phytosanitary standards (SPS) are legally enforceable in 152 and 147 PTAs respectively.
Number of PTAs covering WTO+ policy areas

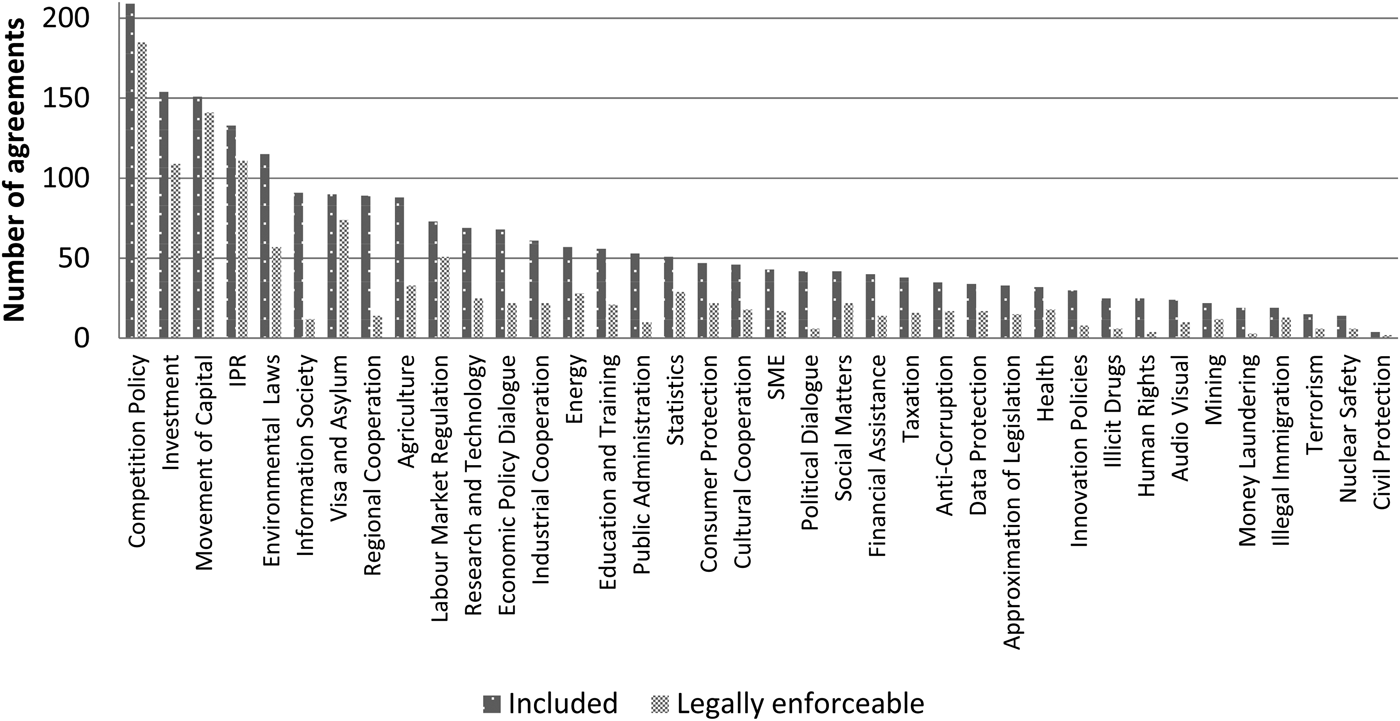
Only a few WTO-X policy areas, such as competition, movement of capital, investment rules, and IPR, are included and legally enforceable in a relevant number of trade agreements (see Figure 2) Competition policies are included in more than 200 PTAs and are enforceable in 185. Movement of capital and investment are included in more than 150 PTAs but legal enforceability differs: almost all provisions on movement of capital are legally enforceable (141), while this does not apply to investment provisions (i.e. only 109 from more than 150 PTAs contain legally enforceable policies). IPR is also enforceable in only 111 PTAs. All other WTO-X policy areas are legally enforceable in less than 25% of PTAs.Footnote 22 In this set, the policy areas that are most often covered and legally enforceable are environmental laws, visa and asylum disciplines, and labor market regulations.
Number of PTAs covering WTO-X policy areas

Many of the 52 provisions covered in our database go beyond trade issues. Identifying the set of ‘core’ provisions is an exercise that is inevitably subject to judgment. We define as core provisions the ones that are part of the WTO mandate (WTO+ provisions) and four of the WTO extra provisions: competition policy, investment, movement of capital, and intellectual property rights. These 18 provisions define a basic set of rules for market access and for the smooth functioning of global value chains (Baldwin, Reference Baldwin2008; Damuri, Reference Damuri2012).
Not only ‘core’ provisions are relevant from an economic theory perspective, but they are also those that are more often included in trade agreements. One-third of PTAs in force include legally enforceable provisions covering all the core policy areas. With the exception of STE, public procurement, IPR, investment, and TRIMS, all core policy areas are included and legally enforceable in at least half of the PTAs. Particularly important are customs procedures, export taxes, anti-dumping, and competition policies, which are legally enforceable in at least two-thirds of the PTAs.
Along with WTO+ provisions, the four core WTO-X policy areas, namely competition policy, investment, movement of capital, and intellectual property rights, are important features of deep PTAs. Almost 90% of agreements include at least one of the ‘core’ WTO-X policy areas and one-third of PTAs include all ‘core’ WTO-X policies. When taking into consideration legal enforceability, these shares are respectively 83.5% and around 15% of the PTAs in the sample.
Core provisions in our data set can be also classified as border and behind-the-border provisions, depending on whether the policy that the provision regulates is applied at the border or not. Provisions on tariff reduction in manufacturing and agriculture, anti-dumping, countervailing measures, TRIMS, TRIPS, customs, export taxes, SPS, TBT, and movement of capital are mostly border provisions. State enterprise, state aid, competition policy, IPR, investment, public procurement, and GATS are to a larger extent behind the border provisions.
The depth of PTAs increased due to the inclusion of a higher number of both border and behind the border measures. Figure 3 shows the evolution of the average number of border and behind the border policies included in PTAs. The average number of both border and behind the border policies remained roughly constant until the end of the 1990s. Around five border and two behind the border policy areas were included on average in PTAs signed before 2000. These numbers have steadily increased to nine and almost five respectively in the last fifteen years.
Average number of border and behind the border measures over time

Another possible categorization of core policy areas is between preferential and non-discriminatory provisions (Baldwin and Low, Reference Baldwin and Low2009). Preferential provisions are those that apply only to the countries that signed the PTA. This category includes tariffs on manufacturing and agricultural goods, public procurement, export taxes, anti-dumping, and countervailing measures. Other provisions have for the most part a non-discriminatory nature, and, when included in a PTA, the presumption is that they can only be applied on an MFN basis. Customs, SPS, TBT, TRIMS, GATS, TRIPS, movement of capital, state-owned enterprises, state aid, competition policy, IPR, and investment are classified as MFN provisions.
PTAs became deeper over time by including more policy areas that are both MFN and preferential. Figure 4 shows that the number of both types of provisions increased over time, especially after 2000. The average number of MFN provisions more than doubled between the period 1980–1984 and 2010–2015 going from less than four to more than nine. The same happened for legally enforceable MFN provisions. The increase in the number of preferential provisions has been less remarkable. The number of provisions remained quite stable around four for all the periods before 2000 and it has slowly increased over the last fifteen years, reaching slightly more than five provisions on average. Legal enforceability of preferential provisions seems to be quite strong.
Average number of MFN and preferential policy areas

3.2 Measuring the depth of PTAs
The information extracted from the texts of the agreements can be systematized and used to construct synthetic indices capturing an important aspect of the depth of PTAs, its expanding scope. Specifically, we construct three different indexes. The first measure is a simple count of provisions in PTAs, we refer to this as ‘total depth’. We then look at the subset of economically relevant, or core, provisions and develop a second measure of depth based on the count of these provisions. We refer to this second measure as ‘core depth’.
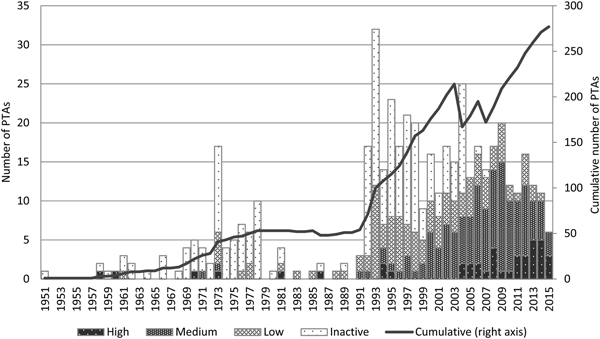
The most obvious measure of depth of PTAs is the number of provisions (legally enforceable or not) contained in an agreement. Agreements signed in more recent years tend to be deeper (i.e. include more policy areas) than traditional (shallow) agreements (see Figure 5).Footnote 23 The line in the figure, which represents the cumulative number of PTAs in force in each year, clearly shows the proliferation of PTAs starting from the beginning of the 1990s. The bars represent the number of PTAs signed in each year. Each bar is split into four categories with a gradually lighter color: high depth (i.e. number of PTAs including more than 20 areas), medium depth (i.e. number of PTAs covering between ten and 19 areas), low depth (i.e. number of PTAs including less than ten areas), and inactive (as of 2015). The figure suggests an increase in the number of policy areas covered in PTAs that are more recent: agreements signed in the last years tend to cover at least ten policy areas. Average depth increased steadily starting from 1990 going from an average of 11 provisions for PTAs signed between 1990 and 1994 to 23 provisions for PTAs signed between 2010 and 2015. On average, PTAs signed before 1990 included around 15 provisions. The relatively high depth in these periods is mainly due to the EC Treaty and successive enlargements of the European Union (at the time, European Community).Footnote 24 If legal enforceability is taken into account, the level of depth declines slightly but the general pattern is the same. The average number of legally enforceable provisions in the 1990s was between eight and nine while PTAs signed in the last five years include more than 17 legally enforceable provisions.
Number of trade agreements over time and depth

As discussed in the previous section, a subset of 18 core provisions can be identified in the data set. We construct an alternative measure of depth based on this subset of provisions. The evolution of core depth over time is very similar to total depth suggesting that many PTAs share some sort of minimal common ground in terms of relevant provisions included. The average number of core provisions included in PTAs increased steadily after 1990. In addition, the legal enforceability of provisions in core policy areas is quite common. Before 2000, the average number of legally enforceable core provisions included in PTAs was less than 10. Agreements signed between 2010 and 2015 include on average close to 14 core provisions.
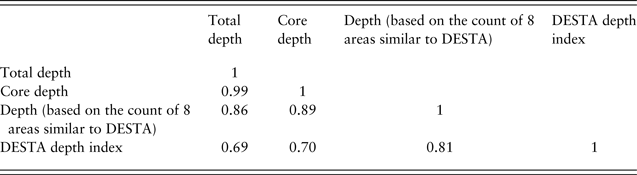
The variables constructed are measures of the scope of PTAs. The approach used in DESTA, instead, while focusing on a more limited set of policy areas, tries to measure how far specific commitments go in PTAs. The two sets of information shed light on different but complementary aspects of PTA depth. Moreover, as Table 4 shows, the correlations between measures of depth constructed using our database and those provided in DESTA are quite strong. The correlation between the DESTA depth index available online and a depth index that counts similar provisions based on our data is equal to 0.81.
Correlation with DESTA dataset

Note: The eight areas counted for comparison to DESTA are TBT, public procurement, TRIMS, investment, GATS, TRIPS, IPR, and competition policy.
3.3 Similarity across agreements
When negotiating trade agreements, countries often use templates and previous negotiated agreements as a reference. The dataset can be used to identify empirically whether PTAs tend to be similar to each other and if templates evolved over time.
Sophisticated techniques can be used to calculate the similarity of PTAs. Alschner et al. (Reference Alschner, Seiermann and Skougarevskiy2017) digitized the texts of PTAs and used textual similarity tools to assess their design patterns on the global, national, and chapter level. We follow a similar approach but instead of calculating the similarity of the legal texts, we calculate the similarity in terms of areas covered by the agreements. We believe that the two approaches are complementary and, while they can provide different insights, the general patterns are coherent.
We compute the Jaccard similarity index of all PTAs in our dataset and consider legal enforceable provisions.Footnote 25 Given two agreements with 52 binary provisions each, the Jaccard similarity index measures the overlap of those agreements in terms of policy areas. The index is defined as follows:
 $$J_{\,pq} = \displaystyle{{P_{\,pq}^{11}} \over {P_{\,pq}^{10} + P_{\,pq}^{01} + P_{\,pq}^{11}}} $$
where  $P_{pq}^{11} $ is the total number of provisions included in both agreements p and q,
 $P_{pq}^{10} $ is the number of provisions included in p but not in q, and
 $P_{pq}^{01} $ is the number of provisions included in q but not in p. J pq is increasing in the number of provisions that two agreements have in common and its range is between 0 and 1.Footnote 26 Therefore, it gives an idea of how similar two agreements are in terms of what provisions they cover. Similar techniques could potentially be used to get a sense of how often a pair of policy areas is bundled together and included in an agreement.
Given the ‘bilateral’ nature of the index and the large number of PTAs included in the dataset, it is not easy to summarize the results in a single table or figure. We provide some insights regarding the patterns of similarity across the agreements of some regions in the next section.
4. Deep PTAs, geography, income levels, and trade
The patterns outlined above are average trends in the depth and content of preferential trade agreements. However, modern PTAs are not the same across countries and regions. Countries in Europe tend to sign much deeper PTAs relative to those signed in other regions such as South Asia. The depth of integration is therefore heterogeneous across the world. Moreover, the content of trade agreements varies widely. In particular, the underlying objectives of PTAs signed between developed countries may not be the same as those of PTAs signed between developed and developing countries or among developing countries. In this section, we provide evidence of such heterogeneity across regions and income levels. Finally, we document the relationship between deep PTAs and international trade.
4.1 Heterogeneity of PTAs across countries
Geography
European countries are the most engaged in trade agreements. At the end of 2015, the EU was involved in 43 trade agreements including the EC-Treaty, six EU enlargements, and 36 PTAs with third countries. Each EFTA country (Iceland, Liechtenstein, Norway, and Switzerland) has around 30 agreements in force in 2015. Other countries with more than 15 agreements in force are Chile (22), Singapore (21), Turkey and the Russian Federation (18), and Ukraine (15). Africa and part of South America are lagging behind in terms of the number of agreements in which they are involved.
European countries are also the group of countries with the deepest agreements, largely due to EU membership. Agreements signed by the EU in force in 2015 include on average more than 25 policy areas. The deepest relationship is that among EU members including 44 legally enforceable policy areas. Agreements signed by members of EFTA include around 23 policy areas on average. Also, PTAs signed by Japan and Korea are quite deep and include on average 21 and 20 policy areas respectively. Other high-income countries such as the United States and Australia; Taiwan, China; and most Latin American countries established relatively deep relationships with their partners. On the other hand, South East Asian countries do not seem to be involved in very deep agreements.
A large number of PTAs are signed by countries in the same region. Asia and Europe signed the highest number of intra-regional agreements: there are 45 intra-Asia and 41 intra-Europe PTAs. The Americas are also very involved in PTAs with 38 intra-regional agreements. Among intra-regional agreements, those signed by European countries are the deepest with on average nine WTO plus policy areas and seven WTO-X policy areas. Agreements signed between American countries are also relatively deep with 11 WTO plus and four WTO-X policy areas. The number of inter-regional PTAs is in general lower with the exception of agreements signed between European and Asian countries (50 PTAs). Almost 30 inter-regional PTAs have also been signed between America and Asia. However, Asian–American agreements are deeper (more than 16 policy areas on average) than Asian–European agreements (almost 11 policy areas on average).
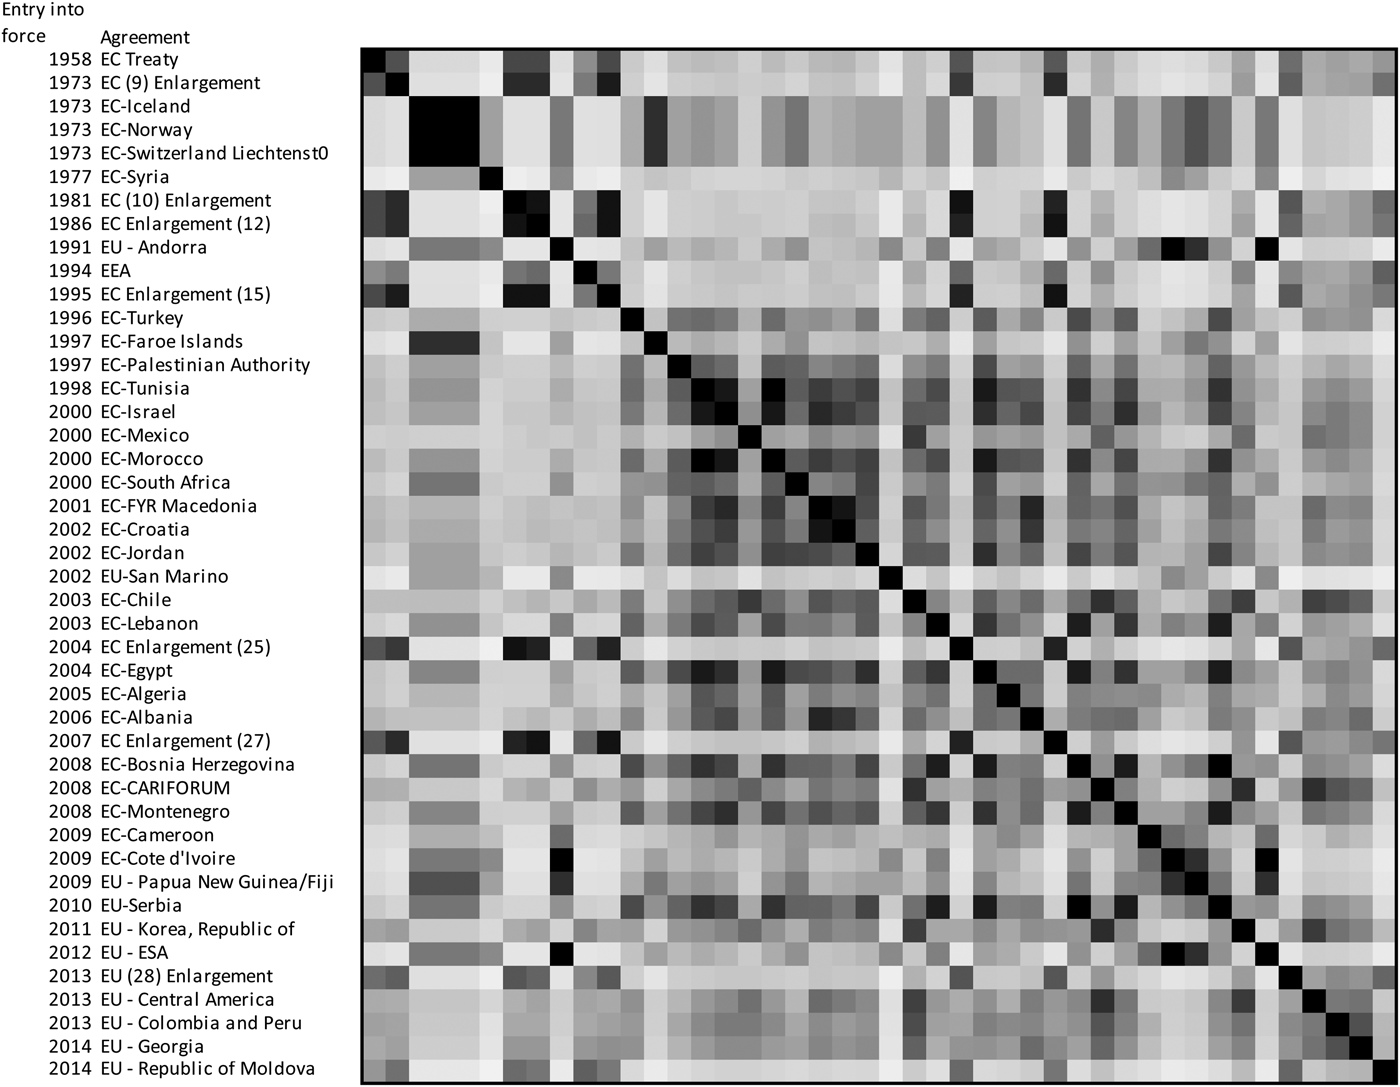
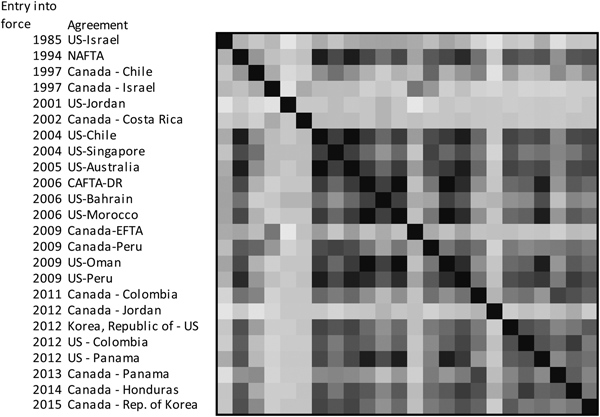
Figures 6 and 7 illustrate the similarity of agreements signed by the EU and by Canada and the US respectively. Each cell of the matrix corresponds to a pair of agreements (one in the row and one in the column). Dark gray identifies PTA pairs that scored a higher similarity while light gray identifies PTA pairs with lower similarity. The matrix is symmetric and the diagonal compares each treaty to itself and it is therefore equal to 1. Agreements in each figure have been sorted according to their date of entry into force. The visual inspection of the matrices suggests that some countries adopted different approaches when signing PTAs over time and depending on their partners.
Similarity across EU agreements

Similarity across North American agreements

The agreements establishing the EU and its subsequent enlargements tend to be relatively similar to each other and they tend to be relatively different from PTAs signed with other countries. The dark area in the center of the figure suggests that the EU tended to include similar sets of policy areas in the PTAs signed starting from the end of the 1990s. Also, while older PTAs with EFTA countries signed in the 1970s are similar to each other, they are relatively different from other PTAs. The US clearly tended to sign relatively similar PTAs with the exception of US–Israel and US-Jordan. Older Canada agreements seem to be quite unique, but over time they became more similar to the PTAs signed by the US.
Income levels
A second issue is whether PTAs differ depending on the level of development of PTA partners. The reason for signing trade agreements could be different depending on the countries involved and on the level of liberalization already achieved. For example, since MFN tariffs are already low in developed/North countries, an agreement between two or more developed countries may seek further liberalization that goes beyond tariff reduction. We would expect then that North–North PTAs are relatively deep. Also North–South PTAs are expected to be relatively deep but for different reasons, as advanced economies may grant market access to developing economies in exchange for increased protection of investment and property rights. Agreements between developing countries still focus instead on tariff liberalization and are less deep.
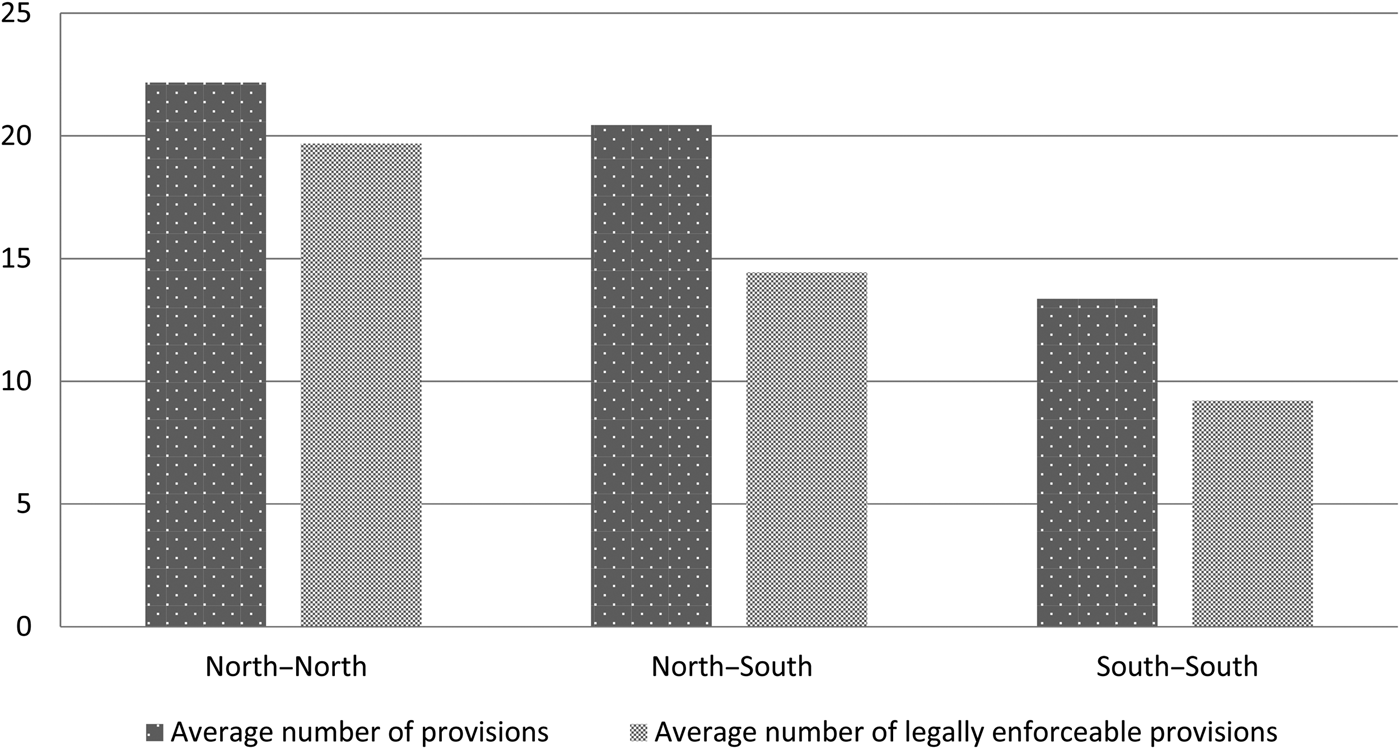
Agreements signed between developed countries tend to be deeper than agreements signed between developed and developing countries and agreements between developing countries only. Similar to the findings in Kohl et al. (Reference Kohl, Brakman and Garretsen2016), when looking at the number of provisions included in PTAs, North–North agreements are the deepest with around 22 provisions (see Figure 8). North–South PTAs include on average almost 20 provisions, while PTAs among developing countries contain only 13 provisions on average. When taking into consideration legal enforceability, North–North agreements are still the deepest with almost 20 legally enforceable provisions on average. North–South PTAs have less than 15 legally enforceable areas and South–South PTAs have only nine.
Areas covered vs. legal enforceability by development level

North–North PTAs are the deepest also when dividing provisions into WTO+ and WTO-X. The ranking of PTAs according to the number of legally enforceable provisions is identical for WTO+ and WTO-X provisions. However, interestingly, North–South PTAs include almost the same number of WTO-X provisions as North–North PTAs but legal enforceability is weaker.
4.2 Trade and deep PTAs
The share of trade under PTAs increased constantly over the last quarter century. In 1996, only 24% of world trade was done under PTAs. This share increased up to 37% in 2013. Despite the high number of PTAs in force, the share of trade under PTAs is less than half. This is mainly due to the fact that the biggest traders in the world, namely the US, China, the EU, and Japan, do not have signed PTAs with each other yet. In this subsection, we take a first look at the relationship between trade and the scope of trade agreements.
Deep trade agreements that cover a larger number of policy areas tend to increase trade more than shallow trade agreements. Dür et al. (Reference Dür, Baccini and Elsig2014) and Kohl et al. (Reference Kohl, Brakman and Garretsen2016) explore econometrically this link. Their results suggest that country pairs that signed deeper PTAs have higher levels of bilateral trade. Similarly, Mattoo et al. (Reference Mattoo, Mulabdic and Ruta2017) use a gravity framework to evaluate the impact of deep agreements on trade flows, confirming the role of depth in promoting trade among PTA partners. They also find that deep agreements divert trade less than shallow agreements as MFN provisions tend to increase trade with non-members.
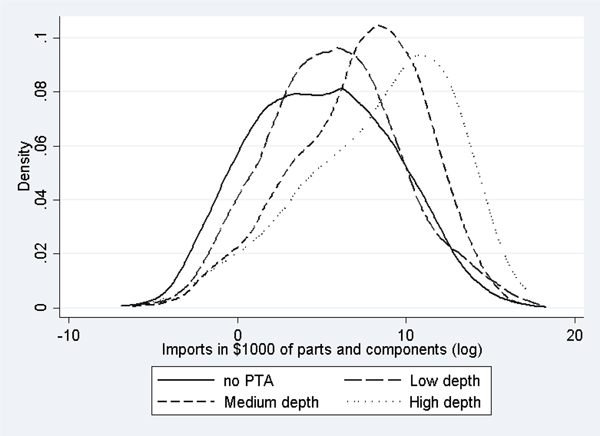
The deepening of trade agreements is also related to another recent phenomenon in the global economy: the internationalization of production. The increase in average depth of PTAs over time goes together with the increase in trade of parts and components in the world. Country pairs involved in deeper agreements tend to have higher levels of trade in parts and components than country pairs that signed PTAs with fewer provisions. As for total trade, the distribution of imports of parts and components between countries with deeper PTAs lies to the right of the distribution of shallower PTAs. This indicates that deeper agreements are associated with more trade in parts and components. Osnago et al. (Reference Osnago, Rocha and Ruta2018a) explore this relationship in a gravity framework. They show that signing deeper agreements increases GVC-related trade measured as trade in parts and components or using trade in value added flows (see Figure 9).Footnote 27
Distribution of imports of parts and components over levels of depth

5. Conclusion
The topic of PTAs has gained momentum over the last decades as much of the trade policy action takes place at the regional level. The primary goal of this paper is to provide detailed information on the content of preferential trade agreements in a large number of policy areas as a first and indispensable step to develop systematic evidence of their rationale and impact on trade and other relevant economic variables. The information contained in the new database presented here also helps government officials, trade scholars, and market participants to better understand the type of commitments undertaken in these agreements, as well as to get an indication on their legal enforceability. This paper finally presents a preliminary analysis of the new data, offering some novel stylized facts. Specifically, we find that preferential arrangements are deepening especially in areas that are already covered by the WTO and in core WTO extra areas; that the depth and content of PTAs vary by region and by income level of participants; and that the depth of PTAs correlates with goods trade and GVC intensity of members.
In this final section, we want to stress three limitations of the current approach as a caveat to users and an indication for future research in this field. First, the data reveal the policy areas covered in PTAs and whether they are legally enforceable or not. The analysis, however, does not look at the stringency of specific provisions in one agreement relative to others. For instance, the database cannot uncover whether commitments on investment in one PTA go farther than in another. The latter would imply an investigation and comparison of the specific content that selected provisions contain. As discussed in Section 2, some of this work has been already undertaken by others (e.g. Acharya, Reference Acharya2016; Dür et al., Reference Dür, Baccini and Elsig2014). More analysis will certainly follow.
Secondly, the study does not intend to draw any conclusions with regard to actual policies and the implementation of PTAs. In some cases, deep commitments in trade agreements may just codify an already existing policy reality. In this case, the impact of a trade agreement is just to limit the use of discretionary policy in the future, but does not change the actual policies in the present. In other cases, deep commitments may impose constraints on actual policies, but with the present information we cannot draw any conclusions on the final enforcement of PTAs. Some provisions may be legally enforceable, but they might not be applied in practice. For instance, a provision prescribing the change of national laws on investment or competition policies might seem strong on paper, but in practice a country might still not change its domestic laws. On the contrary, provisions that have weaker language may lead the way to stronger legal language and enforceability in the future.
Finally, we need to acknowledge existing gaps in the coverage of our database. First, we have no information on trade agreements that were in force at some point in the past but are no longer in force in 2015. Not surprisingly, this lack of information is more pronounced as we move back in time so that our data for the 2000s tends to be more complete relative to earlier decades. Second, we have no information on trade agreements that are in force but have not been notified to the WTO. This could either be because signatories are not members of the WTO or just result from a failure to abide with the WTO notification requirements. WTO (2011) estimated that around 100 PTAs in force were not notified to the WTO and that these mostly involved agreements among developing countries. Both data limitations have implications for empirical analyses based on this database and should be kept in mind by researchers.
Appendix A
List of agreements