Introduction
Life expectancy indicates the average number of years a person is expected to live if mortality conditions at the time of birth are not modified. This variable can, therefore, be used as an indirect measure of health conditions in a particular region; an example of such usage is the Human Development Index (HDI) of the United Nations Development Program (UNDP). As opposed to other indicators related to mortality, such as number of deaths or mortality rates, life expectancy does not depend on the size or on the age composition of the study population, allowing values to be compared over time and among regions.
In this article, the evolution of life expectancy at birth in the 32 federal entities of Mexico between 1990 and 2006 is studied by adapting the methodology of Barro & Sala-i-Martin (Reference Barro and Sala-i-Martin1995) for the regional analysis of economic convergence. The dynamics of life expectancy for Mexico's total population and its relationship with those of other countries are also considered. The aim of the paper is to present a comprehensive explanation of the country's internal issues; at national level these issues shape a dynamic which, in recent years, has tended to widen the existing gap with regards to countries with higher life expectancy series.
In order to analyse the comparative evolution of life expectancy in Mexican federal entities and to propose a coherent explanation within the international framework, the paper begins by describing the evolution of life expectancy in Mexico during the last century, situating it within the international context. Secondly, a methodology that allows the study of the comparative dynamics of different life expectancy series is presented. Thirdly, the main results obtained when this methodology is applied to the case of Mexican federal entities are described. Fourthly, an explanation is proposed for these results, taking into account the main evidence and the diverse existing theories. The article finishes with the most relevant conclusions of the analysis.
Previous evidence: the evolution of life expectancy in Mexico
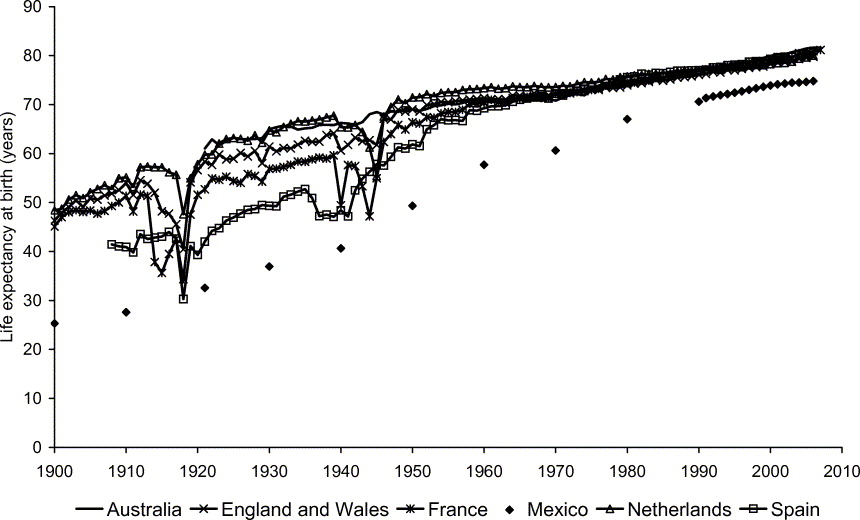
Figure 1 illustrates the evolution of life expectancy in Mexico from 1900 to the present day. As shown, the variable tripled its value from the beginning to the end of the 20th century. Nevertheless, it is worth noticing that this growth was not regular. Throughout the first decades, there was a slow increase in life expectancy, which was interrupted during the revolutionary period (1910–1917). In the mid-century, growth accelerated, especially during the 1940s and 1950s. Between 1940 and 1960, a period described by Camposortega (Reference Camposortega1992, p. 384) as one of ‘extraordinary reduction’ in mortality rates, life expectancy in Mexico increased at a rate of almost one year per calendar year. According to estimations by Benítez & Cabrera (Reference Benítez and Cabrera1967), female life expectancy increased from 42.50 in 1940 to 60.32 in 1960. For Arriaga (Reference Arriaga1968) the change was from 39.84 to 59.58 years, whilst for Corona et al. (Reference Corona, Jiménez and Minujín1982) it rose from 41.46 to 60.14. According to reviewed estimations by Camposortega (Reference Camposortega1992), female survival capacity went from 41.65 to 59.73 years, whilst for INEGI (2007) it grew from 39.80 to 59.40 years. For men the growth was from 39.53 years to 56.10 years (Partida, Reference Partida2008, p. 68), or from 39.12 years to 55.99, according to Camposortega (Reference Camposortega1992). After this period the growth rate began to slow down again. Between 1960 and 1980, survival expectancy for women rose by only 10 years, and for men, 8 years, half that of the previous period. In the following two decades until the new millennium, the increase of life expectancy decelerated even more. In 2000, the female series reached 76.47 years whilst male life expectancy stood at 71.30 years, representing 6.43 and 7.30 years, respectively, above 1980 values. From 2000 to 2006, life expectancy of the total population only increased by 0.92 years, six times slower than in the 1940s and 1950s.
Evolution of life expectancy for the total population of different countries. Source: own work from Arriaga (Reference Arriaga1968), Partida (Reference Partida2008) and CONAPO (2009) for Mexico, and HMD (2009) otherwise.
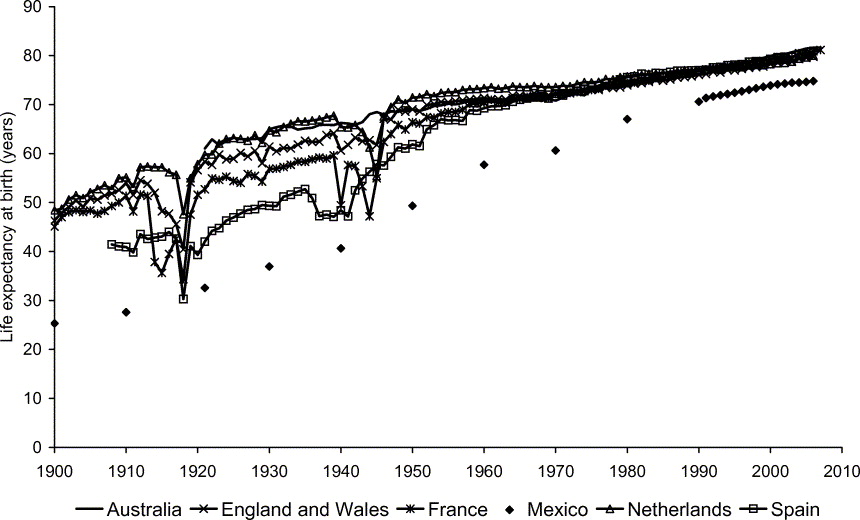
Setting the Mexican series in the international context (Guijarro & Peláez, Reference Guijarro and Peláez2008, Reference Guijarro and Peláez2009), this rapid mid-century growth and its later deceleration can be explained by the initially accumulated delay (Fig. 1). By the time Mexico abandoned the old demographic regime, populations which had started demographic transition a century before had an enormous advantage over other populations. This gap was ‘extraordinarily’ shortened due to the development of institutions that had proved successful in other countries. This favoured the creation of health and literacy programmes which helped to enhance nutrition levels, such as agricultural reforms, infrastructure building and the implementation of irrigation technology (Camposortega, Reference Camposortega1992, p. 384). Insecticides, vaccines and other medicines began to be available in Mexico, helping reduce the incidence of infectious diseases. This allowed the rapid increase in life expectancy during the 1940s and 1950s.
The slowdown in the following decades reflects the progressive exhaustion of improvement margins. In 1930, the distance between Mexico and New Zealand, world leader in terms of life expectancy, was 29 years. That is, New Zealand's population lived almost twice as long as Mexico's population. In 1940 this gap had been reduced to 27 years. Two decades later, due to intensive improvement in national life expectancy at a rate of almost one year per calendar year, Mexico's distance from the new leader, Iceland, had been reduced to 16 years. Later, despite the strong deceleration in the improvement rate, Mexico's distance from leading nations continued to reduce. Nevertheless, this took place at a slower pace, since the improvement margins and, consequently, the incorporation of innovations, were fewer each time.
In 1970, Mexico's 60.6 year life expectancy rate was 14.1 years less than the 74.7 year rate in Sweden. A decade later, this difference had reduced to 9.6 years, 8.4 in 1990, and 7.3 in 1995, reaching the closest point to the leading positions since the start of the demographic transition. Following this year, rather than maintaining this tendency, which Wilson (Reference Wilson2001) and Bongaarts (Reference Bongaarts2006) notice in most populations, a phase of progressive distancing from advanced countries begins. Life expectancy in Mexico only grew by 2.4 years between 1995 and 2006, whilst in the lead country, Japan, life expectancy grew by 2.9 years in the same period. Therefore, the distance between both series widens to 7.5 years in 2000 and to 7.9 in 2006.
At first, it may seem that the poor performance of the Mexican economy in recent years – when gross domestic product (GDP) per capita, after increasing at an annual accumulative rate of 2.3% between 1995 and 2005, but only 0.9% from 2000 to 2005 – could be a decisive factor in explaining such a slow improvement in life expectancy. Nevertheless, as explained later, analysis of the regional dynamics of life expectancy allows drawing some different conclusions about the causes of the intense decline in the national series. In order to do this, the methodology used in the comparative analysis of Mexican life expectancy series is described in the next section.
Methodology for the analysis of life expectancy series
The Mexican National Population Council (CONAPO) publishes on its website the life expectancy series observed annually since 1990 in each one of the Mexican Republic's federal entities. In order to study the series' performance between 1990 and 2006, the methodology described by Barro & Sala-i-Martin (Reference Barro and Sala-i-Martin1995) is used. This will allow confirmation of whether life expectancy has grown more in entities with the lowest values at the beginning of the period of analysis (β-convergence) and, also, if the dispersion in life expectancy levels for the whole set of studied populations has reduced (σ-convergence). In this way, it will be possible to determine if the stagnation of the national series and its distancing from the world leaders is due to:
• Bad performance of the country's poorer entities, which would produce a bigger gap between these and the more advanced federal entities, resulting in β- and σ-divergence;
• Slow growth of the better positioned federal entities, allowing lesser developed ones to move closer, creating β- and σ-convergence;
• Slow evolution of all federal entities in general, in which case there would be little or no evidence of β- or σ-convergence or divergence.
In order to confirm β-convergence among life expectancy series of Mexican federal entities during the period 1990–2006, the following linear model is proposed:

in which  is the absolute variation of life expectancy in the federal entity number i between 1990 and 2006; α and β are the model parameters; and ε i is the error term. Given this expression, a negative and statistical significant value of the β-coefficient estimator indicates an inverse relationship between initial life expectancy values, ei ,1990, and the variation of the variable during the considered period, Δei ,2006. In this case, life expectancy would have increased in those entities with the lowest values in 1990 (β-convergence).
On the other hand, for a group of populations at a certain time, σ-convergence can be considered if dispersion in life expectancy is reduced along time, that is, if σ 2006<σ1990, or, in other words, if the standard deviation for the year 2006 is smaller than the standard deviation for 1990.
The convergence analysis is complemented with the cumulative square root frequency stratification technique proposed by Dalenius & Hodges (Reference Dalenius and Hodges1957, Reference Dalenius and Hodges1959). This methodology enables the separation of the different federal entities according to the values presented for each variable, and to establish homogeneous clusters that can make the description of their relative position easier.
Empirical findings
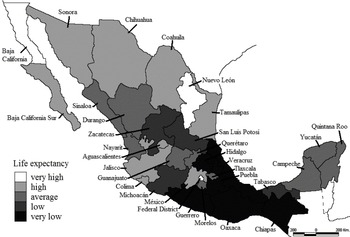
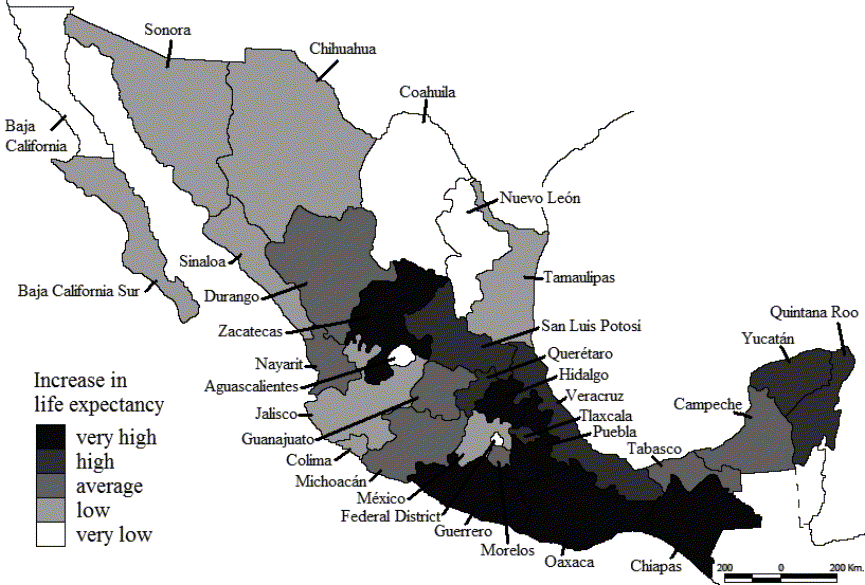
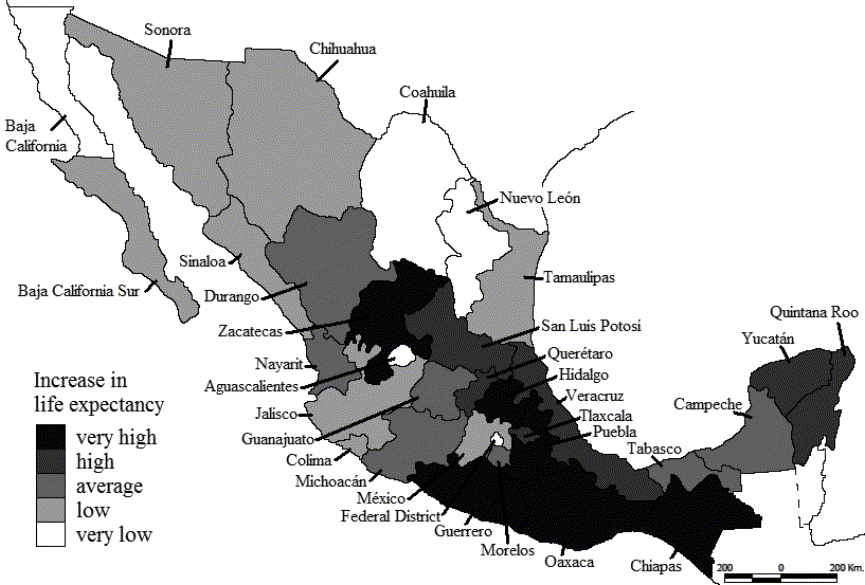
Applying the convergence analysis described in the previous section to the data series published by CONAPO, a clear convergence process in life expectancy in different federal entities of Mexico between the 1990 and 2006 is found. As shown in Figs 2 and 3, those entities in the south of the country with the lowest levels of life expectancy in 1990 experienced greater improvements in following years. Chiapas, for example, with a life expectancy of 66.36 years in 1990, Oaxaca (66.63) and Guerrero (67.29) experienced an improvement of 7.33, 7.28 and 5.83 years, respectively, from 1990 to 2006. At the same time, those entities with the highest life expectancy values in 1990 – the Federal District (73.73), Baja California (73.15) and Nuevo León (72.69) – only saw improvements of 2.07, 2.57 and 2.47 years, respectively.
Stratification of Mexican federal entities according to their life expectancy in 1990. Source: own work from CONAPO (2009), applying the technique proposed by Dalenius & Hodges (Reference Dalenius and Hodges1957, Reference Dalenius and Hodges1959).

Stratification of Mexican federal entities according to their increase in life expectancy between 1990 and 2006. Source: own work from CONAPO (2009), applying the technique proposed by Dalenius & Hodges (Reference Dalenius and Hodges1957, Reference Dalenius and Hodges1959).
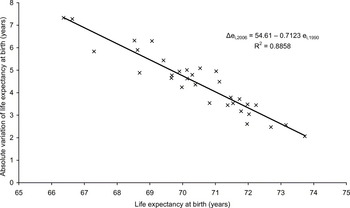
The resulting equation from the regression of life expectancy variation between 1990 and 2006 against the observed values in 1990 (Fig. 4) shows a negative and statistically significant β-coefficient estimator, indicating a tendency for Mexican federal entities to increase by an additional 0.71 years for each year separating it from the entity with the highest life expectancy at the beginning of the period, in this case the Federal District. Also, the dispersion of life expectancy among federal entities, measured by the standard deviation, has progressively reduced throughout the course of the studied period, leading to a σ-convergence situation. The standard deviation of life expectancy for Mexican federal entities, which in 1990 reached 1.74, reduced to 0.67 in sixteen years. The poor performance of the better positioned states in 1990, combined with the strong recovery of those presenting worst conditions at the beginning of the period, reduced the gap between them, resulting in strong internal convergence in the country.
Relationship between life expectancy levels in 1990 and the absolute variation registered from 1990 to 2006 in the 32 Mexican federal entities (β-convergence). Source: own work from CONAPO (2009).

In general, life expectancy growth rate has tended to decrease for Mexican federal entities. However, those entities with initially higher values have experienced much greater reduction, leading to a convergence process. If in 1990 the difference between the maximum, the Federal District, and the minimum, Chiapas, was 7.36 years, in 2006 the distance between them had reduced to 2.10 years. At this time, the difference between the new maximum, Quintana Roo, and the new minimum, Guerrero, was only 2.85 years. The limited growth in life expectancy in regions with initially higher values, such as the Federal District or Baja California, where life expectancy grew by only 2.07 and 2.57 years, respectively in the years between 1990 and 2006, explains the internal convergence. It also explains the increasing gap between Mexico's national series and that of other countries, because, during the same period, life expectancy in other more advanced societies had increase considerably. Such is the case in Japan, where life expectancy rose by 3.63 years, and Switzerland (4.31), Italy (4.53) and Iceland (3.14); by 2006 all these countries had a life expectancy of over 81 years. Given this, how can the poor performance of those Mexican federal entities that started out with a strong advantage be explained?
The search for an explanation
Whilst describing the evolution of Mexico's national life expectancy series, it can be seen that the recent deceleration of its growth rate coincided with a period of limited economic expansion: the GDP per capita of Mexico grew at an annual accumulated rate of only 0.9% between 2000 and 2005. Because of the relationship between the economic conditions of a population and its survivability, the convergence of life expectancy for Mexico federal entities could be due to the existence of an economic convergence process. A reduction of the distance of the poorest entities, with the lowest life expectancy values, from the richest ones, would explain the processes described in the former section. However, having studied other authors' work on this issue, it is difficult to accept that poorer federal entities have benefited more from the North American Free Trade Agreement (NAFTA) or from other economic changes since 1990 than richer ones. Esquivel (Reference Esquivel2000, p. 18–19), for example, argues that from 1960 there is no evidence of economic convergence in Mexico and, if any, it is weak and slow. Similarly, Messmacher (Reference Messmacher2000, p. 22) concludes that ‘state level GDP per capita convergence has been very limited during the last 30 years’. For Silva (Reference Silva2003, p. 16), there is no evidence of state-level economic convergence or divergence during the period 1993–1999.
The convergence analysis for life expectancy can readjust to the study of GDP per capita. Given that the variable is expressed in logarithms, the model for determining β-convergence is:

where Δlni,2006/(2006–1993) is a proxy for the average accumulated variation rate of the GDP per capita of a federal entity i between 1993 and 2006:

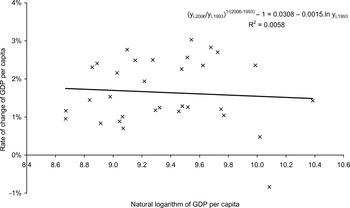
Similarly, the standard deviation of GDP per capita in natural logarithms is used to study σ-convergence. Thus, adapting the convergence analysis to the GDP data provided by INEGI (2009a) and the CONAPO (2009) population figures, no evidence of convergence or divergence in GDP per capita at a state level in Mexico during the period 1993–2006 is found.
As shown in Fig. 5, federal entities with the highest GDP per capita had similar growth rates to those with lower income levels: there was no β-convergence during the study period. Similarly, there was no variation in data dispersion. The GDP per capita standard deviation expressed in logarithms remained constant from 1993 (σ1993=0.4227) until 2006 (σ2006=0.4281): there was no σ-convergence.

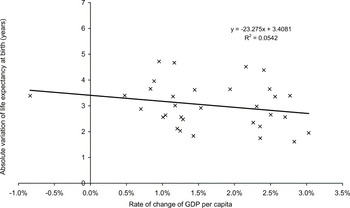
Similarly, it is clear that the variation rates of GDP per capita do not explain the increase in life expectancy values in the different states during the period 1993–2006 (Fig. 6). Even though it is shown that initial income levels (expressed in logarithms) did maintain a certain relationship with life expectancy values in 1993, as shown by the determination coefficient R 2=0.6259, this relationship loses strength with time (R 2=0.3633 in 2006), given a low explanatory power of economic dynamics over life expectancy during the study period (R 2=0.0542).

Given these results, economic situation does not seem to provide an explanation for the slowdown in life expectancy growth rates of the better positioned federal entities in 1990 and, therefore, for the increased distance between the national Mexican series and that of other more advanced societies. It is, therefore, necessary to search for an alternative cause.
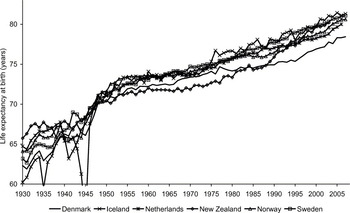
Peláez (Reference Peláez2009) proposes an endogenous explanation for the model of behaviour of life expectancy. An analysis of the Mexican population suggests that the strong deceleration in national life expectancy in recent years could be explained by evolution to the third to fourth stage of the ‘epidemiological transition’ (Omran, Reference Omran1971; Olshansky & Ault, Reference Olshansky and Ault1986). Experience from other populations shows that the shift from ‘the age of degenerative and man-made diseases’ (Omran, Reference Omran1971) to ‘the age of delayed degenerative diseases’ (Olshansky & Ault, Reference Olshansky and Ault1986) is not usually immediate. Once mortality caused by infectious and parasitic diseases is reduced, the reallocation of resources to the diagnosis and treatment of chronic and degenerative illnesses, amongst the main causes of deaths, requires time. Therefore, growth in life expectancy temporarily slows down. This occurred in Norway, for example, where it took 17 years, from 1953 to 1970, for life expectancy to increase from 73 to 74 years; and in the Netherlands, which made this same change from 1958 to 1973; and in Denmark, where it was necessary to wait from 1968 to 1990 for life expectancy to improve from 73 to 75 years. Other countries, such as Iceland, New Zealand and Sweden (Fig. 7), also suffered important slowdowns after reaching these levels, where, in order to continue reducing mortality rates, it was necessary to reallocate health resources towards the prevention and cure of chronic and degenerative illnesses.
Evolution of life expectancy in different countries (1930–2007). Source: own work from HMD (2009).

In Mexico, those states with lower life expectancy in 1990, such as Chiapas (66.36), Oaxaca (66.63) and Guerrero (67.29), which still had a high incidence of infectious and parasitic diseases, continued to reduce mortality caused by these type of illnesses and experienced the highest increases in life expectancy during the study period. In Chiapas, the percentage of deaths due to ‘infectious intestinal diseases’, ‘other bacterial diseases’, ‘viral diseases’ and ‘other infectious and parasitic diseases and effects of infectious and parasitic diseases’ (INEGI, 2009b) decreased from 23.86% to 6.16% between 1990 and 2006. In Oaxaca and Guerrero, the proportion of deaths caused by these illnesses acted in a similar way, going from 19.77% to 4.02% and from 11.65% to 3.94%, respectively, during the same period. All these reductions helped the improvement of life expectancy by 7.33 years in Chiapas, 7.28 in Oaxaca and 5.83 in Guerrero, from 1990 to 2006. In contrast, those entities with the highest life expectancy rates at the beginning of the period, and which had already exhausted their improvement margins through the reduction of infectious and parasitic diseases, registered considerably slower growth rates. In the Federal District, the percentage of deaths caused by infectious and parasitic diseases hardly changed from 3.74% in 1990 to 3.02% in 2006, and life expectancy grew by only 2.07 years from the figure of 73.73 years registered in 2006. Similar dynamics also occurred in other entities such as Baja California and Nuevo León, which were the second and third entities with the highest level of life expectancy at the beginning of the nineties and whose percentages of deaths caused by infectious and parasitic diseases were even lower than those reached by the entities in the south of the country. In all the cases the already low levels of mortality due to these illnesses barely decreased, leading to a smaller growth in life expectancy.
Once an entity has reached the level at which it becomes necessary to reorient health services towards the diagnosis and treatment of degenerative illnesses, and considering this is not an immediate process, its life expectancy tends to stagnate, at least temporarily. For example, Baja California and the Federal District, which in 1990 already had a life expectancy of more than 73 years, did not reach 75 years until 2001 and 2002, respectively. The next entity to reach 73 years, Nuevo León in 1991, did not reach 75 years until 2006. Later, Baja California Sur and Aguascalientes, which passed 73 years in 1993, took until 2004 and 2006, respectively, to reach 75 years. On the other hand, those entities with lower survival levels have been able to continue battling against mortality caused by infectious and parasitic diseases, therefore improving life expectancy. The limited progress in more advanced federal entities, together with continued improvement of those that had fallen behind, explains the intense convergence process observed within the country. The national series was also affected by the slowdown in life expectancy growth of a large number of federal entities, decelerating its expansion and interrupting the Mexican convergence process with regards other more advanced countries. Experience from other countries suggests this process will resume once the different federal entities shift from the third to the fourth stage of epidemiological transition. The speed at which this takes place will largely depend on the measures taken to reduce mortality amongst the elderly population – those mainly affected by chronic and degenerative illnesses.
Conclusions
This paper analyses the evolution of life expectancy in different federal entities of Mexico in an attempt to understand the internal dynamics and reasons behind the break in the convergence process between Mexico's national series and that of other developed countries, which had marked the tendency during the previous century. The results show that, internally, between 1990 and 2006, there had been a process of intense convergence among life expectancy of different Mexican federal entities due to limited life expectancy growth in more advanced regions. This also explains the divergence of Mexico's national series with respect to levels reached in other more developed countries.
Having analysed the dynamics of life expectancy in each federal entity and in the country as a whole, the reason why the states with the highest survival standards in 1990 showed few improvements in life expectancy during the following years is explained. Initially, it appeared that economic factors played an important role in explaining these dynamics. However, it was shown that the economic performance of federal entities during the study period was not strongly related to the evolution of life expectancy. No evidence was found of economic convergence among federal entities or a possible relationship between GDP per capita growth rates and the observed increases in life expectancy. Given these results, another non-exogenous explanation is proposed, using historical dynamics analysis of the life expectancy series. Considering other populations' experience, the conclusion is that the strong deceleration in life expectancy in the better positioned entities could be caused by their shift from the third to the fourth stage of the epidemiological transition; this movement normally requires an adaptation period in which mortality reduction slows down. Once the more advanced entities' life expectancy reached values at which the shift takes place, they experienced an important deceleration in their growth, whilst life expectancy in lesser developed entities, which continued to fight infectious and parasitic diseases, grew at a good pace, resulting in convergence. A shift from the third to the fourth stage of the epidemiological transition would, therefore, explain the internal convergence among Mexican federal entities as well as Mexico's external divergence with respect to other more developed societies.
Acknowledgments
The authors would like to express their gratitude to Naomi Patterson for her translation assistance, and to Jorge A. López-Arévalo for his contributions to a preliminary version of this article presented at the First International Congress: Social Sciences in the 21st Century: The Regional Studies' Perspective, which took place from 23rd to 25th September 2009, at the Social Sciences Faculty of the Universidad Autónoma de Chiapas (UNACH) in San Cristóbal de Las Casas, Chiapas, Mexico.