

A growing body of work on candidate traits shows that people with a given social characteristic tend to prefer candidates or leaders who share that characteristic (Campbell and Cowley Reference Campbell and Cowley2014; Cutler Reference Cutler2002). However, the existing evidence for whether women vote for women is mixed. For example, Kathleen Dolan found that candidate sex was a driver of voting behavior for the U.S. House of Representatives in 1992, but not in 1994 or 1996 (Dolan Reference Dolan1998, Reference Dolan2001, Reference Dolan2004). Eric Smith and Richard Fox used pooled U.S. data from 1988 to 1992 and found that well-educated women were more inclined to support women candidates in House but not Senate races (Smith and Fox Reference Smith and Fox2001), and others have found that women are more likely to vote for women candidates only when they are perceived as being pro-feminist (Plutzer and Zipp Reference Plutzer and Zipp1996). By contrast Fulton (Reference Fulton2014) found that women are not more likely to vote for women candidates in the United States, but that male Independents are somewhat less likely to vote for them. Others have found little evidence whatsoever of an association between candidate gender and vote choice (McElroy and Marsh Reference McElroy and Marsh2010).
These findings suggest that the link—if any—between candidate sex and voting behavior is not straightforward and is also highly context specific. It is not clear from previous research why candidate sex should matter in some elections but not others, and why women may differ in their support for women candidates. Moreover, previous research has largely been limited to the United States. In this article we build on this emerging literature by examining the impact of candidate sex in the British context. We do so with reference to key theories about political representation (Pitkin Reference Pitkin1967).
Hannah Pitkin famously described a four-part typology of political representation comprising of formal, descriptive, substantive, and symbolic representation. Feminist research has largely focused on two components of Pitkin's typology: descriptive and substantive representation. Descriptive representation occurs where the representative stands for a group by virtue of sharing similar characteristics, and substantive representation occurs where the representative seeks to advance a group's policy preferences. If descriptive representation is important to voters, then, given the underrepresentation of women in the British parliament (where just 22% of MPs elected in 2010 were women), we might expect women in the electorate to demand more women MPs. Equally we might expect women to demand better descriptive representation (by supporting an increase in the number of women in the legislature) because they believe that women MPs will deliver substantive representation (by promoting women's issues, preferences, and interests). Alternatively, women may have a preference for the greater descriptive representation of women simply from the position of fairness—as 52% of the adult population are women—women may believe any lesser figure in the legislature is simply not just (Phillips Reference Phillips1995). In fact, previous research has shown that women in Britain would like to see more women MPs in the House of Commons, although they are not concerned about the sex of their own MP (Cowley Reference Cowley2013). However, it is unlikely that all women would share the desire for more women parliamentarians, and many may be indifferent to the proportion of women in the legislature. Whereas some women may be very much in favor of having more women in politics, others may not place such a high value on increasing women's representation. We would therefore not expect women who are unconcerned about the descriptive representation of women to trade off voting for their preferred party on the basis of candidate sex. But do women who hold strong feminist views about the importance of getting more women into politics (descriptive representation) put these views in to practice when they have the chance by voting for women candidates?
We suggest that the 2010 British election provides a particularly instructive case to test our hypotheses since (1) the availability of women candidates, in a range of constituencies, was much higher than in previous years, and (2) the issue of women's political representation was also more salient than in previous elections, largely as a result of the intraparty debate about all women shortlists—a debate that was present to a greater or less extent in all three major parties. This combination of both supply and salience provides the most likely contemporary context for candidate sex effects to matter in Britain. It also provides us with an opportunity to link political discourse about descriptive representation at the party level to public attitudes toward descriptive representation and to investigate the impact on voting behavior.
CANDIDATE SEX AND VOTING BEHAVIOR
Over the last few years a growing body of research has examined the impact of candidate sex on voters and has addressed the question of whether women are more likely (and men less likely) to support women candidates—and if so, why. The most straightforward possibility relates to identity politics, where voters have a baseline preference for candidates of their own sex (Sanbonmatsu Reference Sanbonmatsu2002). As Johnston et al. (Reference Johnston, Blais, Brady and Crête1992) argue, “the more an agent resembles oneself the more he or she might be expected reflexively to understand and act on one's own interests.” This can provide a powerful motivation to vote for candidates or leaders who embody our own demographic characteristics. Evidence to support this contention has been found in other contexts, specifically with respect to ethnicity—in the United States (Sigelman et al. Reference Sigelman, Sigelman, Walkosz and Nitz1995; Tate Reference Tate1993; Terkildsen Reference Terkildsen1992), Europe (Bergh and Bjørklund Reference Bergh and Bjørklund2011; Teney et al. Reference Teney, Jacobs, Rea and Delwit2010), and India (Heath, Verniers, and Kumar Reference Heath, Verniers and Kumar2015)—but evidence with respect to gender has been far more mixed, and candidate sex has been found to influence voting behavior in some elections but not others (Dolan Reference Dolan1998, Reference Dolan2001, Reference Dolan2004; Dolan and Lynch Reference Dolan and Lynch2014).
In addition to the possibility of a straightforward identity politics effect, where voters prefer candidates of their own sex, the literature suggests preference for, or hostility to, women candidates might be influenced by the perceived feminism of the candidate. In their analysis of exit polls from the 1992 elections, Eric Plutzer and John Zipp found evidence to suggest that a simple pattern of identity politics, whereby women vote for women is not a sufficient explanation for who votes for women candidates (Plutzer and Zipp Reference Plutzer and Zipp1996). According to their evidence, it would seem that in a number of cases women are indeed more likely to vote for women, but this effect is most pronounced when the woman candidate is perceived as being profeminist. When candidates are perceived as “acting for,” rather than merely “standing for,” women, they stimulate voting based on gender identity (34).
This line of work has been developed in a number of different directions to examine the character traits and perceptions of male and female candidates. Recent research suggests that voters tend to assess men and women candidates differently by using stereotypes about their perceived strengths and weaknesses (Cutler Reference Cutler2002; Huddy and Terkildsen Reference Huddy and Terkildsen1993a; McDermott Reference McDermott1997, Reference McDermott1998; Schwindt-Bayer, Crisp, and Malecki Reference Schwindt-Bayer, Crisp and Malecki2008). Gender stereotypes portray women as approachable and empathetic and men as assertive leaders (Alexander and Andersen Reference Alexander and Andersen1993; Burrell Reference Burrell2008; Huddy and Terkildsen Reference Huddy and Terkildsen1993b; Kahn Reference Kahn1996; King and Matland Reference King and Matland2003; Lawless Reference Lawless2004; Leeper Reference Leeper1991; Paul and Smith Reference Paul and Smith2008; Sapiro Reference Sapiro1981/1982). Voters tend to use these gender stereotypes to assess men and women candidates’ policy competencies differently, with women seen as more competent on matters of health and education and men seen as more competent on matters of the economy and terrorism (Dolan Reference Dolan2010). Perhaps as a result of gender stereotypes equating women with higher levels of compassion and empathy, studies have found that women candidates are perceived as more liberal than men running for election (Koch Reference Koch2000, Reference Koch2002; McDermott Reference McDermott1997), and voters who are worried about levels of honesty and integrity in government have been more likely to vote for women candidates (Dolan Reference Dolan2004; McDermott Reference McDermott1998). Although women candidates often believe they have to be better than men to succeed (Lawless and Fox Reference Lawless and Fox2010), this is a misperception, and as candidates become known to voters, gender stereotypes play far less of a role. Recent evidence suggests that gender stereotypes in candidate evaluations have no effect on vote choice (Brooks Reference Brooks2013; Dolan Reference Dolan2014a, Reference Dolan2014b; Dolan and Lynch Reference Dolan and Lynch2014).
Studies in the United States have also tended to find stronger patterns of candidate gender voting among independents, who do not have such strong partisan ties and so may be more influenced by candidate traits (e.g., Fulton Reference Fulton2014). Other studies have found that candidate gender voting is shaped by partisan affiliation and that people are less likely to vote for Republican women candidates than Democrats (King and Matland Reference King and Matland2003; Lawless and Person Reference Lawless and Person2008). Dolan (Reference Dolan2004) suggests that this is because issue and trait stereotypes of women and of Democrats are generally consistent with each other, while stereotypes of women and of Republicans are more at odds with each other.
One area that has received less attention, though, is public opinion toward the question of women's representation in elected office (Dolan Reference Dolan2010, 70). Previous work in this area has examined public attitudes toward descriptive representation (Campbell, Childs and Lovenduski Reference Campbell, Childs and Lovenduski2010) and how these attitudes shape evaluations of women candidates (Dolan Reference Dolan2010; Rosenthal Reference Rosenthal1995), but as yet there has been little scholarly work on how these attitudes directly influence actual behavior. In this article we contribute to this emerging literature by examining whether public attitudes toward the descriptive representation of women condition the extent to which candidate sex influences voting behavior. We expect voters who support increasing the descriptive representation of women to be more likely to vote for women candidates than those who do not, but we expect the effect to be more pronounced among women than men—as the issue is likely to be more salient to women.
GENDER AND THE 2010 BRITISH GENERAL ELECTION
In order to test our research question, we focus on the 2010 British election. As set out above, previous research has found that the extent to which gender is politically salient depends upon the political context. For example, Dolan (2014, 24) argues that the role candidate gender plays in voter calculations varies with the electoral context and is more important in some contests than others. She found that women were more likely to vote for women candidates in 1992 than in other election years because of the high salience of gender in the 1992 election, which was commonly referred to as the “year of the woman” (Dolan Reference Dolan2001, Reference Dolan2004). Plutzer and Zipp also single out 1992 because of the salience of gender in the election and thus thought that should women ever vote for women, they would certainly do so in this year.
Although it is hard to think of a similar example where gender has played such a significant role in election reporting in the British case, 2010 provides us with the best opportunity in recent times to do so. Since 1997 the Labour Party easily has been the most feminist-oriented political party in Britain, but after his election as Conservative leader in 2005, David Cameron sought to challenge the Labour Party on this terrain. Cameron made improving the representation of women in parliament a significant part of his bid to “modernize” or decontaminate the Conservative brand. He needed to shake off the “nasty party” image, and embracing gender equality, along with environmentalism and other liberal values, was part of the strategy (Childs and Webb Reference Childs and Webb2012). In his first speech as party leader Cameron stressed the importance of improving the representation of women in politics and talked about work-life balance as one of the most pressing issues facing contemporary British families. His controversial A-list policy—which required that women make up 50% of candidates on the party's preferred candidate list—was substantially watered down in response to a backlash from party members. However these internal divisions kept the issue on the media's agenda.
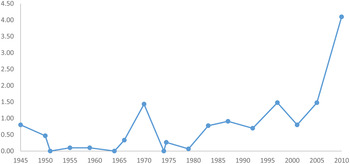
In addition to controversies over the selection of women candidates, the issue of women voters, or, more specifically, mothers’ voting preferences, became a highly salient feature of the media coverage of the election. In the long campaign all three party leaders participated in web chats on the mumsnetFootnote 1 website at their own request, and the news frame “the mumsnet election” was directly referred to in 43 national newspaper articles.Footnote 2 In fact Labour's election campaign coordinator, Douglas Alexander, was on record saying, “Labour needs to win back middle-income female voters with children in marginal seats.”Footnote 3 Each of the three main parties devoted considerable space in their manifestos to flexible working hours, parental leave, and preschool child care provision. The Conservatives pledged to make Britain the most family-friendly country in Europe, and the Labour and Liberal Democrat manifestos also made specific reference to sex discrimination in the work place and gender disparities in pay. The salience of “family issues” and other traditional values is measured by the Manifestos Research Group over time (Volkens et al Reference Volkens, Lehman, Merz, Regal and Werner2014).Footnote 4 As Figure 1 shows, these issues were far more salient in 2010 than they had been previously.
Salience of “family issues” and other traditional values in party manifestos.

The 2010 election saw more women candidates and more women winners than ever before, creating a step-change in the partisan balance of women's representation in parliament. As a result of selecting more women candidates in winnable seats the Conservatives more than doubled the number of Conservative women MPs, from 17 in 2005 to 48 women in 2010 (Campbell and Childs Reference Campbell, Childs, Geddes and Tonge2010). The effect of these changes in the supply of women candidates has important methodological implications. When only the Labour party put forward women candidates with any serious chance of winning, it was only possible to examine whether voters would offer support (or not) to the Labour party on the basis of the candidate's sex. In 2010, for the first time parties other than Labour put forward women candidates in winnable seats, making it possible to try and untangle the relationship between candidate sex, political party and vote choice to a much greater extent than previously. Regardless of the salience of gender as an electoral issue, it would simply not be possible to sensibly carry out this type of analysis on earlier British elections since too many of the women candidates stood for only one of the major parties.
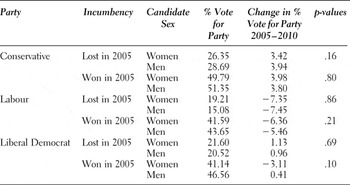
Despite the controversy surrounding the selection of so many women as Conservative candidates, by and large those women who did stand for election did just as well as their male counterparts (see Table 1). Although male Conservative candidates tended to do slightly better than female Conservative candidates, both in those seats where the Tories were the incumbent (51.4% vs. 49.7%) and in those seats where they were the challenger (28.7% vs. 26.3%), the differences are relatively small and may just reflect differences in the winnability of the seats for which men and women were selected. If we compare the average swing for men and women Conservative candidates (which controls for the winnability of the seats), the differences are even smaller and do not reach conventional levels of statistical significance. Where women stood as the Conservative candidate, the party did 3.4 percentage points better than they did in 2005, and where men stood, the improvement was 3.9 percentage points. Thus there does not appear to be any evidence to suggest that putting forward so many women candidates cost the Conservatives votes. Similarly, there is little to suggest that women candidates for Labour did any worse than men. Women candidates for the Liberal Democrats did slightly worse than men in the seats which the party held in 2005: where women stood there was a 3.4 percentage-point swing against the Lib Dems, and where men stood, there was a 0.4 percentage point swing toward the Lib Dems, but, again, this difference was not statistically significant, and we should probably treat these results with caution since there were only 12 women candidates standing for the Lib Dems in seats they won in 2005.
Performance of male and female candidates at the 2010 election

Note: P-values from a between groups comparison of means, ANOVA.
These findings show that, on average, men and women candidates performed more or less equally well for each of the three main parties, which suggests that the overrepresentation of men in Parliament owes more to inequalities in the selection process than it does to discrimination by voters. However, as Dolan (Reference Dolan2010) cautions, just because real-world election results suggest that women do not suffer disproportionally at the ballot box because of their sex, we should not assume that this means that voter attitudes about gender are irrelevant to politics, or even irrelevant to vote choice. We can only infer so much from aggregate level data about individual behavior, and an individual's attitudes toward descriptive representation and gender stereotypes may shape an individual's vote-choice decision when faced with a woman candidate.
MATERIALS AND METHODSFootnote 5
Previous studies on candidate sex effects have been hampered by the small number of women candidates who run for office in winnable seats. This creates problems at the analysis stage since inferences about whether or not women are more likely to support women candidates are often based on very small samples of women candidates. This increases the likelihood of outliers—or unique personalities—driving the results, and just as we would be unwise to infer too much about gender voting from whether someone supported Mrs Thatcher or not, we should also treat with caution the results of analysis based on relatively few women candidates, since prominent female politicians may in a sense transcend gender. The increased supply of women candidates in winnable seats at the 2010 election helps us to overcome this problem and provides a valuable opportunity to study the effect of gender away from the glare of the media spotlight on one or two key personalities and examine how candidate gender influences voting behavior across a range of different political contexts.
In order to test our hypothesis about the effect of candidate sex on voting behavior, we link data on candidate sexFootnote 6 and constituency characteristics to cross-sectional survey data. The individual-level data on voters come from the 2010 British Election Study.Footnote 7 The survey was administered to a random sample of 3,075 respondents in 205 constituencies. After linking the survey data to the candidate data, our sample includes 154 women candidates (54 Labour; 58 Conservative; and 42 Liberal Democrat). This provides us with a robust sample to test the impact of candidate sex on voting behavior.Footnote 8
Attitudes toward Descriptive Representation
Our key theoretical variable of interest is attitudes toward the descriptive representation of women. To measure these attitudes, we draw on a special module in the British Election Study, which includes the following four items on gender equality:
-
1. Women are better representatives of women's interests than men.
-
2. Most men are better suited to politics than are most women.
-
3. Women need to get more involved in politics to solve problems that concern them.
-
4. A husband's job is to earn the money; a wife's job is to look after the home and family.
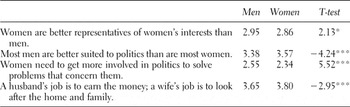
For each item, respondents could agree strongly, agree, neither agree nor disagree, disagree, disagree strongly, or refuse to give an answer. Descriptive statistics are shown in Table 2, which reports the mean for each item on a scale of 1 to 5, where 1 is strongly agree and 5 is strongly disagree. With respect to attitudes about descriptive representation, both men and women were more likely to agree than disagree with the statement that women are better representatives of women's interests than men, and women need to get more involved in politics to solve problems that concern them (as illustrated by mean values greater than 3, where 3 indicates neither agree nor disagree). Women were significantly more likely to agree with these statements than men, particularly on the issue of women getting more involved in politics; where 67% of women agreed with the statement compared to 53% of men.
Attitudes toward gender equality

Note: Items are measured on a 1−5 scale where 1 = strongly agree and 5 = strongly disagree. *p < 0.05; **p < 0.01; ***p < 0.005.
The other two items are less directly related to issues of descriptive representation and tap more into attitudes about traditional gender roles. Both men and women were more likely to disagree than agree with the statements that men are better suited to politics than women and that a husband's job is to earn the money (as illustrated by mean values less than 3). Once again women were significantly more likely than men to disagree with these statements. These results reflect the findings of Dolan's 2013 U.S. study: “women are more likely than men to have a baseline preference for women candidates, to want to see more women in office, to support gender parity in elected office and to support same-sex representation” (Dolan 2014b, 69).
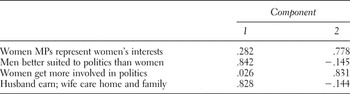
In order to check whether these items do indeed tap into attitudes about descriptive representation and traditional gender roles specifically rather than attitudes toward gender equality in general, we undertake a principal components analysis of the responses to all four items (Table 3). These items load on to two clear dimensions (Campbell, Childs, and Lovenduski Reference Campbell, Childs and Lovenduski2010). As such, rather than simply combining items relating to gender equality in the BES data we create two additive scales. The first combines items one and three to create a scale measuring attitudes toward the descriptive representation of women. The second scale, measuring attitudes toward traditional gender roles, combines items two and four. Each scale includes a range of valid responses from zero to eight, where eight represents a more feminist position: either high levels of support for the descriptive representation of women or opposition to traditional gender roles.
Principal components analysis of attitudes toward gender equality

The mean score for women on the descriptive representation scale is 4.79 compared to a mean score of 4.49 for men. (The sex difference is significant at the 0.01 level.) The mean score for traditional gender roles is 5.34 for women and 5.03 for men. (The sex difference is significant at the 0.01 level.) Our key hypothesis concerns attitudes toward descriptive representation: we expect voters who are in favor of the descriptive representation of women to be more likely to vote for women candidates, but we expect the effect to have a more pronounced effect among women than men, as the issue is likely to be more salient to women. By way of comparison we also examine public attitudes toward traditional gender roles, which according to prior theory should be empirically unrelated to vote for women candidates (Brooks 2013; Dolan Reference Dolan2014a, Reference Dolan2014b; Dolan and Lynch Reference Dolan and Lynch2014).
Modeling the Impact of Candidate Sex on Vote Choice
Our main hypothesis is to investigate the link between attitudes toward descriptive representation and support for women candidates. Do women who hold strong feminist views about the importance of getting more women into politics put these views into practice when they have the chance by voting for women candidates? Or do partisan ties override feminist principles?
There are a number of challenges involved in estimating the effect of candidate traits on voting behavior in multicandidate elections, which make common econometric choice models, such as multinomial logit, inadvisable (see Alvarez and Nagler Reference Alvarez and Nagler1998). One solution is the conditional logit model, which is “conditional on the characteristics of the choices” (Alvarez and Nagler Reference Alvarez and Nagler1998, 56) and so can take into account candidate characteristics in a parsimonious manner. In order to estimate the effects of candidate sex on voting behavior, we therefore specify a conditional logit model (Long and Freese Reference Long and Freese2005). The model uses stacked data, with three rows for each respondent, one for each party. The conditional logit model allows us to fit how the choice between party alternatives is affected by the characteristics of the candidates. In formal terms Long and Freese (2005: 307) specify the model as:
 $$\Pr (y_i = p/x_i, z_i ) = \displaystyle{{exp\left( {z_{ip} \gamma + x_i \beta _p} \right)} \over {\mathop \sum \nolimits_{j = 1}^J exp\left( {z_{ij} \gamma + x_i \beta _j} \right)}},$$
where zim contains values of the alternative specific variables for alternative p and case i. In our model there are three alternatives for party p: Labour, Conservative, and Liberal Democrat. Then ϒ is a parameter indicating the effect of the alternative specific variables on the probability of voting for one party over another. In general, for each variable zk, there are J values of the variable for each case, but only the single parameter ϒk. This enables a single coefficient for the effects of candidate sex to be estimated regardless of the candidate's party. We also tested for evidence of variation in these coefficients across parties. As in a multinomial logit model, x i contains case-specific independent variables for case i, and βp contains coefficients for the effects on alternative p relative to the base alternative (Labour).
The control variables present in the models for both men and women are Party Like Score (an eleven-point scale from 0 = strongly dislike to 10 = strongly like the party), which captures both positive and negative disposition to each of the parties; Contacted by party (1 if the respondent was contacted by the party during the campaign, or 0 otherwise), which captures mobilization and campaign effects; Incumbency, which captures incumbency advantage, and Distance from Contention (for third- and lower-placed parties this is the difference between the 2005 share of the vote for the party and that for the second-placed party, and 0 if the party came first or second in the constituency), which captures supply side factors to do with the allocation of tickets to women candidates. In particular women selected for Labour from all-women-shortlists (AWS) tend to be selected in competitive seats more often than women candidates from other parties. Finally we control for Candidate sex (1 if the candidate is a woman, or 0 if a man), which is our key theoretical variable of interest. Descriptive statistics are shown in the appendix. All of these controls are alternative-specific, so their values can vary across the party options for a given respondent. This enables a single coefficient for each variable to be estimated regardless of party. In practice this is equivalent to assuming that the magnitude of the effect for each of these variables is constant across party options. We tested the validity of this assumption by specifying party-interactions (not shown), none of which were significant.
The model also allows case-specific variables as predictors. The attitudinal variables that we examine as a potential moderator of candidate sex effects are attitudes toward descriptive representation and attitudes toward traditional gender roles discussed above. Both of these variables are measured on a 0–8 scale, where higher values indicate a more feminist position. Where a control variable is case-specific (say X), two coefficients are estimated (Con × X and LD × X) for the effects on voting Conservative and Liberal Democrat, respectively, each relative to the baseline Labour (just as a regular multinomial logit/probit model would have two such coefficients).Footnote 9 In order to test our main hypotheses we also specify an interaction effect between candidate sex and attitudes toward gender.
RESULTS
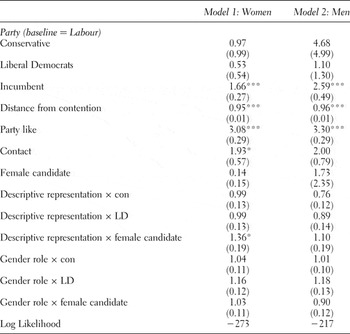
The conditional logit model of vote choice for women (Model 1) and men (Model 2) who voted for the Conservatives, Labour, or Liberal Democrats is shown in Table 4. The model includes controls for the main effects of candidate sex and attitudes toward descriptive representation and an interaction term between these attitudes and candidate sex.
Conditional logit models of party vote choice, odds ratios

Notes: Model 1 contains 2,098 observations, and Model 2 contains 1,765 observations. Standard error in parentheses. *p < 0.05; **p < 0.01; ***p < 0.005.
The coefficients for party are alternative-specific intercepts. In both models the main effects of the control variables for competiveness, incumbency status, mobilization, and party attachment are significant, in the expected direction, and of a similar magnitude for both men and women (see Table 4). The probability of an individual voting for a party declines the further that party is from contention; increases with direct personal contact with a party worker; and—not surprisingly—increases the more positively predisposed someone feels toward the party in general. We also tested for party-specific interactions with these variables. None were significant. This indicates that the magnitude of the effect for these variables is similar across party options.
The main effects for attitudes toward descriptive representation and traditional gender roles are specified as party interactions (since these variables are case-specific). None of the main effects are significant. Over and above the factors already discussed, people who support descriptive representation or are opposed to traditional gender roles are not more likely to vote for one party rather than another. However, of more interest from a theoretical point of view are the interaction terms with candidate sex. Are women who think women MPs better represent women's interests more likely to vote for women candidates? If women act on these views in the ballot box, they should differ in their propensity to vote for women. The interaction term between attitudes toward descriptive representation and candidate sex is statistically significant and in the expected direction for women (Model 1). This indicates that women who support the descriptive representation of women in politics are more likely to vote for a party when it puts forward a woman candidate than women who are not concerned about descriptive representation. This signifies a process whereby those women who think that women MPs better represent women's interests actually put this into practice and, if given the chance, are more likely to vote for women candidates.
By contrast, men's attitudes toward the descriptive representation of women are unrelated to vote choice and unrelated to whether or not they vote for women candidates. Although some men hold feminist principles and think more women should be represented in parliament, they do not act on these principles in the ballot box and are not any more likely to vote for women candidates than men who are unconcerned about descriptive representation. But by the same token there is also little evidence that men punish women candidates, even when they hold strong views about traditional gender roles. From the relationship between attitudes toward traditional gender roles and support for women candidates, we can see that neither the main effects nor the interaction term are significant. This indicates that gender stereotypes do not affect whether or not men vote for women candidates, and even those men who think that women should stay at home do not sacrifice their preferred party by voting for a man rather than a woman. This is consistent with recent research in the United States (Brooks 2013; Dolan Reference Dolan2014a, Reference Dolan2014b; Dolan and Lynch Reference Dolan and Lynch2014).
We also investigated the possibility that men reacted differently to women candidates from different parties as well as the possibility that they reacted differently to women candidates by the incumbency status of the party or the competitiveness of the party. In neither scenario did we find evidence of any significant differences, for either men or women. Unlike in the United States, where some studies have found that people are less likely to vote for Republican women candidates than Democrats (King and Matland Reference King and Matland2003; Lawless and Person Reference Lawless and Person2008), we do not find any evidence to suggest that people are less likely to vote for Conservative women candidates than Labour. We also tried a number of alternative specifications of the model, where distance from contention was replaced by a measure of marginality, but this did not affect the substance of our findings either. We also examined the impact of party identification in addition to and in place of party affect, but this did not make any difference. Unlike in the United States, those people who do not identify with a particular political party are not more likely to vote for (or against) a candidate based on sex. Lastly, it could be argued that our controls are too strong and that candidate sex may have an indirect effect on vote choice via our measures of party affect. Perhaps if, for example, the Conservatives put forward a woman candidate, individuals who hold traditional views on gender roles would become disaffected with the party and vote for an alternative. In this scenario the inclusion of party affect in our models may wash out the effects related to candidate sex. In order to consider this possibility, we ran the models again without the party affect variable, but the main results of our analysis did not change.
These findings lend support to our main hypothesis that women's attitudes toward descriptive representation are linked to whether or not they support women candidates. These findings are robust to a number of different specifications. We can get a clearer idea of the magnitude of these effects by inspecting how the likelihood of voting for women candidates varies according to a woman's level of support for descriptive representation. Generating marginal effects of interaction terms in nonlinear models is not straightforward, and an alternative, and perhaps more meaningful approach, is to exponentiate the coefficients and interpret the interaction in terms of the natural metric of the model (Buis Reference Buis2010). For conditional logit models, these are the odds ratios. The odds ratio for candidate sex is 0.14, which means that the odds of voting for a party is 0.14 times lower when the party puts forward a female candidate than when it puts forward a male candidate. Since there is an interaction effect between candidate sex and attitudes toward descriptive representation, this effect of candidate sex refers to women who are completely opposed to descriptive representation (that is, those women who scored zero on the 0–8 scale, of which there are relatively few). Nonetheless, the magnitude of this effect is quite substantial. Within this category we expect to find one woman voting for a party when it puts forward a woman candidate for every seven women voting for that party when it puts forward a man.
The interaction effect tells us by how much the effect of candidate sex on vote choice differs by women's level of support for descriptive representation, but it does so in multiplicative terms. The results also show that this interaction is significant. The odds ratio for the interaction term is 1.36, which means that the odds of voting for a party if it puts forward a woman candidate is 1.36 times higher for every point increase on the descriptive representation scale. So, for a woman who holds roughly the mean level of support for descriptive representation (5 on the 0–8 scale), the odds of voting for a party if it puts forward a woman candidate are 0.65 times less than when it puts forward a male candidate. This means that within this category we can expect to find about two women voting for a party when it puts forward a woman candidate for every three women who vote for that party when it puts forward a man. However, for women who exhibit a high level of support for descriptive representation (that is, women who scored 8 on the scale) the odds of voting for a party are 1.6 times higher if it puts forward a woman candidate than a male candidate. This means that within this category we expect to find about three women voting for a party when it puts forward a woman candidate for every two women who vote for that party when it puts forward a man.
In substantive terms, the likelihood of voting for women candidates varies quite considerably by level of support for descriptive representation. Women with strong feminist principles about the representation of women are much more likely to vote for a party that puts forward a woman candidate than women who do not really care about the issue. However, even among feminist women, the effect of candidate sex on vote choice is not particularly strong, and relatively few women are prepared to compromise their preferred party simply due to the sex of the candidate. Moreover, the size of the feminist group to which this positive effect of candidate sex refers is also relatively small. Only about 9% of women hold the sort of strong feminist principles that are associated with the greater likelihood of voting for women candidates. Part of the reason, then, that simplistic women-voting-for-women effects are not found is therefore because the effect only applies to a (relatively) small group of voters.
DISCUSSION
Previous research in the United States shows candidate sex effects vary from election to election. We suggest that part of the explanation for these inconsistent results pertains to the salience of gender (and perhaps more specifically candidate gender) at the time of the election. In this respect, 2010 represents something of an unusual context by British standards. There were not only many more women candidates than in previous elections, but the salience of candidate gender was also greater than in the past. Intraparty dispute about the selection of women candidates brought the issue to the fore and perhaps activated the political salience of attitudes toward descriptive representation.
Indeed, preliminary analysis of past elections in Britain—where gender was not such a salient feature of the political landscape—confirms this point. With respect to 2005 and 2001 we do not find any evidence of candidate sex effects on voting, although we should perhaps treat the results with a degree of caution since the number of women candidates was relatively small, particularly on the side of the Conservative and Liberal Democrats. In this respect the recently held 2015 election offers a valuable opportunity to further study these issues, as both the number of women candidates and the number of women elected to office were historically high. Future research may therefore wish to explore the different ways in which gender is salient as a political issue—and how the politicization of gender translates into voting preferences.
Thus by British standards 2010 was quite an unusual election, as the two main parties combined fielded more women candidates in winnable seats than ever before. In 2010 the political rhetoric about gender was closely linked to issues of descriptive representation, and how women felt about this issue appears to have exerted quite a strong impact on their voting behavior. Our results from a series of conditional logit models show that in 2010 women were more likely to vote for women candidates, but only when they held positive views about the value of descriptive representation of women. However, the group of women who held these views was relatively small (just 9%), and we suggest that this might explain why there tends to be little evidence of women voting for women at the aggregate level. Exceptional circumstances where issues of gender equality become highly politicized and extremely electorally salient, such as the 1992 elections in the United States, may yield a situation where more women are motivated to vote by feminist concerns, but our research suggests that in a typical election this group will be small. By contrast, men's attitudes toward descriptive representation are unrelated to whether or not they vote for women candidates. For both sexes, gender stereotypes are not related to vote choice and are not related to support for women candidates. These results are robust to a number of different specifications and are not mediated by political party.
The implications of these findings are three-fold. When gender is politicized at the party level, it has the potential to influence how voters participate in the political process. But it does not have a uniform impact. Women do not react in a homogenous way to the sex of the candidate, and the assumption that women are more likely to vote for women candidates is therefore too simplistic and assumes a uniformity of motivations for doing so that are not present in practice. This goes against a straightforward identity politics effect. Secondly, women who hold strong feminist principles act on these principles in the ballot box and are more likely to vote for a woman candidate when given the chance to do so. There is thus a link between how women think about the issue of descriptive representation and how they actually behave in practice. Those women who think there should be more women in politics go out of their way to make it happen, even if it means compromising on their preferred party. We suggest that the salience of gender at the party level brought these issues to the fore. Perhaps if it had been framed in a different way, we would see different mechanisms at work.
Thirdly, there is no evidence that women candidates are discriminated against at the ballot box. Even men with strong traditional views, who think that a woman's place is in the home, do not trade off voting for their preferred party when faced with a woman candidate, whatever party that woman stands for. Related to this last point, there is little evidence that support for women candidates is affected by the party for which they stand. In the United States a number of studies have found that Republican women candidates tend to face a backlash from voters who hold traditional gender stereotypes. However, no such trend is evident in the UK, and Conservative women are no more or less likely to get punished at the ballot box than women candidates from either of the other two main parties. One potential reason for this is that in the UK each of the main parties are relatively close to each other on gender equality issues, and so there is not the same sort of positional difference between the parties that there is in the United States (see Dolan 2004).