

Why are citizens in advanced industrialized nations willing to accept the high price of agricultural products? Despite a massive decline in the number of agricultural workers and active farmland over time, agricultural protectionism is alive and well among developed economies.Footnote 1 The Organization for Economic Cooperation and Development (OECD) estimates that, on average, consumers in advanced industrialized countries spend 10 percent of their annual consumption on agricultural products to support local farmers. In countries such as Switzerland, Norway, Japan, and South Korea, more than 40 percent of consumers' expenditures on domestically produced commodities went to support farmers during the worldwide recession in 2009.Footnote 2
Not only are the actual levels of agricultural protection high among OECD countries, but a series of public opinion surveys, which directly measure individual preferences for regulating food imports, suggests that around half of the citizens seem to be willing to bear this cost even during a global recession. Forty-three percent of U.S. citizens in March 2009 indicated “it is the wrong thing” for the Obama administration to cut down agricultural subsidies, while 44 percent said they think “it is the right thing.”Footnote 3 Fifty percent of European respondents in the Eurobarometer (fall 2007) supported the status-quo level of tariffs and quota protection for agricultural commodities, while 36 percent opposed it.Footnote 4 A little more than 55 percent of Japanese citizens in a nationally representative survey we conducted in February 2009 agreed with the statement “We should not accept import liberalization of agricultural products in order to protect Japanese agriculture,” while 37.8 percent believed “We should accept import liberalization of agricultural products in order to maintain Japanese manufacturing export.”Footnote 5 In sum, consumers appear to favor, rather than simply tolerate, agricultural protection.
Two common explanations for agricultural protectionism are unhelpful in making sense of this puzzle. The first focuses on the collective action capacity of interest groups: producers (that is, farmers) are concentrated and better politically organized than diffused and unorganized consumers.Footnote 6 The second focuses on political mobilization by elites: legislators exchange trade protection and subsidies for rural and agricultural votes.Footnote 7 Due to its focus on producer power, however, the literature simply makes assumptions about consumers' preferences for free trade: consumers want free trade but cannot act on it due to the collective action problem. The two conventional accounts do not help us understand why the public seems to be willing to accept high-priced agricultural products to support farmers.
This article presents new evidence from a survey experiment in Japan conducted in December 2008 that challenges the assumption of free-trade-favoring consumers. The experiment randomly assigns visual stimuli to activate respondents' identification with either producer or consumer interests and proceeds to ask attitudinal questions regarding food imports. That is, we primed respondents to think about their occupational or consumption interests before soliciting their attitudes toward food import. The results suggest that consumer priming has no systematic effect on respondents' attitudes toward food import. Surprisingly, the producer priming increases respondents' opposition to food import, particularly among those who fear for their future job security.
We further test two possible mechanisms to explain why thinking about jobs and production activities makes respondents more supportive of agricultural protectionism: “sympathy” for farmers and “projection” of their job insecurities onto farmers. The results lend strong support to the projection hypothesis: those who fear future job insecurity and loss of income are the ones who become more supportive of agricultural protectionism with the activation of a producer perspective. This emergence of a “coalition of losers” is paradoxical because workers with high job insecurity should be the prime beneficiaries of cheaper food imports.
Our results help us solve the paradox of persistent mass support for agricultural protectionism in the midst of the worldwide recession. They also encourage scholars to move beyond the dichotomous conceptualization of producer and consumer interests in the political economy literature and pay due attention to why consumers often align with producers to support protectionism even when doing so imposes a financial burden. Our finding of a “coalition of losers” that cross-cuts producer and consumer interests advances the long-standing research on coalition politics in the global economy that mostly focuses on class or sectoral alliance.Footnote 8 Our approach echoes recent research by Mansfield and Mutz, which demonstrates that, due to exposure to media and the elite discourse on trade's effect on the national economy, U.S. citizens form their attitudes toward trade sociotropically rather than based on individual occupational profiles.Footnote 9 Our work differs from theirs by theorizing how citizens' perceived similarities and differences with other sectors determine their attitudes toward protecting a declining sector and by paying attention to consumer interests in the global economy.
Beyond the literature on trade policy preferences and coalitions, the results have broader implications for the study of inequality and redistribution in the global economy, preference formation of the mass public on issues of economic policy, and people's formation of “self-interest” and inferences about others' needs in a social context.
Why Experiment? Priming Without Framing
While standard trade literature assumes consumers' preference for free trade, the emerging research suggests various parameters beyond price sensitivity that make some consumers more protectionist than others: consumption patterns,Footnote 10 safety and quality concerns,Footnote 11 ethical concerns,Footnote 12 the love of variety,Footnote 13 and community and family concerns.Footnote 14 The complexity of consumer preferences poses several major issues that have stalled inquiry into how producer and consumer interests shape trade policy. The first is the dual—and often conflicting—perspectives that citizens have toward globalization as producers and consumers. Because the majority of citizens engage in both production (that is, income-earning) and consumption activities, a key question is not whether consumers' interests matter more than producers'—we need to ask whether citizens' support for agricultural protectionism differs when they assess their positions in the global economy as producers or consumers.Footnote 15 This question calls for an experimental research design that randomly primes citizens to think about globalization from the perspective of a producer or consumer.
Second, in light of studies that suggest consumers' preferences are indeterminate and complex, we should not frame respondents to think about the positive or negative consequences of food import when we ask about their attitudes toward it. For instance, Hiscox's framing experiments gave a different introductory statement to randomly assigned treatment groups: “Many people believe that increasing trade with other nations creates jobs and allows Americans to buy more types of goods at lower prices” or “Many people believe that increasing trade with other nations leads to job losses and exposes American producers to unfair competition.”Footnote 16 This framing potentially poses a double-barreled problem because it simultaneously primes respondents to think about trade from both consumer and producer perspective and frames them to think of trade's positive or negative distributional consequences. Instead, we need to design an experiment that primes respondents to think about food import from a consumer or producer perspective without framing its distributional consequences.
Research Design and Method
We conducted an online survey experiment in Japan with a sample of 1,200 respondents between the ages of twenty and sixty-five during the first week of December 2008, when media coverage of the world financial crisis and the rise of unemployment among temporary workers was extensive.Footnote 17 Japan is an appropriate case for our research because the public strongly supports agricultural protection despite the fact more than 40 percent of food expenditure goes to support farmers and the prevalent form of this protection is price support, which directly burdens consumers.Footnote 18 To understand the sources of support for agricultural protectionism, we randomly assigned visual stimuli to three experimental groups. The experiment consisted of two groups that received the treatment (“stimulus”) and another control group without any stimulus (400 respondents each).
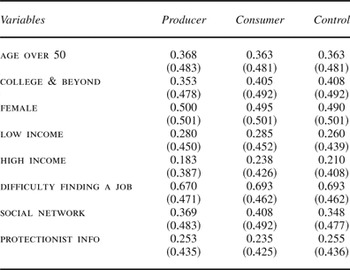
The producer-priming group was shown three photographs—a typical white-collar office, a car factory, and rice field. The images were chosen to represent three major sectors of the economy (service, manufacturing, and agriculture) that would activate respondents' consciousness as producers (or, their occupational interests). The consumer-priming group was also shown three photographs—a supermarket with food, a consumer electronics retail store, and a large-scale casual clothing store. These images encompass three areas of basic consumer goods that citizens purchase regularly regardless of their income, gender, family status, and age. These visual stimuli were intended to activate respondents' consciousness as consumers. The control group received no stimulus. The treated and control groups were balanced in their key demographic characteristics such as age, gender, income, and respondents' self-assessed difficulty in finding a comparable job, as Table 1 shows.
Producer priming (pictures 1, 2, and 3)
Note: The first three photos were used for the producer-priming. Before showing the photos, we asked, “Please carefully look at the photos below and answer the following questions” (translated by the authors). Photo Q2 is a follow-up, enforcement question for the first photo: “In what sector do you think people at this office work?” to which respondents choose from finance, manufacturing, publishing, public service, or other.
Source: For the first (white-collar office) and the third (harvesting) photos, Copyright © Kenji Hall-Creative Commons Attribution Licensed. For the second photo (car factory), Copyright © Chang-Ran Kim.

Consumer priming (pictures 4, 5, and 6)
Note: The first three photos were used for the consumer priming. Before showing the photos, we asked, “Please carefully look at the photos below and answer the following questions” (translated by the authors). Photo Q5 is a follow-up, enforcement question for the first photo: “What type of grocery shop do you think this is?” in which respondents choose from a small mom-and-pop shop, convenience store, an organic and natural food store, a large supermarket, or other.

The balanced demographics of three experiment groups

Notes: Table lists mean values with standard errors in parentheses.
Using images to prime respondents has two advantages over framing experiments that supply respondents with opinions about how trade affects consumers and producers.Footnote 19 First, priming differs from framing in that the former makes some issues more salient than others and thus influences the standards by which the subject is evaluated,Footnote 20 while framing characterizes issues negatively or positively.Footnote 21 This characteristic of priming allowed us to manipulate respondents' “standards” by which food import is judged (that is, as a producer or consumer) without imposing on them the judgment itself (that is, food import is good or bad for producers/consumers). This was critical for the purpose of our study since we do not yet know whether activation of a consumer perspective uniformly leads to lower or higher support for agricultural protectionism. Instead, the visual stimuli simply primed respondents to think of themselves as consumers or producers. Second, our visual stimuli did not explicitly convey information either about trade or globalization. This was appropriate for the purpose of our study because not all production and consumption activities are linked, in reality or in citizens' minds, to trade or globalization. After the treatment, we posed attitudinal questions about food import and general trade issues. The survey instruments are described in the results section.
The potential weakness of priming using visual images is uncertainty about whether these visual images indeed achieve the intended effects—in this context, making respondents think about jobs or consumption.Footnote 22 In order to ensure that respondents indeed received the treatment, we embedded the following enforcement questions and direct test of priming effects in designing our survey.Footnote 23
First, we asked a follow-up question immediately after showing each image that drew respondents' attentions to production versus consumption activities. For example, after showing the picture of car factory, we asked: “What type of car do you think they are producing?” Respondents choose from five options such as a racing car, a hybrid car, or a regular car. After showing the photograph of a supermarket, we asked, “What type of grocery shop do you think this is?” in which respondents choose from five options including a large supermarket, an organic and natural food store, and small mom-and-pop shops. The idea is not to test the facts about these images, but rather to ensure that respondents see these photos and think of them either from the job-related or the consumption-related perspective. More than 70 percent (for the white-collar office photo) to 96 percent (for the rice field image) of respondents converged on the same answers to these questions, confirming their reception of the stimuli.
Second, after the treatments and attitudinal questions about food import, we also conducted a direct test of priming effects. We asked respondents to take positions on whether they think mass media tends to side with producers or consumers in their reporting.
Respondents answered on a five-point scale: 1, consumers; 2, more or less consumers; 3, can't say one or the other; 4, more or less producers; and 5, producers. The idea is to measure respondents' strength of identification with producer or consumer interests by using respondents' perception about media reporting as an anchor (“benchmark”). Without this anchoring vignette, the comparability of responses on a conceptual question such as “identity” is in question.Footnote 24 We infer that those with strong identification with producer interests are more likely to think that the media tends to side with consumers (that is, media should report more from a producer perspective) and those with strong identification with consumer interests are more likely to think that the media tends to side with producers (that is, media should report more from consumer perspective).
If our priming worked in the way we suggested, we would expect to see that (1) producer priming increases the proportion of respondents who think that the media takes consumers' side, and consumer priming increases the proportion of respondents who think that media takes the side of producers compared to the control group;Footnote 25 and that (2) the proportion of neutral responses (“can't say one or the other”) is higher in the control group than the producer- or consumer-priming group. Figure 1 summarizes the priming effects among three subgroups of respondents who strengthened their producer identity with the producer treatment.Footnote 26 The three groups turned out to be the respondents with high job insecurity: the low-income group, factory and construction workers, and retail workers.Footnote 27 They constituted 48 percent of our sample. The test shows that our priming worked in expected directions for all of the three subgroups. Producer priming increased the respondents' identification with producers and the substantive impact ranged from an increase of 7.1 percentage points (low-income group) to 19 percentage points (retail workers). Consumer priming also increased the respondents' identification with consumers in all three subgroups, and the substantive impact ranged from 2.9 percentage points (retail workers) to 14.1 percentage points (factory and construction workers).Footnote 28 The proportion of neutral responses was substantially higher for the control groups than the treatment groups for all three subgroups. Thus, the visual images we used had the intended priming effects.
Substantive impact of priming on respondents' identification with producer versus consumer in three subgroups of respondents (%)
Note: The x-axis shows the three experimntal groups and the y-axis shows the proportion of respondents in each response category to a question on whether they think the media sides with producers or consumers. The dark gray bar indicates the proportion of respondents in “media sides with consumers (that is, identification with producer).” The numbers in the bar graphs are the percentage of respondents in each response category. Difference-in-means tests for mean estimates suggested that the difference between producer treatament and the control groups was statistically significant at 0.045 (factory and construction workers), 0.28 (low income), and 0.047 (retail workers).

The Results: Aggregate Effects of Priming
Figure 2 (parts a and b) summarizes the distribution of responses for questions on food imports and general trade. The first question was “Food import from foreign countries has been increasing in the past. What is your opinion on this?” and the last was “Import from foreign countries has been increasing in the past. What is your opinion on this?” Respondents chose answers from a five-point scale (very good, good, can't say one or the other, bad, and very bad).Footnote 29 For each experimental group, a black bar describes the proportion of protectionist responses (“bad” and “very bad”), a white bar describes the proportion of neutral responses, and a gray bar describes the proportion of respondents that supported increasing food imports (“good” and “very good”).
Effect of priming in aggregate
Note: The x-axis shows the three experimental groups and the y-axis shows the proportion of total respondents (%) that chose each answer. The difference-in-means tests for protectionist responses (%) showed that the difference between producer treatment and the control groups for food import issue was 0.09(0 < x < 1, standard error 0.035) and statistical significance at PR(|T| > |t|) = 0.011. The difference between consumer treatment and the control groups was 0.01 (standard error 0.035) and was not statistically significant.

The figure shows that, in all groups, the proportion of protectionist responses roughly doubled for the issue of food import compared to the issue of general trade. This is counterintuitive in light of the two conventional approaches, one emphasizing the individual occupational profiles of respondents and the other looking at their ideological predisposition as determinants of trade attitudes.Footnote 30 The occupational approach would predict a higher proportion of protectionist respondents in the issue of general trade than the issue of food import since food import negatively affects the jobs and wages of farmers only, which constitute 0.7 percent of our sample. The ideological approach would predict that respondents exhibit similar ideological predisposition for general import of goods and import of food. Yet, respondents clearly viewed general import of goods differently from food imports: more than a half of respondents across the three groups thought increasing food import is “bad” or “very bad.” Why?
Possible explanations for stronger opposition to food import are protectionist sentiments that consumers might have such as food nationalism, safety and quality concerns, and food security concerns (for example, food self-sufficiency ratio), which have been all observed in Japanese elite discourse.Footnote 31 Yet, these accounts would predict that consumer-priming increases opposition to food import. Contrary to this prediction, Figure 1a suggests that consumer priming does not provoke higher or lower levels of opposition to food import than in the control group. On the other hand, producer-priming increases opposition to food import by 9 percentage points compared to the control group and the difference is statistically significant at the 5 percent level.Footnote 32
This leads to two questions. First, why does the activation of a producer perspective lead to higher support for agricultural protectionism? Second, why do citizens think of agricultural trade differently from general trade? These questions force us to think beyond how individuals perceive their own interests, and pay attention to how they perceive the interests of “others.” Because our question concerns an uncompetitive sector in the economy, studies on mass support for income redistribution provide a useful starting point.
Disentangling the Puzzle of Consumers Thinking Like Producers
We disentangled this puzzle along two possibilities suggested by experimental studies on mass support for income redistribution: sympathy in the public for “poor” and “hardworking” people (in this case, farmers), and the public's projection of their own job insecurity onto a symbolic declining industry (that is, agriculture). Both mechanisms forced us to move beyond occupational theories of trade policy preferences, based on Stolper-Samuelson and Ricardo-Viner models, which derive individual policy preferences from their occupations' relative positions in the international economy.Footnote 33 Instead, we considered how individuals perceive other occupations or sectors (that is, agriculture) when forming their attitudes toward trade.Footnote 34 To do so, we analyzed which subgroups of respondents were sensitive to producer and consumer priming and identified the direction of their attitudinal differences among the three experimental groups.
Sympathy
One possible explanation for the puzzle is that producer priming provokes agricultural protectionism due to the sympathy that consumers have for farmers: the dominant occupational image of farmers is that they work hard for low pay in a declining industry. Indeed, despite the fact that the household income of farmers has exceeded that of the average employee since 1975,Footnote 35 sociologists have found that farmers' “occupational prestige scores,” in which citizens ranked the socioeconomic prestige of more than eighty occupations since 1955, have been extremely stable and low throughout the 1990s.Footnote 36 Citizens might perceive agricultural protectionism as a redistributive policy.Footnote 37
Experimental studies also lend support to this intuition by showing that the level of respondents' income is only a partial predictor of attitudes toward redistribution. Survey experiments suggest that public support for redistribution increases when the public sympathizes with the recipients and feel that they “deserve” it due to bad luck and despite hard work.Footnote 38 Lu, Scheve, and Slaughter also demonstrate that altruism accounts for why low-skill and labor-intensive industries, such as agriculture, receive high levels of protection across countries with different factor endowments, such as the United States and China.Footnote 39
In order to identify whether sympathy is a source of support for protectionism, we asked the respondents to choose three words that characterized their images and feelings toward producers and consumers before the respondents received the visual stimuli.Footnote 40 Among twenty word choices, the top four for producer images were “responsibility” (48.3 percent), “sweat” (48.1 percent), “rural” (43 percent), and “factories” (36.7 percent). On the other hand, the top four for consumer images “money” (57.9 percent), “citizens” (46.0 percent), “information” (28.6 percent), and “urban” (27.7 percent). We constructed a variable, sweat, that takes a value of 1 if a respondent chose “sweat” as one of the three words to describe the producer images and 0 otherwise.Footnote 41
The second variable is the respondents' attitudes toward redistribution. Our variable redistribution takes a value of 1 if a respondent answers “agree” or “somewhat agree” to the following question: “What is your opinion about a policy to enhance the redistribution of wealth from the rich to the poor using taxation and the social insurance system?” farm-to-table is equal to 2 when respondents have used a “farm-to-table” service to buy food directly from farmers several times in the past year, 1 when they have used the service once or twice, and 0 otherwise. We also tested a popularly believed argument that consumers support agricultural protectionism because their family members are engaged in farming. social network takes a value of 1 if a respondent has a family member or relatives who engage in farming, including part-time farming, and 0 otherwise.Footnote 42
Projection
The second hypothesis we test is that citizens might support agricultural protectionism because they project their own job insecurities onto a symbolic and declining industry, agriculture. Projection is a concept developed in social psychology to understand how people make inferences about others using their own mental states as a benchmark.Footnote 43 Ames develops “projection” and “stereotypes” as two strategies people use to infer what others want.Footnote 44 With lab experiments, he demonstrates that when the perceived similarity between self (that is, a perceiver) and others (that is, a target) is high, respondents are more likely to use projection as a tool to infer others' preferences. On the other hand, when the perceived similarity between self and others is low, respondents are more likely to use stereotypes as a mechanism of inference.
In the context of our research, this means that when the level of respondents' perceived similarity with farmers is high, respondents are more likely to project their own mental states (that is, need for more government assistance) onto what farmers want regarding food import (that is, protectionism). Based on conventional occupational images of farmers found in existing social surveys, we derived three potential similarities that respondents might perceive with agricultural workers: declining industry, high job insecurity (that is, difficulty finding a comparable job), and older age.Footnote 45 We expect to see respondents with high job insecurity or perceived risk of income loss in the future show higher support for agricultural protectionism after viewing the producer treatment.
To test the projection hypothesis, we constructed a variable called difficulty finding a job that takes a value of 1 if respondents choose “difficult” or “very difficult” to the following question, and 0 otherwise: “If you were to quit your current job, do you believe it would be difficult to find a similar job that pays a comparable salary?” Likewise, older respondents face a higher risk of income loss due to approaching retirement or increasing difficulty in finding their next job. Also, the average age of agricultural workers in Japan is 57.6 for all farmers and 64.6 for farmers whose main source of income is farming.Footnote 46 age over 50 takes a value of 1 if a respondent's age is over fifty years, and 0 otherwise. We trichotomized job status as three dummy variables: fully employed for full-time employees, temp for part-time and temporary employees, and no jobs for the unemployed and those not in the labor force.Footnote 47 We expect temp to increase in opposition to food imports when people in this category view the producer treatment.
Introducing Subgroup Heterogeneity
We conducted two sets of analysis. The first was subgroup analyses, in which (1) we compared the proportion of protectionist responses across the three experimental groups for a given subset of respondents, and (2) conducted difference-in-means tests between the treatment and the control groups. If all the key co-variates are categorical and balanced across the three experimental groups, the subgroup analysis should suffice to test our hypotheses. To supplement the subgroup analysis, the second set of analysis pooled all the data across the treatment and control groups and estimated the treatment effects by interacting the treatment group dummy for each experiment group (0–1) with co-variates for the two hypotheses (sympathy and projection).Footnote 48 The model, estimated by ordered and binomial probit, has the following structure, where i is individual respondent, Producer Treatment (pt) is a dummy variable (1 for producer priming, and 0 otherwise), and Consumer Treatment (ct) is a dummy variable (1 for consumer priming, and 0 otherwise):

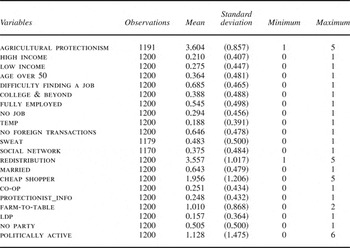
Table 2 summarizes descriptive statistics for variables used in our analysis and the Appendix discusses control variables included in the probit analyses.
Descriptive statistics

Results: Sympathy and Projection
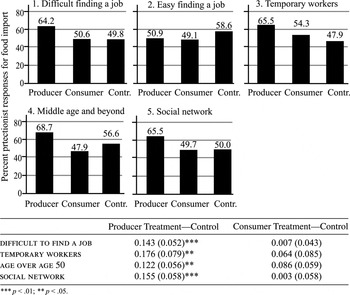
Figure 3 shows the results of the subgroup analysis. Overall, the results lend strong support to the projection hypothesis and weak support for the sympathy hypothesis. Among respondents who report that finding a comparable job is “difficult” or “very difficult,” the producer priming increases their support for agricultural protectionism by 14.4 percentage points from 49.8 percent in the control group to 64.2 percent. Disaggregating further, subgroups of respondents with high job insecurity during the current crisis, such as temporary workers and respondents over age fifty, become more protectionist when they view the producer treatment. The magnitude of this effect is substantial, a 17.6 percentage point increase for temporary workers and a 12.1 percentage point increase for respondents older than fifty. These differences from the control groups are statistically significant at the 5 percent level as shown in Figure 3.
Projection and sympathy hypotheses: Substantive impact of difficulty finding a comparable job and social network on % protectionist responses
Note: The x-axis shows the three experimental groups. The bars and numbers above indicate the proportion (%) of protectionist responses (increasing food import is “bad” or “very bad”) for each group. Table summarizes the results for difference-in-means tests. The numbers in left column indicate the percentage point difference of protectionist responses (0 < x < 1) between producer treatment and the control groups for each subgroup. The numbers in right column indicate the percentage point difference between consumer treatment and the control group. The standard error of estimate is in parentheses. Numbers in figures and table do not perfectly match due to rounding.

The power of producer priming in mobilizing a protectionist “coalition of losers” is also evident when comparing the benchmark levels of protectionism observed in the control groups. Perhaps due to price sensitivity, respondents with high job insecurity showed a lower level of support for protectionism (49.8 percent) than those with low job insecurity (58.6 percent). Yet, this pattern reversed when they viewed the producer treatment: respondents with high job insecurity became more protectionist (64.2 percent) than those with low job insecurity (50.9 percent).Footnote 49
By contrast, the sympathy hypothesis finds only partial support. Respondents with family or relatives engaging in farming show a 15.5 percentage point higher support for agricultural protectionism after viewing the producer treatment and this difference is significant at the 1 percent level. However, neither producer nor consumer treatment affected other subgroups of respondents for the sympathy hypothesis, such as sweat, farm-to-table, and redistribution.
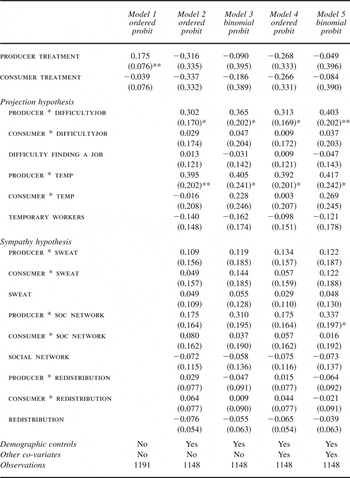
Table 3 summarizes the results of an ordered probit and binomial probit analysis. A positive coefficient on an interaction variable indicates that with producer or consumer priming, a given subgroup's support for agricultural protectionism increases. Negative coefficients indicate that, again, interacting with the producer or consumer priming, a given subgroup's support for protectionism decreases. Model 1 estimates the effect of treatments on only the aggregate level of support for protectionism and Models 2 to 5 introduce subgroup heterogeneity to test the two hypotheses.
Individual support for agricultural protectionism

Notes: Standard errors are in parentheses. Models 2 and 4 use a 5-point scale (very good, good, neutral, etc.) as the dependent variable and estimates it with an ordered probit, while Models 3 and 5 dichotomize the 5-point scale to 1 (food import is “bad” or “very bad”) or 0 otherwise and estimates it with a binomial probit. Demographic controls include female, college, low income, high income, and age over 50. Other co-variates are discussed in the Appendix. Cut points are not shown.
** p < .05;
* p < .10.
The results again lend support to the projection hypothesis and weak support for the sympathy hypothesis. Respondents with high job insecurity (difficulty finding a job) and temporary workers (temp) become more protectionist when they view the producer-priming treatment. This result is robust across the four models (Models 2 to 5). Only in Model 5 with dichotomized support for protectionism (0–1), with producer priming, do respondents with a family member or relatives engaging in farming (social network) show higher support for agricultural protectionism than a control group. In summary, consumers with high job insecurity paradoxically align with farmers to support the high price of agricultural products even though such consumers should be the prime beneficiaries of cheaper food imports.
Control variables find very weak support for Stolper-Samuelson or Ricardo-Viner trade theorems. Income (low and high income) has no systematic effects on respondents' attitudes toward food import.Footnote 50 College degrees turn out to have no systematic effects. Respondents whose company or sector of employment does not export, import, or outsource production abroad, are more protectionist. Those who are not employed (no jobs) have lower support for protectionism, which is consistent with our expectation that respondents who think primarily as consumers prefer lower prices.
Respondents with children are more supportive of food import. This is probably driven by the price sensitivity. Married respondents are more protectionist, controlling for income and whether they have children or not. The finding is consistent with Goldstein, Margalit, and Rivers who argue that married respondents are more protectionist.Footnote 51 Co-op members are more protectionist. This finding suggests that the “coalition of losers” between consumers and farmers that we found at the individual level might also exist at the level of organized interest groups.
The political mobilization argument also finds little support. Japan's Liberal Democratic Party (LDP) supporters are no more protectionist than other party supporters. This is contrary to the conventional wisdom that the LDP is pro-farmer, but the finding is in fact consistent with the results of our Lower House legislator survey that LDP politicians are more supportive of globalization and food imports than politicians from its major opposition party, the Democratic Party of Japan (DPJ).Footnote 52 Respondents' level of exposure to elites' protectionist discourse (protectionist_info) and their political activeness (politically active) turn out to have no systematic effects, either.
Conclusion
Persistent and high public support for agricultural protectionism in developed economies poses a puzzle for occupational and ideological approaches to studying trade policy preferences. These approaches fall short because they do not consider how citizens form preferences over trade policy for other sectors in the economy. What complicates this endeavor further is a duality of interests that citizens have as producers and consumers. Such neglect warrants further study, since trade policy is a powerful tool by which governments redistribute wealth among citizens with diverse occupational and consumption profiles. This article has sought to push this important research agenda forward in three ways.
First, observational studies face a challenge in identifying whether citizens form their opinions about protecting other economic sectors from the point of view of producers or consumers. With a randomized priming-without-framing survey experiment, we were able to disentangle occupational and consumption-related sources of individual attitudes toward food import. Our projection finding forces us to reconsider standard theories of trade policy preferences that are based on individuals' occupational interests in the international economy.
Second, our projection finding may serve as an important step toward understanding how a coalition of diverse interests emerges in the politics of globalization and redistribution—a missing link between individual preferences and coalitional politics in international political economy. The mechanism of projection gives rise to a new “coalition of losers” between producers and consumers that sustains protection for uncompetitive sectors. This finding will advance the long-standing research on coalition politics in the global economy that mostly predicts class or sectoral alliances such as “the marriage of iron and rye” during Bismarck Germany (1871–1914) where the government protected both landowners and capitalists at the expense of workers (consumers) by politically sustaining the high price of grains.Footnote 53
Third, we have demonstrated that citizens' attitudes toward globalization and trade can differ dramatically depending on which aspect of their lives (work versus home and social lives) is activated from their multifaceted and often conflicting attributes. Like other studies on the role of framing and information in the formation of public opinion, this finding implies the importance of elites in mobilizing the public. More specifically, our finding suggests that even subtle manipulation to draw citizens' attention to one aspect of their lives can substantially change the landscape of coalitions in the global economy.
A promising line of future research, thus, is to investigate how elites—legislators, bureaucrats, and media—seek to activate the job-versus-consumption-related interests of voters and which groups of voters are susceptible to such elite priming. The general election of 2009 in Japan might provide an opportunity to explore this question as the major opposition party, the DPJ, extensively campaigned to appeal to consumers and improve their quality of lives (“seikatsu” and “kurashi”) and won a landslide victory over the long-standing governing party LDP, which focused its campaigns on “creating jobs.”
Another promising line of research is to explore the external validity of our projection finding by bringing this experiment to racially and ethnically diverse societies such as the United States or India. Along the line of observational studies on racial diversity and income redistribution in U.S. cities by Alesina and colleagues, we expect that the projection mechanism is prevalent in more homogenous societies (for example, Japan) than heterogeneous societies (the United States and India).Footnote 54 Another possible line of research is to test the “income threshold” of our projection hypothesis by bringing this research to developing economies with a comparative advantage in agriculture.
Appendix
Building on the existing work on individual attitudes toward globalization and food import, we include the following co-variates for Models 4 and 5 of Table 3.
low income: a respondent in the bottom 30 percent of the individual income distribution.
high income: a respondent in the top 30 percent of the individual income distribution.
mid income: the base category.
college: equals 1 for respondents who graduated from college or above, and 0 otherwise.
female: equals 1 for women, and 0 otherwise.
have kids: a dummy variable, 1 for respondents with children, and 0 otherwise.
housewives: a dummy variable, 1 for housewives, and 0 otherwise.
co-op: a dummy variable, 1 for a member of a consumer cooperative, and 0 otherwise.
ldp and non-partyid: indicate respondents' party identification with then-incumbent Liberal Democratic Party or nonpartisan identification, respectively.
politically active: an index of political participation that ranges from 0 to 6. This is the sum of the answers (0, not at all; 1, once or twice; 2, several times) to three questions about the frequency of political participation in the past: whether a respondent has been a member of a local candidate-support group (koenkai), whether a respondent has helped a candidate run for an election, and whether a respondent has listened to politicians' speeches on the street.
We also include the following novel co-variates.
protectionist_info: takes a value of 1 if a respondent heard and spoke about all of the following four protectionist terms, and 0 otherwise: “poisoned Chinese dumpling incident (chugoku doku gyoza jiken),” “food education (shokuiku),” “food sufficiency ratio (syokuryo jikyuritsu),” and “locally grown, locally consumed (chisan chisho).”Footnote 55 Politicians and the media extensively use these four terms to either raise the barrier to trade or promote domestic production and consumption of agricultural products.Footnote 56 protectionist_info directly measures respondents' levels of exposure to elites' protectionist discourse on trade policy, rather than proxying it with education.
no foreign transaction: takes a value of 1 when the company with which the respondent is employed or the business run by the respondent does not import, export, or outsource its production activities abroad, and 0 otherwise. no foreign transaction remedies the criticism that the conventionally used ILO occupational classification is not an accurate approximation of skill-level or export versus import-orientation. The self-reported position of a respondent's job provides better data on how citizens perceive their jobs' position in the global economy.Footnote 57
cheap shopper: an index of the number of items a respondent owns from our list of discount stores and ranges from 0 to 5.Footnote 58 cheap shopper captures consumer attributes of the respondents that are generally missing in standard public opinion surveys.