Binary Classifiers and ROC Curves
A binary classifier is a diagnostic test, prediction model, or decision rule that assigns each individual to one of two categories, such as disease versus no disease, high- versus low-risk, or treatment versus no treatment. Binary classifiers are common in medicine because many clinical decisions ultimately require a yes-or-no classification, even when the underlying measurement or predicted risk is continuous. To illustrate their evaluation, consider a hypothetical study of 200 participants examining whether the genomic expression level of an enzyme can identify susceptibility to symptomatic COVID-19: 100 participants subsequently develop symptomatic infection and 100 do not. Enzyme expression is measured from 0 to 100, with higher values tending to occur among affected participants. Figure 1 shows a simulated individual-level dataset constructed for this example; the overlap between groups makes clear that no cutoff separates them perfectly. All values are hypothetical and do not represent observed COVID-19 data.
Simulated Enzyme-Expression Levels for 100 Affected and 100 Non-Affected Participants.
Note: Each point represents one participant; dashed lines indicate illustrative cutoffs. Values are hypothetical.

A receiver operating characteristic (ROC) curve describes the performance of a diagnostic test or classifier across a range of possible decision thresholds. For each possible threshold, the curve plots the sensitivity (true-positive rate) against one − specificity (false-positive rate). The area under the receiver operating characteristic curve (AUROC) summarizes this curve as a single value between zero and one. An AUROC of 0.50 indicates discrimination no better than chance, whereas an AUROC of 1.00 indicates perfect discrimination. The AUROC can also be interpreted as the probability that, when one individual with the outcome and one without the outcome are selected at random, the classifier will assign a higher predicted score to the individual with the outcome. Importantly, the AUROC summarizes discrimination across all possible thresholds; it does not describe how the classifier will perform at the particular threshold ultimately chosen for clinical or operational use.Reference Foroutan, Weiss and Mayer1,Reference Chang and Newman2
Thresholds and Practical Performance
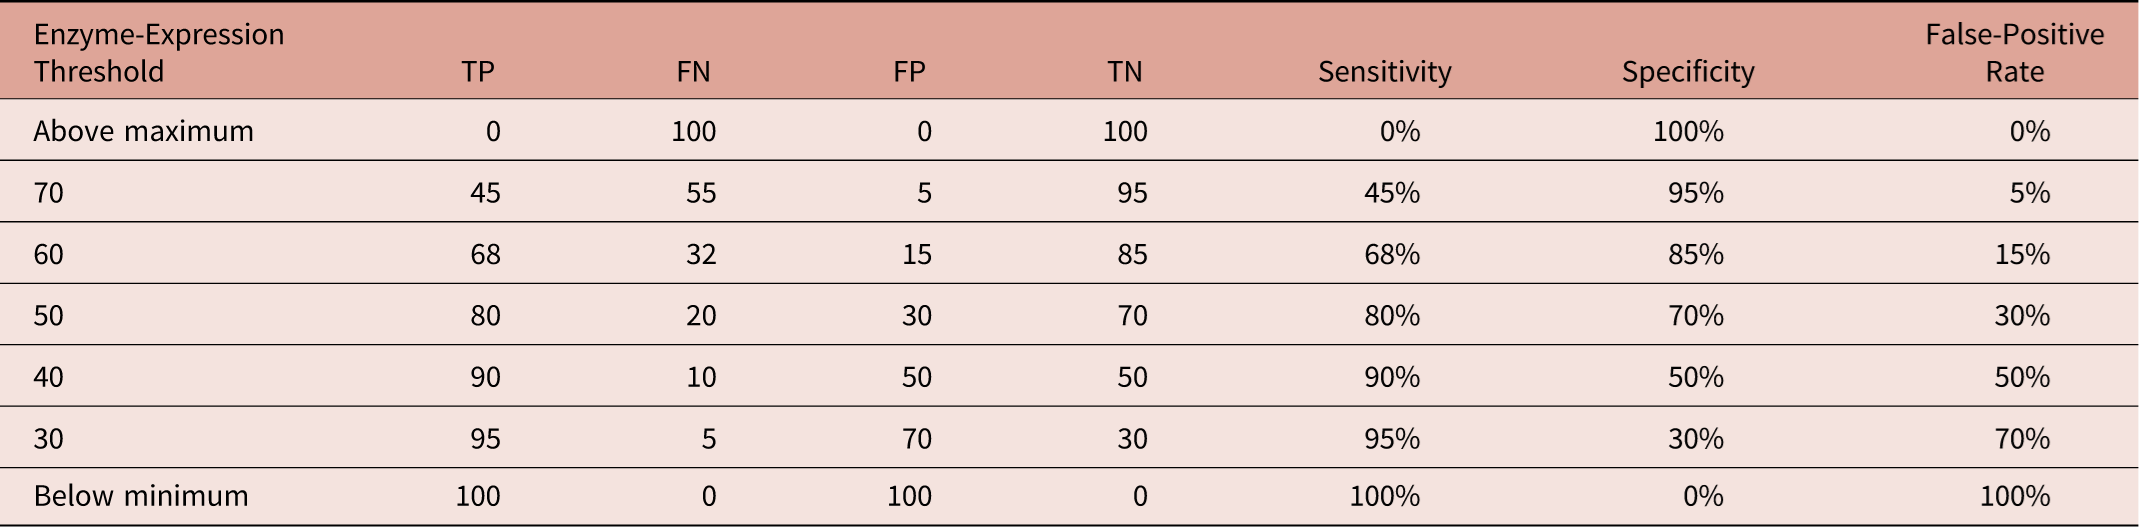
In the example, the investigators can choose many possible thresholds for defining a “positive” test. Table 1 shows that at a threshold of 30, the test might have a sensitivity of 95% but a specificity of only 30%; at 50, sensitivity might be 80% and specificity 70%; and at 70, sensitivity might fall to 45% while specificity rises to 95%. Plotting sensitivity against one − specificity for every possible threshold produces the ROC curve in Figure 2. Suppose the resulting AUROC is 0.82. This indicates reasonably good overall discrimination, but it does not tell us which threshold should be used or how useful the test will be in practice. A threshold of 30, 50, or 70 would produce substantially different numbers of false-positive and false-negative classifications despite all being represented by exactly the same AUROC of 0.82. The clinically appropriate threshold therefore depends on the intended use of the test and the relative consequences of false-positive and false-negative results.
Hypothetical Classification Results Underlying the Schematic ROC Curve

Table 1. Long description
The table has eight rows and eight columns. The columns are labeled Enzyme-Expression Threshold, TP, FN, FP, TN, Sensitivity, Specificity, and False-Positive Rate. The rows are labeled with different enzyme-expression thresholds: Above maximum, 70, 60, 50, 40, 30, and Below minimum. Each row provides values for TP, FN, FP, TN, Sensitivity, Specificity, and False-Positive Rate corresponding to the enzyme-expression threshold. For example, at a threshold of 70, TP is 45, FN is 55, FP is 5, TN is 95, Sensitivity is 45 percent, Specificity is 95 percent, and False-Positive Rate is 5 percent.
Note: Values are schematic and are not observed COVID-19 data.
Abbreviations: TP, true positive; FN, false negative; FP, false positive; TN, true negative; ROC, Receiver Operating Characteristic.
Schematic Receiver Operating Characteristic (ROC) Curve for the Hypothetical Genomic Enzyme Example.
Note: The diagonal denotes chance performance; orange points mark illustrative thresholds.

What AUROC Measures
The AUROC is therefore a measure of discrimination across all possible classification thresholds. Although useful for describing a model’s overall ability to distinguish between individuals with and without an outcome, the AUROC does not by itself establish the performance or practical utility of a binary classifier. Importantly, the AUROC measures discrimination and should not be interpreted as a measure of calibration or clinical utility.Reference Foroutan, Weiss and Mayer1,Reference Chang and Newman2
Any classifier that produces a continuous score can generate a ROC curve and an associated AUROC. In practice, however, the classifier must ultimately operate at one or more specified thresholds. Its performance at those thresholds—not its average discrimination across thresholds that may never be used—determines its practical value. The clinical usefulness associated with a given AUROC depends on factors including the prevalence or incidence of the outcome and the decision threshold at which the classifier will be used. Even a classifier with a relatively high AUROC may have limited practical utility at the relevant decision threshold, while a classifier with a more modest AUROC may be useful under different circumstances.Reference Foroutan, Weiss and Mayer1,Reference Chang and Newman2 Consequently, an AUROC alone is generally insufficient as the primary assessment of the performance or utility of a binary classifier.
Selecting a Decision Threshold
Threshold selection should be clearly described and justified. Authors should state whether the threshold was pre-specified based on clinical or operational considerations or was derived empirically from the study data. If a data-driven method was used, the method and rationale should be reported. The choice of threshold should reflect the intended application, the prevalence or pretest probability of the outcome, and the relative consequences of false-positive and false-negative classifications rather than simply maximizing a statistical measure.Reference Foroutan, Weiss and Mayer1,Reference Chang and Newman2
One common data-driven method to choose a decision threshold is to maximize Youden’s index. For a candidate threshold c, Youden’s index is defined as J(c) = sensitivity(c) + specificity(c) − 1, and the Youden-optimal threshold is the value of c that maximizes J(c).Reference Youden3 The method is simple, combines sensitivity and specificity in a single measure, and does not depend directly on outcome prevalence. It can therefore provide a useful statistical starting point when false-positive and false-negative errors are considered equally important.
Although Youden’s index maximizes combined sensitivity and specificity, it does not account for the clinical consequences of false-positive and false-negative errors. In the hypothetical genomic enzyme derivation dataset, the authors could calculate Youden’s index for each candidate threshold. At thresholds of 70, 60, 50, 40, and 30, the values of J in this example would be 0.40, 0.53, 0.50, 0.40, and 0.25, respectively. Threshold 60 would therefore be selected because it has the largest Youden’s index (sensitivity 68%, specificity 85%; J = 0.53). Choosing threshold 60, however, means that the expected sensitivity is only 68%, so approximately 32% of susceptible individuals would be missed in the derivation data. Depending on the clinical purpose of the test and the consequences of a false-negative result, that sensitivity may be inadequate. If the authors determine in advance that the intended application requires sensitivity of at least 90%, they might instead choose a lower cutoff such as 35. In the underlying continuous data, that cutoff could be selected as the value that meets the pre-specified sensitivity requirement while retaining as much specificity as possible. The authors would then need to accept and report the corresponding reduction in specificity and increase in false-positive results. This threshold-selection procedure and the resulting cutoff should be reported as part of model derivation, and its sensitivity and specificity should then be estimated in separate validation data. Importantly, maximizing Youden’s index is not necessarily clinically optimal: it does not incorporate outcome prevalence, the consequences of missed cases versus false alarms, or the intended use of the classifier. If those considerations favor cutoff 35 rather than the Youden cutoff of 60, the authors should explain that rationale rather than describe cutoff 35 as statistically “optimal.”
Separating Derivation and Validation
Importantly, derivation and validation are separate processes. Data used to select or optimize a classification threshold are derivation data. Performance calculated using those same observations is likely to be optimistic because the threshold has been selected specifically to perform well in that dataset. Ideally, a threshold should be pre-specified or derived in a development dataset and subsequently evaluated in an independent validation dataset. When an independent validation dataset is not available, authors should use and describe an appropriate internal validation approach and acknowledge the limitations of estimating performance from the same data used for model or threshold development.
Reporting Validation Performance
For the validation analysis, authors should report the performance of the classifier at the pre-specified or derived threshold(s). These estimates should be obtained from a validation dataset that was not used to derive the classifier or select its threshold. At a minimum, this should generally include sensitivity and specificity with 95% confidence intervals (CI) and a table showing the numbers of true positives, false positives, true negatives, and false negatives. Depending on the intended application, positive and negative predictive values, likelihood ratios, and other measures of performance may also be appropriate. Where the purpose of the classifier is to guide a clinical or operational decision, consideration should also be given to measures that directly evaluate consequences or net benefit at the intended decision threshold.Reference Foroutan, Weiss and Mayer1
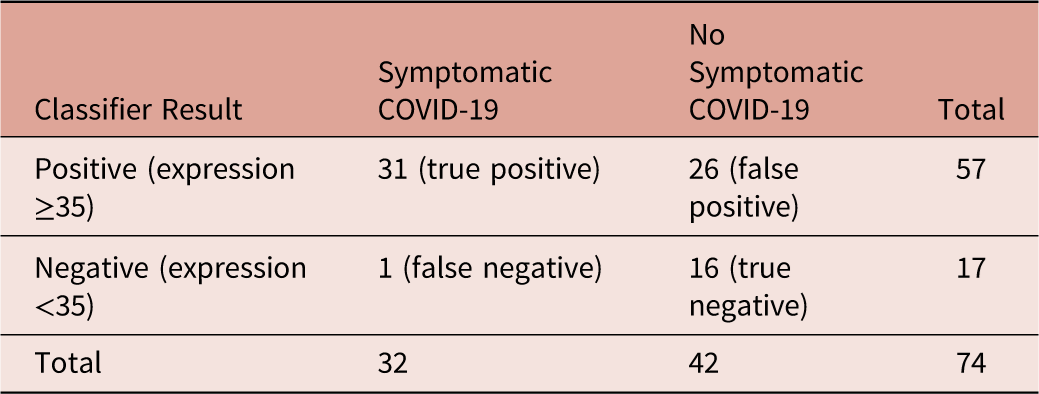
For instance, following derivation of the hypothetical COVID-19 genomic classifier, the authors might select an enzyme-expression level of 35 as the operating cutoff and then evaluate that fixed cutoff in a separate validation cohort. In a reproducible simulated dataset of 74 patients (random-number seed 35074), 32 patients developed symptomatic COVID-19 and 42 did not. Applying the cutoff without further optimization classified 31 of the 32 patients with the outcome as positive and 16 of the 42 patients without the outcome as negative. The resulting sensitivity was 96.9% (31/32; 95% CI, 84.3%–99.4%) and the specificity was 38.1% (16/42; 95% CI, 25.0%–53.2%). Confidence intervals were calculated using the Wilson score method. Although the point estimate for sensitivity exceeded the pre-specified 90% requirement, the lower limit of the 95% confidence interval was 84.3%. The validation cohort therefore did not establish with 95% confidence that the classifier’s true sensitivity met the 90% requirement. Thus, the cutoff identified nearly all patients who developed symptomatic COVID-19 but also produced 26 false-positive classifications. This independent validation result illustrates why performance at the selected cutoff may be more informative for practical use than the AUROC alone.
The confusion matrix is an excellent way to present validation data transparently as a table. It allows readers to see the overall performance of a classifier quickly and to calculate common measures of accuracy. A confusion matrix is a cross-tabulation of a classifier’s predicted categories against the observed outcome categories at a specified cutoff. Its four cells contain the numbers of true positives, false positives, true negatives, and false negatives, making the direction and frequency of classification errors visible and providing the counts from which sensitivity, specificity, predictive values, and other performance measures can be calculated.Reference Tharwat4 Table 2 presents the complete confusion matrix for the hypothetical validation cohort at cutoff 35.
Confusion Matrix for the Hypothetical 74-Patient Validation Cohort at Cutoff 35

Table 2. Long description
A table titled ‘Confusion Matrix for the Hypothetical 74-Patient Validation Cohort at Cutoff 35’ with four rows and four columns. The table compares classifier results for symptomatic and no symptomatic COVID-19 cases. The columns are labeled ‘Classifier Result’, ‘Symptomatic COVID-19’, ‘No Symptomatic COVID-19’, and ‘Total’. The rows are labeled ‘Positive (expression ≥35)’ and ‘Negative (expression <35)’. Row 1: Positive (expression ≥35), Symptomatic COVID-19, 31 (true positive); No Symptomatic COVID-19, 26 (false positive); Total, 57. Row 2: Negative (expression <35), Symptomatic COVID-19, 1 (false negative); No Symptomatic COVID-19, 16 (true negative); Total, 17.
Note: Sensitivity = 31/(31 + 1) = 96.9% (95% CI, 84.3%–99.4%); specificity = 16/(16 + 26) = 38.1% (95% CI, 25.0%–53.2%). Confidence intervals use the Wilson score method. Data were generated solely for this hypothetical example.
P Values and Precision
P-values associated with the AUROC should generally receive limited emphasis. A commonly reported hypothesis test evaluates whether the AUROC differs statistically from 0.50. This tests whether the classifier discriminates better than chance, which is usually a relatively weak and clinically uninformative benchmark. With a sufficiently large sample, even a small and practically unimportant departure from an AUROC of 0.50 may be statistically significant. Conversely, failure to achieve statistical significance in a small study does not establish the absence of potentially useful discrimination. Authors should therefore emphasize the magnitude and precision of the AUROC, including its 95% confidence interval, rather than whether its associated P-value crosses an arbitrary significance threshold. When comparing AUROCs between models, a P-value for the difference may be appropriate, but the magnitude and confidence interval of that difference—and whether it represents a meaningful improvement in performance—are generally more informative than statistical significance alone.
Conclusion
In summary, the AUROC may be reported as a secondary measure of overall discrimination, but it should not generally serve as the sole measure of classifier performance or practical utility. The primary evaluation should focus on performance at clinically or operationally meaningful decision thresholds, with a clear distinction between the data and methods used to derive those thresholds and those used to validate their performance. Reporting should generally include sensitivity and specificity with 95% confidence intervals and the complete confusion matrix, from a validation dataset.
Author Contributions
The authors are responsible for all content.
Competing Interests
JMF is the CEO and founder of STAT59 and the Editor-in-Chief of Prehospital and Disaster Medicine.
Ethical Approval
Non-human subject research.
Use of AI Technology
OpenAI Codex (GPT-5; OpenAI; San Francisco, California USA), a large language model, was used to assist with drafting, editing, figure generation, and document formatting. JMF reviewed and approved all content and assumes full responsibility for the accuracy, integrity, and final form of the manuscript.