

Recent quantitative studies of civil wars have questioned the impact of ethnic grievances on the onset of civil wars. As with so many other findings in the political-economy literature, however, this “nonresult” is based on highly aggregated proxies.Footnote 1 In most cases, country-level indicators, such as gross domestic product (GDP) per capita or ethnic fractionalization indices, do not allow us to distinguish one explanation from another and are rarely supported by evidence at lower levels of aggregation.Footnote 2 Indeed, the debate over the role of ethnicity in internal conflict is far from resolved.
As a way to overcome these shortcomings in the literature, this article disaggregates civil wars to the level of dyads pitting states against their ethno-nationalist challengers. This approach enables explicit empirical evaluation of actor-centered theories that expect violence to erupt where strong peripheral actors are excluded from state power. Thus, in this study, we do not ask whether ethnic power struggles generate violent conflict, but how.
Focusing specifically on dyadic ethno-nationalist conflicts, our analysis enables us to measure the center-periphery power distribution in terms of demographic and geographic variables. This is an important contribution to the literature, because unlike interstate warfare, civil wars do not lend themselves to straightforward measurement of power balances. In order to compute the logistical variables and population estimates, we make extensive and innovative use of geographic information systems (GIS).Footnote 3
Our findings suggest that the dyadic power balance, measured as the peripheral group's demographic size compared to the center, is indeed a strong predictor of ethno-nationalist conflict. We also find evidence supporting the hypothesis that dyads with groups far from the capital and those located in rough terrain are more likely to experience conflict. Standard measures of wealth—measured at the national level—appear to be at best only weakly related to ethnic conflict at the dyadic level of analysis.
Postulating Dyadic Conflict Mechanisms
We propose a group-based model of ethno-nationalist conflict that is based on a star-shaped actor constellation and on corresponding conflict mechanisms connecting the state's governmental center with its periphery.Footnote 4 Drawing directly on Wimmer's exclusion theory, we interpret ethno-nationalist conflict as the consequence of one particular path of nation-state formation.Footnote 5 It occurs where the elites of nationalizing states were not resourceful enough to include and integrate the vast majority of the population into the imagined community of the nation. Especially in societies where no networks of civil society organizations were available, they relied on ethnic clientelism to mobilize a political following, thus excluding ethnic others from access to power and public goods.
Whereas nation-building in strong and resourceful states with well-developed civil societies incorporated large parts of the population, sometimes with the help of widespread ethnic cleansing, the situation in weaker states, mostly in the previously colonized parts of the world, was quite different. Exclusion along ethnic lines often led to political mobilization by counterelites, which denounced their underrepresentation at the center of power and demanded inclusion (for example, the African National Congress in South Africa), or the creation of a separate state in which their own ethnic group would represent the dominant nation (for example, the Bengalis of former East Pakistan, now Bangladesh).
If this exclusion perspective is correct, we would expect powerful ethnic groups excluded from power to be most likely to mobilize around an ethno-nationalist program and to initiate conflict against the government, and conversely, the government to engage in repression to curb the power of such threatening contenders. Thus, we postulate that collective ethno-nationalist action requires both opportunities and willingness to challenge central state power.Footnote 6 Accordingly, civil wars occur when peripheral contenders to the government are powerful enough to challenge the center and sufficiently motivated to do so.Footnote 7 In the following, we elaborate on how the proposed mechanisms are constituted and how they can be measured.
For operational reasons, and without any claim to completeness, we focus on two crucial aspects of ethnic center-periphery relationships that we expect to systematically influence both the peripheral group's opportunities and willingness to rebel: (1) the demographic balance between the government and the peripheral ethnic group, and (2) the ethno-geographic constellation—especially with respect to the distance between the capital and the peripheral group—and the roughness of the terrain within the group's settlement area.
Other things being equal, we expect that larger groups will be able to stage successful collective action thanks to their superior numbers. While the former aspect of the hypothesis can be justified both in terms of resource mobilization, the latter one hinges on legitimacy.Footnote 8 We would expect the frustrations of being excluded and, correspondingly, motivations to engage in rebellious collective action to increase with the size of the excluded population.Footnote 9 This reasoning can be summarized as follows:
H1:
The probability of conflict increases with the relative demographic size of the excluded group.
However, the size-related hypothesis needs to be complemented, because in large states with difficult terrain, even relatively small groups may be able to wage surprisingly effective campaigns against powerful political centers, as the insurgencies in Aceh and Chechnya have demonstrated. On average, then, we would expect the prospects of peripheral challenges to the central government to be the most successful in the cases where the latter's reach is least developed. This logic yields two straightforward hypotheses:
H2a:
The probability of conflict increases with the distance between the excluded group and the capital.
H2b:
The probability of conflict increases with the roughness of the terrain within the settlement area of the excluded group.
We argue that remoteness in these two senses supports excluded groups' efforts to challenge the center's power both in terms of opportunities and willingness to stage insurgencies. The former argument is directly related to the geographic reach of state power, as suggested by Boulding's notion of the “loss-of-strength gradient” (LSG).Footnote 10 This notion postulates a declining function of projected power over distance, often expressed as exponential decay.Footnote 11 In addition to this materialist mechanism, it can be expected that the cultural penetration of the center declines with distance and geographic obstacles.Footnote 12
Operationalizing Ethno-Nationalist Dyads
As we argue above, the most obvious way of evaluating the exclusion perspective is to model it as a center-periphery dyad. By measuring ethnic dyads directly and introducing an explicitly geographic dimension, the current study provides a fine-grained picture of the mechanisms driving ethno-nationalist wars. Our goal is to study conflict between ethnically defined state authorities, that is, the “ethnic group(s) in power” and their challengers.Footnote 13 To succeed in our endeavor, we need information on
1. The identity and location of ethnic groups.
2. Demographic group sizes.
3. Ethnic group(s) in power.
4. Geo-coded data on distances and terrain.
5. Ethnic dyadic conflicts.
In the following, we describe our data-collection efforts before turning to a presentation of the results in the subsequent section.
Geocoding Ethnic Groups
To our knowledge, there is no ready-to-use data set that systematically pins down the location of ethnic groups in a large number of comparable cases. To create such a data set, we chose to focus on the well-known Atlas Narodov Mira (ANM).Footnote 14 The ANM stems from a major project of charting ethnic groups undertaken by Soviet ethnographers in the early 1960s. Their efforts bore fruit in the extensive but still untranslated atlas, containing fifty-seven ethno-geographic maps at various scales that jointly cover all inhabited parts of the world.
The ANM has several strengths: it is complete and carefully researched, it relies on a consistent classification of ethnicity, it offers a uniform group list that is valid across state borders, and it provides high-quality maps. Among its weaknesses, it should be stressed that the ANM adopts an ethno-geographic rather than a political perspective, and is based on data available in the 1960s. In most cases, however, ethnic settlement patterns exhibit considerable inertia, so it seems reasonable to use this data set as a starting point.
In order to make the data of the ANM available for statistical analysis, a number of preparatory steps had to be conducted. First, all of the ANM maps had to be converted to a digital format through scanning. Then, the scanned maps were geo-referenced, meaning that they were linked to a particular coordinate system specifying locations on the earth's surface. Once referenced, group polygons were replicated from a computer screen displaying the geo-referenced scanned map using the mouse as digitizing cursor. Finally, all legends and group names were translated from Russian into English and entered into the data set's attribute table with links to the corresponding group polygons. The resulting data set, the Geo-Referencing of Ethnic Groups (GREG), contains information on the geographical location of more than 1,600 ethnic groups identified in the ANM allowing computation of spatial measurements such as area and distance.Footnote 15
Estimating Group Sizes as Share of State Populations
Having determined the geographic location of all ethnic groups, our next task was to construct a suitable measure of the power balance in the center-periphery dyads. Because it is difficult to find direct indicators of group strength in such settings, we decided to use demographic estimates of group size. One possible source of such information would be the ANM. In addition to the map material, the ANM contains group-size estimates, which have often served as a basis for the calculation of ELF values.Footnote 16 However, these statistics may not be ideal for our purpose because a number of states did not exist at the time of publication, such as the post-Soviet republics of Russia, Ukraine, Belarus, and others. How could one derive population statistics of ethnic groups in these states based on the Soviet data?
Fortunately, GIS provides a convenient solution to this dilemma by enabling complex computational operations involving several spatially arranged data layers. Assuming the ethnic map to be constant, we used a spatial estimation method based on an intersection of territorial country masks, the group polygons, and population density maps. Using the boundaries in a country layer (shapefile) representing the post–Cold War period as “cookie cutters,” we singled out the group polygons (or parts thereof) that fell within the borders of each state. We then intersected the ethnic group layer with a gridded population density layer from Columbia University.Footnote 17 This allowed us to measure the size of the population that fell within a given ethnic group's “state-cropped” polygon(s). In cases of multiple groups per polygon, we divided the population figures evenly between the groups. By summarizing the population for all polygons belonging to an ethnic group and repeating this procedure for all groups we obtained population estimates for all groups in all countries in the ANM. In a further step, we divided these numbers by the total population for the corresponding country, which yielded a table of the relative population share for each ethnic group.
To limit the computational effort, we decided to generate the spatially derived population shares for two years only: 1964, the ANM's year of publication, and 1994, which captures the post–Cold War situation. We then merged the two data sets, using the estimates from 1964 for countries that existed in that year and data for 1994 for younger states. Finally, by way of validating the spatially computed data, we compared our group size estimates from 1964 to the population data provided by the ANM. This simple test indicated a high correlation, at r = 0.99. Validation of the 1994-based estimates posed more problems due to the difficulty of finding matching group data that can serve as a reference. Nevertheless, a comparison with the population statistics for the corresponding ethnic groups in Fearon's data set yielded a reasonably high correlation coefficient (r = 0.93).Footnote 18
Identifying the Ethnic Group(s) in Power
So far, our discussion has focused on groups and polygons, but this study concerns dyadic dynamics. The notion of “ethnic group(s) in power” (EGIP) that we introduced earlier provides the crucial piece of information that makes this conceptual step possible. In our empirical analysis, we follow Cederman and Girardin in considering a group, or a coalition of groups, to be in power if their leaders serve (at least intermittently) in senior governmental positions, especially within the cabinet.Footnote 19 Thus we focus on ethnic groups' influence over the executive at the national level rather than on their legislative or local power. In addition to the ethnic background of senior cabinet members, specific institutional arrangements, such as different types of power sharing and consociationalism, may also be indicators of power inclusion. By power sharing, we mean any arrangement that divides the access to power among the groups making up the governing coalition. Accordingly, EGIPs can consist of more than one group. For example, we code all the four language groups of Switzerland as constituting the EGIP.
We build directly on the coding of Cederman and Girardin, who rely on Fearon's list of ethnic groups.Footnote 20 Principal sources of information for identifying the EGIPs are Gurr's Minorities at Risk (MAR) database, the CIA Factbook, and a new data set on ethnic affiliation of political leaders, collected by Goemans and colleagues.Footnote 21 Drawing on expert input from an ongoing online survey, we made an effort to improve the EGIP coding in several country cases. Wherever deemed appropriate, we introduced period-dependent EGIPs to capture major shifts in the political constellation of power access (for example, Afghanistan and Yugoslavia).
By definition, any group not coded as an EGIP is a marginalized ethnic group (MEG). We can now form center-periphery dyads as pairwise constellations of a country's EGIP and each of its MEGs. Given the enormous difficulty of identifying EGIPs in Sub-Saharan Africa, we decided to limit our empirical sample to Eurasia and North Africa, thus covering roughly half of the world's states.
Our key independent variable, r, measures the power balance between the EGIP and the marginalized group. It is operationalized as the periphery's share of the dyadic population. To illustrate, consider the Basque minority in Spain. According to our GIS-generated estimates, the Basques comprise 5.5 percent of Spain's population whereas the Spaniards, the EGIP, account for 67.7 percent. The MEG's relative power is then calculated as r = 5.5/(5.5 + 67.7) = 0.075. As one would expect, the random dyad is overwhelmingly dominated by the center (mean r score is 0.019, meaning that the MEG comprises a mere 1.9 percent of the dyadic population). Only four marginalized ethnic groups in our sample are larger than the groups in power (r > 0.5).Footnote 22 In the statistical analysis below, we apply a logarithmic transformation of the power balance to moderate a highly right-skewed distribution of values. In addition, it seems reasonable to assume that an increase in a group's relative size by one percentage point should make a much larger difference for small groups than for large ones.
Geocoding Distances and Terrain
It goes without saying that using raw demographic data as a proxy for relative power leaves much to be desired. As argued here, power decays as it is projected across distance, so politically excluded minority groups may offset some of their inferiority by residing in remote provinces and enjoying the protection of rough terrain. To account for the role of geographic mechanisms, we thus need data on the relative location of the MEGs and extent of mountainous terrain in their home regions.
The location of the ethnic groups can be readily determined by means of geo-referenced polygons. We used GIS to extract their precise mean center, in latitude and longitude coordinates. Groups belonging to the EGIP are by default coded with the capital city as their location. We then ran a script that measured the geodesic distances from each MEG's polygon centroid to the capital city (see Figure 1). For MEGs represented by two or more polygons, we generated a weighted distance measure that gives the average centroid-capital distance for all locations of the group, weighted by the population size in each polygon. The population weighting was necessary to prevent a distortion of distances due to small clusters far away from the group's core settlement area. To reduce outlier influence and to account for an expected declining effect of distance with higher values, we took the natural logarithm of the distance variable.
Geodesic distances between capitals and ethnic group center points

The second geographic proxy, which measures the extent of mountainous terrain, was computed in a manner similar to that of group populations. By intersecting gridded mountain data with the boundaries of the ethnic groups, we were able to calculate the share of the two-dimensional area of each polygon covered by mountains.Footnote 23 For groups represented by multiple polygons, we weighted the average terrain values by the area of each polygon. The area-weighted mountain variable takes on values between zero (for groups in the plains) and one (for groups settled entirely in the mountains).
Determining the Onset of Dyadic Ethnic Conflict
The final step of data generation concerns the dependent variable, namely the outbreak of dyadic ethnic conflict. We relied on the Armed Conflicts Dataset of the Uppsala Conflict Data Collection (UCDP) and the Peace Research Institute Oslo (PRIO),Footnote 24 henceforth ACD,Footnote 25 which is arguably the most established country-level data set on armed conflict. It applies a comparably low minimum casualty threshold of just twenty-five annual battle-related deaths and allows for and distinguishes between multiple simultaneous conflicts within single countries.
Our operational definition of ethnic conflict is similar to that used by Fearon and Laitin,Footnote 26 which focuses on all conflicts in which the parties are organized primarily along ethnic lines. We make no attempt to uncover whether the contested issues are truly linked to ethnicity. In order to separate out the ethnic rebellions from the total sample of intrastate conflicts in the ACD, we first identified those conflicts coded by other data sets as ethnic and dropped the ideological ones.Footnote 27 For the remaining conflicts, we conferred relevant sourcesFootnote 28 on a case-by-case basis to determine whether mobilization was based on ethnic affiliation. Finally, we identified the MEG(s) that were involved in each ethnic conflict.Footnote 29 In cases where more than one group challenged the capital at the same time, an onset of conflict was recorded in each of the corresponding dyads. Ongoing years of conflict are coded as missing. In case of a lull in the fighting or a peace agreement that lasts for at least two consecutive calendar years, the next observation of conflict in the dyad is coded as a new onset.
To facilitate comparison with country-level studies, we also generated an aggregated version of the dependent variable. Here, country-years in which there are one or more onset(s) of dyadic conflict are coded as “1” while observations without onset (including ongoing years of conflict) are coded “0.” In all, the dyadic data set contains 110 onsets of ethnic conflict among the roughly 35,000 valid dyad-years (1946–2005) while the monadic data set includes fifty-five onsets in 3,463 country-years.
In addition to our key dyadic variables as described in the sections above, the statistical analysis includes a number of country-level controls. These include Fearon and Laitin's comprehensive selection of explanatory variables (GDP per capita, log of population, log of mountainous terrain, noncontiguous territory, oil exports, new state, instability, democracy score, and ethnic and religious fractionalization), Gleditsch's logged GDP per capita,Footnote 30 Cederman and Girardin's ethnic exclusion index (N*),Footnote 31 a variable measuring annual calendar time, and controls for duration dependence. All reported models are estimated by robust logit regression, clustering the standard errors on the countries in the dyadic analysis.
Analyzing Country-Level Effects
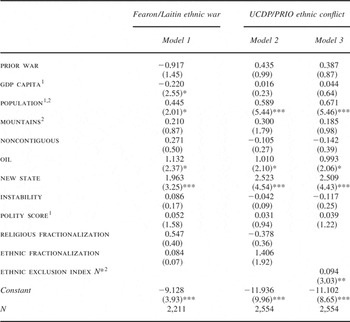
We start by testing models of ethnic conflict at the country level. As our reference point, we apply Fearon and Laitin's insurgency model to our restricted sample of Eurasia and North Africa. Model 1 in Table 1 presents the findings of this replication analysis, with Fearon and Laitin's coding of “ethnic war” regressed on their standard set of independent variables. In order to exclude countries not at risk of ethnic conflict, Model 1 is limited to country years with at least a 5 percent ethnic minority.Footnote 32
Logit analysis of onset of ethnic civil war, country level

Notes:
Model 1 includes all countries in Eurasia and North Africa with at least a 5 percent ethnic minority, 1945–99; Models 2 and 3 include all countries in Eurasia and North Africa with at least one politically marginalized ethnic group, 1946–99. Robust absolute z scores are given in parenthesis. UCDP = Uppsala Conflict Data Program. PRIO = International Peace Research Institute, Oslo. 1. Lagged one year. 2. Log-transformed.
* p < 0.05;
** p < 0.01;
*** p < 0.001.
As expected, this regression produces similar results to Fearon and Laitin's global model. Even though the replicated estimates are slightly weaker due to the reduced sample size, the variables that are significant in their model also perform well in our replication. The overall correspondence to the original findings gives little reason to suspect substantial systematic bias in the reduced spatial domain of this study.
Our next step is to replace Fearon and Laitin's ethnic wars with our country-level measure of ethnic conflict (and an accompanying “prior war” dummy), derived from the ACD (see Model 2). Given the latter data set's more comprehensive definition of conflict, which captures multiple onsets per country and numerous sporadic episodes of violence, it is not surprising that Model 2 provides somewhat different results. Most strikingly, the more inclusive dependent variable completely obliterates the effect of GDP per capita. While wealth is often widely acclaimed as an effective insurance against civil war, it does not seem to be a guarantee against less severe ethnic unrest in our sample.
A second noteworthy deviation from Model 1 is that the population estimate has increased considerably and the z score has almost tripled. This is consistent with the fact that populous countries, on average, not only contain a higher number of ethnic groups, but also tend to cover a larger geographical area, implying that some segments of the population reside at a considerable distance from the capital city. If these peripheral groups constitute marginalized ethnic minorities, the combination of cultural and geographic distance is likely to amplify their opportunities and desire for self-determination.
The dramatic increase in the impact of the ethnic fractionalization index in Model 2 also supports this logic, even if the coefficient estimate just misses the standard threshold of 95 percent level of confidence. An overwhelming majority of the ethnic conflicts in our sample are violent separatist attempts, which are generally not perceived as a direct threat to the regime as a whole and thus require less drastic countermeasures. Besides, separatist rebellion often involves guerrilla warfare, in which the rebels take advantage of rough terrain and safe havens across the border, while avoiding large-scale encounters with militarily superior governmental forces. The increased size of the estimate for mountains in Model 2 may reflect a similar byproduct of a relatively higher share of guerrilla wars in the ACD.
As a preliminary test of hypothesis (1), we conclude the country-level analysis with an evaluation of Cederman and Girardin's N* index. According to this conception, a state features an ethnic configuration making up n groups with sizes {s 0, s 1, s 2… s n−1} where s 0 denotes the size of the EGIP. Assuming that only dyadic conflict between the EGIP and the respective peripheral groups can happen, it is possible to compute the probability of civil war as

where p(i) is the probability of dyadic conflict erupting between the EGIP and the marginalized group i.
Furthermore, it is assumed that conflict happens if the power balance tips in favor of the peripheral group in question. Using relative demographic group sizes as a proxy for power, their study postulates that the probability of conflict in the dyad involving the EGIP and group i can be written as
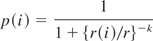
where r(i) = s i /(s i + s 0) is group i's share of the total dyadic population, r is a threshold value, and k a slope parameter.
In line with their study, we computed the index with the default settings r = 0.5 and k = 5, though our N* measure is based on the ethnic groups' population shares provided by the ANM rather than on Fearon's original group data.Footnote 33 Moreover, in our case, the N* measure is extremely right-skewed. It could thus be argued that one unit change matters less for higher values of N*, which would call for a log-transformation. In fact, the logged N* in Model 3 is both positive and highly significant, thus confirming Cederman and Girardin's original findings. Unlike their findings, our results do not hinge on a limited number of high-risk cases in the Middle East.Footnote 34
Estimating Models of Ethnic Exclusion at the Dyadic Level
Do these findings imply that hypothesis (1) should be accepted and that the exclusion perspective has thereby been definitively vindicated? We are inclined to think that such a conclusion would be premature, because all analysis thus far has been conducted at the country level whereas the causal mechanisms are located at the substate level. A dyadic analysis of ethic conflict is much better suited to uncover the true impact of ethno-nationalist exclusion.
The unit of observation in the dyadic analysis is the ethnic dyad, connecting an EGIP at the center with a marginalized ethnic group. All dyads are observed at annual intervals from 1946 or the year of independence for younger states. To control for nonindependence among dyads belonging to the same country, we specify clustered standard errors in all models. Moreover, we include a peace-years count and three natural cubic splines to handle duration dependence.Footnote 35
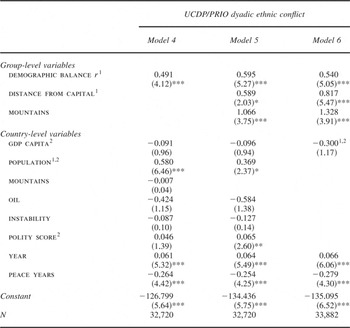
We start by considering a center-periphery model that, in addition to the logged dyadic power balance, r, includes as many independent variables as possible from Fearon and Laitin's reference model (see Model 4 in Table 2). However, we decided to drop the country-level fractionalization indices since ethnicity is measured by our proxy for relative power. We also dropped the insignificant “noncontiguous” dummy, as it carries little meaning at the dyadic level, as well as the “new state” indicator, whose influence is largely captured by the peace-years variable. Finally, due to the uneven temporal distribution of ethnic conflicts, with a relatively higher share occurring after the Cold War, we introduce a trend variable based on calendar years.
Logit analysis of onset of ethnic civil war, dyadic level

Notes:
r represents the size of the marginalized ethnic group (MEG), relative to the joint population of the MEG and the ethnic group(s) in power (EGIP). Models 4–5 cover the 1946–99 period, Model 6 covers the years from 1950–2001. Robust absolute z scores, clustered on countries, are given in parenthesis. Estimates for three natural cubic splines not shown. UCDP = Uppsala Conflict Data Collection. PRIO = International Peace Research Institute, Oslo. 1. Lagged one year. 2. Log-transformed.
* p < .05;
** p < .01;
*** p < .001.
The results are striking. As we anticipate from the exclusion perspective (hypothesis 1), the dyadic power balance has a positive and significant effect; the likelihood of ethnic conflict increases as the peripheral group's relative size goes up. The marginal impact is quite substantial as well. An increase in the MEG's power from the median (r = 0.003, or 0.3 percent of the dyadic population) to the 95th percentile value (r = 0.1) corresponds to a nontrivial fivefold increase in the probability of conflict, all else held at median values. By contrast, the GDP variable performs poorly, again failing to reach significance. Of the other country-level measures, the population variable is the only one that exhibits any effect. Even after controlling for degree of marginalization, politically excluded groups in large countries have a higher baseline probability of hosting a rebellion. Beyond that, the increasing time trend in ethnic conflict onsets is strongly confirmed, as is the healing effect of time since the last dyadic conflict.
We now add the geographic variables: the peripheral group's distance to the capital (hypothesis 2a) and extent of mountainous terrain in the excluded group's home region (hypothesis 2b). Model 5 provides strong evidence in support of these hypotheses. It is clear that, ceteris paribus, remote groups and groups in rough terrain are significantly more likely to be involved in conflict than those closer to the capital and those located in the plains. The latter finding is particularly interesting when compared to the insignificance of the corresponding country-level measure in the previous model and nicely illustrates the power of disaggregation. Note also that the impact of country population is substantially reduced as much of its effect is captured by the correlated distance variable. Adding the ethno-geographic variables to Model 4 boosts the influence of the already highly significant dyadic power balance. Moreover, the democracy term is now strongly significant, implying a higher baseline risk of ethnic rebellion in democratic societies. While this finding intuitively might seem suspicious, a similar result is reported by Buhaug for separatist conflict.Footnote 36
So far, we have used most of Fearon and Laitin's relatively long list of variables as the benchmark of our dyadic exploration. However, Achen warns against uncritically adding explanatory variables and estimating large models, as this is likely to distort inference.Footnote 37 In addition, several of the country-level controls are neither appropriate nor theoretically interesting in this context. In Model 6 and subsequent models, we thus limit the selection of country-level controls to per capita income. We further decided to drop Fearon and Laitin's measure in favor of Gleditsch's GDP per capita data,Footnote 38 because the latter data set has fewer missing observations and covers two additional years (2000–2001) in the most relevant period (though it lacks data for years before 1950). Moreover, we take the natural logarithm of the measure to compensate for a declining effect of one unit change with higher income values.
Apart from making the overall model better specified, Model 6 shows that dropping irrelevant controls further strengthens the empirical case for the geographically amended ethnic exclusion perspective. Per capita income, in contrast, once again fails to reach significance.
Figure 2 provides a graphic illustration of the association between r and the risk of dyadic conflict. The lower, solid line shows the marginal effect of r, holding all other covariates at their median values. Obviously, peripheral groups that face vastly superior EGIPs are not likely to rebel, but the risk of conflict increases markedly with the relative size of the marginalized group. In the middle dashed plot, we changed the distance from the capital to the peripheral group from the 50th to the 95th percentile value. This is associated with a considerably higher overall risk of conflict, as is also indicated by the positive coefficient in Model 6. The upper, dotted line in the figure shows the likelihood of conflict across values of r for both mountainous (95th percentile) and distant (95th percentile) groups. In line with our hypotheses, relatively sizable marginalized groups residing in rough terrain and at a considerable distance from the capital (such as Kurds in Iran and Bengalis in Pakistan before 1971) are those most likely to challenge the center by violent means.
Estimated risk of conflict as a function of the periphery's relative capability (r)

Checking the Robustness of the Dyadic Analysis
The results provide strong and compelling evidence in favor of our ethnic exclusion argument and simultaneously demonstrate the benefits of a disaggregated, dyad-level design. Yet, certain aspects of the analysis deserve more consideration. We therefore present three alternatively specified models that might help determine the robustness of the findings presented here.
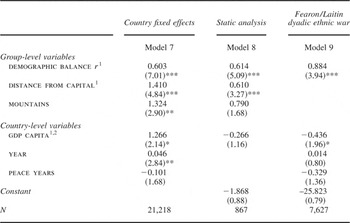
First, there is a potential problem with nonindependence among time-series observations of the same dyad as well as among dyads within the same country. The data are also likely to exhibit some degree of unit heterogeneity not fully accounted for by the current selection of regressors. While clustered standard errors address the former problem, unit heterogeneity remains largely unmeasured. A conventional method to model cross-sectional idiosyncrasies is to use a fixed-effects estimator. This procedure essentially adds one dummy variable per unit that allows for a unique intercept, and thus an individual baseline propensity for conflict for each country case. Model 7 in Table 3 presents the results from a fixed-effects logit analysis of the variables in the previous model.
Alternative specifications, dyadic level

Notes:
Model 7 uses a fixed-effects logit estimator of dyadic ethnic conflict, 1950–2001. Model 8 is a cross-sectional model of dyadic conflict, 1950–2001, with earliest available data on power ratio and GDP. Model 9 uses a dyadic version of Fearon and Laitin's civil war data, 1950–99 (Fearon and Laitin 2003) with dyadic power balance, r, calculated from group measures in Fearon 2003. Absolute z scores (robust in Model 8, clustered on countries in Model 9) are given in parenthesis. Estimates for three natural cubic splines (Models 7 and 9) not shown. 1. Lagged one year. 2. Log-transformed.
* p < .05;
** p < .01;
*** p < .001.
All dyad-specific explanatory variables confirm our preliminary conclusions. Political exclusion of large ethnic cohorts poses a serious risk, and particularly so if the groups reside in inaccessible terrain and at a considerable distance from the capital. Intriguingly, the estimate for the income variable is now significantly positive, while both the trend variable and the peace-year count replicate previous results.
The fixed-effects estimator comes with certain unfortunate side-effects. One such effect is that only units with variation on the dependent variable influences the regression estimates. This explains the dramatic (one-third) decrease in the number of observations in Model 7 compared to the previous model; all dyads in all countries without conflict in the sample period are by design dropped from the analysis. Yet, some of the excluded cases may have avoided conflict because of the very attributes on the explanatory variables. Deeming these cases irrelevant makes little sense.Footnote 39
Second, our ethno-geographic measures are in essence snapshots at one point in time, and the power balance, too, is static in most cases. A lack of temporal variation on key explanatory variables means that the model is not well-suited to predict the timing of conflict onset. Thus we next conduct a strictly cross-sectional analysis, with only one observation per dyad. In this case, the binary dependent variable distinguishes between dyads that exhibited one or more conflicts during the sample period and those that remained at peace. The time-varying covariates, dyadic power balance and GDP, are fixed at the earliest available figures for each dyad.
Model 8 shows the results from the static analysis. By and large, our main results are once again confirmed. Above all, the dyadic power ratio retains its powerful influence on the likelihood of ethnic conflict. A center-periphery dyad with median values on all covariates has an estimated risk of experiencing at least one conflict between 1946 and 2003 of p = .05. An otherwise similar dyad for which the marginalized group is relatively large (r set at the 95th percentile value, corresponding to a still hefty 90–10 power preponderance in favor of the EGIP) is six times more likely to be engaged in conflict, with p = .30. The two ethno-geographic variables also hold up quite well, even though the parameter estimates have shrunk and the rough terrain proxy is significant with only a 90 percent confidence threshold. The effect for per capita income is still not even remotely significant.
A final sensitivity test remains. Up to this point, our dyadic analysis has hinged entirely on the ethnic data of the ANM and the conflict data of the UCDP/PRIO ACD. Since these data sets deviate from alternative sources in important ways, one might speculate whether our results are artifacts of specific sample selection criteria and variable operationalizations. In particular, the ANM identifies a very large number of ethnic groups, many of which are clearly not politically relevant. It does not, however, capture demonstrably critical sectarian cleavages, for example, in Arab countries. The GIS-based method of generating group population estimates could also introduce measurement errors. Similarly, the ACD's inclusive definition of intrastate conflict (at least twenty-five annual battle-deaths) implies that the sample of conflicts are dominated by low-level insurgencies not considered “civil wars” by competing providers of conflict data. Hence, in Model 9 (Table 3) we replicate the analysis on Model 6 with a dyadic version of Fearon and Laitin's ethnic civil war data, using Fearon's group list and its associated group size values to construct the dyadic power balance indicator. Unlike the ANM, Fearon's ethnicity data contain no information on the location of the ethnic groups, so we are not able to test the robustness of hypotheses (2a) and (2b) here.
The results again provide strong and compelling support for the ethno-nationalist exclusion approach. Even with an entirely different group list and conflict data with a considerably higher minimum casualty threshold, hypothesis (1) holds. We also note that by dropping the geographic factors and using a sample of major civil wars only, the GDP per capita measure regains its negative and significant effect. The temporal control variables in Model 9 exert little impact on the overall fit of the model.
We also performed a series of other sensitivity analyses (not reported here) that confirm the robustness of our main findings. The results for the dyadic power balance and ethno-geographic measures remain if we control for the number of groups in each country, multiple simultaneous conflicts, various types of spatial and temporal patterns, or apply a different temporal threshold for coding recurring onsets. Applying a minimum r-score threshold to exclude “politically irrelevant” MEGs, successively removing the cases with the highest r-scores, or dropping the countries with the highest frequencies of dyadic conflict, made no significant difference either. Our results are also robust to exclusion of the Middle East region, which could be considered problematic due to the ANM's lack of distinction between Shia and Sunni Islam.
Conclusion
By disaggregating civil wars to the level of ethnic center-periphery dyads, this study underlines the importance of politicized ethnicity as a major factor driving internal conflict. Our research thus casts further doubt on recent studies that reject ethnic grievances as determinants of civil wars. From a policy perspective, this is an important insight because of the prominence that such studies have gained through the sponsorship of the World Bank and other international organizations.
More specifically, we are able to say something about why ethnic configurations have an impact on conflict behavior. Expecting powerful disgruntled ethnic minorities to be a major source of conflict, the dyadic perspective adopted here vindicates, and extends, Wimmer's theory of ethno-nationalist exclusion.Footnote 40 Center-periphery dyads characterized by such demographic asymmetries stand a much higher risk of civil war.
Our results also suggest that such an explanation interacts with ethno-geographic conditions. Other things being equal, ethnic groups far from their state capitals tend to be more prone to involvement in ethnic civil wars. The same can be said for those groups located in rough terrain. Geographic factors of this type can be seen as important refinements of highly aggregated measures of terrainFootnote 41 and cruder power estimations based merely on demographic group sizes.Footnote 42
Obviously, the current study is far from the final word on the influence of ethnicity on conflict. It should once again be emphasized that because of data limitations, we have confined ourselves to the study of Eurasia and North Africa. Future work will reveal if our conclusions hold up for the remaining world.Footnote 43 There is also plenty of room for improvement as regards the geographic calculations. With better data, one might be able to account for the quality of local communication infrastructure. The power estimation could also profit by relying on additional empirical dimensions, including data on mobilization and organizational structure of the groups in question.
For the time being, however, we advise against reducing civil wars to primarily greedy behavior, sheer criminality, or terrorist activities. The unresolved Israeli-Palestinian conflict, and mounting ethno-nationalist tensions within occupied Iraq, prove that ethnic nationalism is far from a spent force. If our findings are correct, this is a widespread problem that cries out for negotiated solutions. Military interventions that turn a blind eye to ethnic exclusion or try to manipulate the ethnic balance of power can be expected to foster future tension threatening to spill over international borders, as illustrated by those launched by the United States in Iraq in 2003 or by Israel in Lebanon in 2006. Although we have focused on civil wars here, it would be a mistake to underestimate the border-transgressing and border-transforming influence of nationalism in today's world. Future research will show how transnational ethnic links and international interventions interact with the exclusion mechanisms explored in the current study.