Significant outcomes
∙ The auditory brainstem response (ABR) profiling test for schizophrenia differentiated patients with schizophrenia versus healthy controls (HC) with an accuracy of 90.5% and versus patients with attention-deficit hyperactivity disorder (ADHD) with an accuracy of 88.0%.
∙ The ABR profiling test for ADHD differentiated patients with ADHD versus HC with an accuracy of 90.2% and versus patients with schizophrenia with an accuracy of 92.0%.
Limitations
∙ There was a limited number of study participants.
∙ Potential effects of antipsychotic medication on ABR profiling are not known.
∙ Test–retest reliability of the ABR profiling tests for schizophrenia and ADHD tests have not been ascertained.
Introduction
Schizophrenia is a severe and often chronic and disabling brain disorder that generally appears in late adolescence or in early adulthood with positive (delusions, hallucinations, disorganised speech, and disorganised or catatonic behaviour) and negative (affective flattening, restrictions in the fluency and productivity of thought and speech and goal-directed behaviour) symptoms. For a diagnosis of schizophrenia, symptoms must have been present for a minimum of 6 months and include at least 1 month of active phase (1). Subtypes of schizophrenia are based on the clinical picture and are specified as paranoid, disorganised, catatonic, undifferentiated or residual type according to Diagnostic and Statistical Manual of Mental Disorders Fourth Edition (DSM IV). ADHD is a common neuropsychiatric disorder in childhood that often continues through adolescence into adulthood. It is characterised by a persistent pattern of inattention with or without hyperactivity-impulsivity causing significant functional impairment and reduced quality of life (1). The importance of early diagnosis and intervention for both disorders is stressed by the fact that the symptoms affect many areas of life often leading to social and occupational functional impairment.
Biomarkers and endophenotypes in schizophrenia have long been sought within neuropsychology, brain imaging, and the omics (genomics, proteomics, metabolomics) so far with limited success (Reference Feldcamp and Wong2). Alternative approaches, such as Research Domain Criteria have been proposed and discussed (Reference Insel, Cuthbert and Garvey3,Reference Kapur, Phillips and Insel4). Electrophysiological testing, quantitative electroencepholography (EEG) and auditory event-related evoked potentials, has led to potential biomarkers such as P300 (Reference Jeon and Polich5,Reference Luck, Mathalon and O´Donnell6), and mismatch negativity (MMN) (Reference Näätänen, Shiga, Asano and Yabe7). In ADHD two biomarkers have been approved for specific clinical use by the Food and Drug Administration (USA): The Neuropsychiatric EEG-based assessment aid (Reference Snyder, Rugino, Hornig and Stein8) and QbTest, a combination of continuous performance test with motor activity measures (Reference Lis, Baer, Stein-En-Nosse, Gallhofer, Sammer and Kirsch9,Reference Bijlenga, Jasperse, Gelhaar and Kooiji10). The utility of several electrophysiological methods as support in clinical psychiatry has been advocated by Kropotov (Reference Kropotov11).
The ABR reflects subcortical shifts in electrical potential recorded over 10 ms after sound stimuli using scalp electrodes. The technique was first described by Jewett and Williston (Reference Jewett and Williston12). The brainstem responses are visualised as waveforms with positive waves labelled I–VII representing synchronous electrical activity in the auditory nerve and in populations of brainstem neurons. Waves I and II emanate from the auditory nerve and waves III and IV are believed to be generated in the cochlear nucleus and the superior olivary complex, respectively (Reference Burkard, Don and Eggermont13,Reference Hall14). Wave V is believed to reflect activity at the levels of the lateral lemniscus and the inferior colliculus and waves VI and VII are suggested to have thalamic (the medial geniculate body) origin (Reference Legatt15). By examining the waveforms, peak latencies in milliseconds and peak amplitudes in microvolt of individual waves various audiological and neurological abnormalities can be detected (Reference Burkard, Don and Eggermont13,Reference Hall14,Reference Hosford-Dunn16,Reference Musiek and Baran17) with the disadvantage, however, that the amplitudes of the ABR waves have been difficult to quantify and characterize due to complex waveforms and high inter- and intra-individual variability (Reference Beattie18). In schizophrenia patients, abnormal or even missing peaks (Reference Hayashida, Mitani, Hosomi, Amemiya, Mifune and Tomita19–Reference Igata, Ohta, Hayashida and Abe22), delayed latencies (Reference Harell, Englender, Demer, Kimhi and Zohar23, Reference Kimhi, Englender, Zohar and Harell24), abnormal reactions to auditory masking (Reference Källstrand, Montnemery, Nielzén and Olsson25,Reference Källstrand, Olsson, Nehlstedt, Sköld and Nielzén26), and disturbed peripheral lateralization (Reference Veuillet, Georgieff, Philibert, Dalery, Marie-Cardine and Collet27,Reference Källstrand, Nehlstedt, Sköld and Nielzén28) have been observed, whereas some studies have found normal waveforms (Reference Pfefferbaum, Horvath, Roth, Tinklenberg and Kopell29–Reference Igata, Ohta, Hayashida and Abe31). In children with ADHD, prolonged peak latencies, prolonged inter-wave intervals, significantly longer transmission times and significant asymmetry of wave III latency between the ears have been reported (Reference Lahat, Avital, Barr, Berkovitch, Arlazoroff and Aladjem32–Reference Claesdotter-Hybbinette, Safdarzadeh-Haghighi, Råstam and Lindvall35). However, studies are few and some studies have reported normal ABRs (Reference Schochat, Scheuer and Andrade36,Reference Vaney, Anjana and Khaliq37). A review of the field concluded that further work was needed (Reference Barry, Johnstone and Clarke38), but a follow-up review of the subject 10 years later did not report any such studies (Reference Johnstone, Barry and Clarke39).
Processing of digitised ABR waveforms with the new ‘moving minimum subtraction method’ (Reference Källstrand, Lewander, Baghdassarian and Nielzén34) in combination with sets of traits and disease indices have been defined using different sound stimuli, sex-specific norm curves, and differences in laterality for groups of patients with ADHD and schizophrenia, respectively (Reference Källstrand and Nielzén40). These analyses have permitted detection of novel characteristics, traits, that differentiate neuropsychiatric conditions from healthy individuals and from each other (Reference Källstrand, Olsson, Nehlstedt, Sköld and Nielzén26,Reference Claesdotter-Hybbinette, Safdarzadeh-Haghighi, Råstam and Lindvall35,Reference Källstrand and Nielzén40,Reference Sköld, Källstrand and Nehlstedt41). The methods by Källstrand and Nielzén (Reference Källstrand and Nielzén40), here denoted ‘ABR profiling’, have resulted in potential biomarkers with high sensitivity and specificity for detection of both schizophrenia (sensitivity 78.8%, specificity 92.6%) and ADHD (sensitivity 89.7%, specificity 94.4%) versus HC.
Aims of the study
The aim of the present study was to evaluate the ABR profiling methods by Källstrand and Nielzén (Reference Källstrand and Nielzén40) as potential biomarkers and diagnostic support for schizophrenia and adult ADHD, respectively, versus healthy volunteers in a study design with blinded evaluation.
Methods
Study participants
ABR recordings were collected between June 2009 and May 2012 from stably medicated patients with schizophrenia (n=28; 14 males, 14 females), unmedicated patients with adult ADHD (n=28; 15 males, 13 females) fulfilling DSM IV text revision diagnostic criteria (1) and HC (n=63; 30 males, 33 females). The age range for inclusion was set to 18–50 years. General exclusion criteria for all study participants were bipolar disorder, autism spectrum disorders, ongoing alcohol and substance misuse, brain damage, epilepsy and other neurological disorders. All study participants were assessed with the split global assessment of function (GAF) scale (GAF symptoms, GAF function) (Reference Pedersen, Hagtvet and Karterud42,Reference Pedersen and Karterud43), the clinical global impression (CGI) scale (Reference Guy44) and the alcohol use disorders identification test (Reference Saunders, Aasland, Babor, De La Fuente and Grant45,Reference Babor, Higgins-Biddle, Saunders and Monteiro46). Clinical data regarding handedness, ongoing prescribed and non-prescription medication, concomitant diseases, hearing problems, tinnitus, vertigo, nicotine-, alcohol- and substance use, and family history of psychiatric and other central nervous system (CNS) diseases were recorded.
The study was approved by the Regional Ethical Review Board, University of Uppsala (2009/114). Written informed consent was obtained from all study participants.
Patients with schizophrenia were recruited from the Psychosis Unit at Uppsala University Hospital and diagnosed using the Swedish version (Reference Herlofson47) of the structured clinical interview for DSM IV disorders (SCID), I and II (Reference First, Spitzer, Gibbon and Williams48) before ABR profiling data analysis and code break. The majority were out-patients in a stably medicated condition and a duration of illness of at least 1 year from their first psychosis diagnosis at the time of the ABR recordings.
Patients with ADHD fulfilling the DSM IV criteria according to consensus best estimate diagnosis after multidisciplinary assessments (Reference Klein, Crosby Quimette, Kelly, Ferro and Riso49) were mainly recruited from the adult neuropsychiatric outpatient clinic at Uppsala University Hospital. All patients had a history of ADHD symptoms from <7 years of age. In addition to the general exclusion criteria, psychiatric comorbidity with previous or current psychosis, schizophrenia and schizoaffective disorder, was excluding. Medication with CNS stimulants was not allowed during 24 h preceding the test. In addition to other assessments, the ADHD participants filled out the adult attention-deficit hyperactivity disorder self-report scale (ASRS) (Reference Kessler, Adler and Ames50,Reference Adler, Spencer and Faraone51).
HC were mainly recruited amongst students and hospital personnel. They were investigated with the ASRS to rule out undiagnosed ADHD and the structured interview for prodromal syndromes (Reference Miller, Mcglashan and Woods52,Reference Miller, Mcglashan and Rosen53) to rule out pre-psychotic or psychotic symptoms.
Apparatus
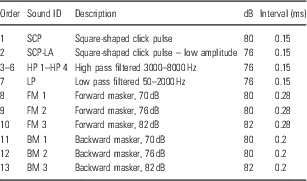
A sequence of 13 sound stimuli (Table 1) were presented to the study participants using a Denon DCD-685 CD player (Denon Electronics, Mahwah, NJ, USA). The output of the CD player was connected to TDH-50P headphones with model 51 cushions (Telephonics, Farmingdale, NY, USA). The sound pressure levels were calibrated using a Bruel and Kjaer 2203 sound-level meter and type 4152 artificial ear (Bruel and Kjær S&W Measurement, Nærum, Denmark). Presentations were made binaurally with the stimuli in phase over the headphones. The evoked potentials were recorded using the Chartr EP ABR recording equipment (GN Otometrics, Taastrup, Denmark). Transistor–transistor logic trigger pulses coordinated the sweeps with the auditory stimuli. A total of 1024 accepted evoked responses were collected, and an averaged ABR waveform was obtained for each sound, ear and subject. Aberrant activity, for example, from coughing was rejected using the standard setup of the Chartr software (GN Otometrics). The resulting analog waveforms were digitised using ByteScout (Vancouver, BC, Canada) software and imported to Microsoft Excel (Microsoft Corporation, Redmond, WA, USA) for further processing. The apparatus was equivalent to those used in previous studies (Reference Källstrand, Lewander, Baghdassarian and Nielzén34,Reference Källstrand and Nielzén40).
Description of sound stimuli

Auditory stimuli
The complete set of stimuli included a series of 13 patented sounds (Table 1). Square-shaped click pulses (SCP): 0.136 ms duration including 0.023 ms rise and fall; stimulus interval (onset to onset): 0.15–0.28 ms; frequency 3.6–6.6/s depending on sound. Masking noise: ≤1500 Hz. The auditory stimuli were constructed using the MATLAB signal-processing toolbox (The MathWorks Inc., Natick, MA, USA). The auditory stimuli were the same as used by Källstrand and Nielzén (Reference Källstrand and Nielzén40). Forward and backward masking procedures have been described in Källstrand et al. (Reference Källstrand, Montnemery, Nielzén and Olsson25).
ABR recording procedure
All ABR recordings were administered by trained personnel from Uppsala University Hospital in a quiet, darkened room and in the same location. Participants were tested one at a time, seated in an armchair with surface electrodes attached to the skin over the mastoid bones behind the left and right ear and with a ground electrode and a reference electrode placed on the vertex and forehead, respectively. The procedure was fully explained to the test subject and a short sequence of the first click pulse (SCP) was presented beforehand to make him/her acquainted with the stimuli. Absolute impedances and inter-electrode impedances were measured before and after the tests to verify that electrode contact was maintained. The participants were instructed to relax and were permitted to fall asleep. The sounds were presented through earphones and simultaneously neural activity was recorded and stored as analog curves. Between the sounds the participants could ask questions or request a short listening-break. The test required no active participation other than being able to relax sufficiently and to be subjected to sound stimulation. The duration of the testing procedure lasted around 40 min. The output from a test session resulted in 26 ABR recordings (13 sounds, both ears). With processing of the recordings (Unprocessed, W136, W68, see below), 78 waveforms for each participant were available for further analyses.
Data analysis
Data quality check
Before further analysis of the ABR recordings a check was performed to grant audiogram quality. The SCP audiograms from each participant were correlated to ABR data in a normative database from a separate group of healthy, normal hearing individuals. A low correlation, r≤0.35, led to exclusion of the recording due to risk of erroneous measurements.
Digitisation and processing
The analog waveforms were digitised using the ByteScout (Vancouver, BC, Canada) software and imported to Microsoft Excel (Microsoft Corporation, Redmond, WA, USA) resulting in unprocessed digitised waveforms. With the digitisation method used the 10 ms authentic analog ABR was represented by 1540 data points, that is, 154 data points/ms including peaks I–VII. The digitised waveforms were processed using ‘the moving minimum subtraction method’ Källstrand et al. (Reference Källstrand, Lewander, Baghdassarian and Nielzén34) with two data point widths (W136, W68). W136 corresponds to 136 data points (0.88 ms) showing peak I, fused peaks II–III and fused peaks IV–V, and peaks VI and VII with the baseline aligned to 0. W68 corresponds to 68 data points (0.44 ms), showing baseline aligned peaks I–VII mostly separated from each other. Digitisation of the analog ABR recordings together with the moving minimum subtraction method to produce baseline aligned curves permits analyses of the waveforms with numerical calculations of distances and correlations between the whole or parts of waveforms from study participants versus norm curves and statistical comparisons between groups of subjects in addition to inter-peak latencies, peak amplitudes and peak areas.
Traits and disease indices
On the basis of the above methods, disease-specific traits for schizophrenia and ADHD had previously been identified: 15 and 17 traits differentiated male and female patients with schizophrenia from male and female HC, and 10 and 17 traits differentiated male and female patients with adult ADHD from male and female HC (Reference Källstrand and Nielzén40). Traits included calculations of sex-specific correlations with, and distances from, large or small spans of the 10 ms norm curves from peak I onwards of male and female patients with clinical diagnoses of schizophrenia or adult ADHD, respectively, as described in detail in Källstrand and Nielzén (Reference Källstrand and Nielzén40). The spans correspond neuroanatomically to different parts of the auditory pathways. Disease match indices were based on the participant’s number of positive traits times trait constants divided by the total number of traits for each category providing percentage agreement (0–100%). A disease index ≥50% rendered the study participant an ‘ABR profiling diagnosis’ of schizophrenia or ADHD, respectively, to be compared with their respective clinical diagnoses. A disease index <50% was regarded as no such diagnosis.
Blinding of recordings
The analog brainstem auditory evoked response recordings together with information on sex, age and handedness were coded and sent to SensoDetect AB, Lund, Sweden, for analysis in sequential order dependent on time of inclusion in the study. No clinical information on symptoms or diagnosis was provided. After the study was closed per the study protocol, digitisation and analysis was initiated and the results were returned to Uppsala University Hospital in a first joint code-breaking session to match clinical diagnoses with the ABR profiling diagnoses. Clinicians at the study site, representatives for SensoDetect AB and an independent regulatory affairs professional participated. When the code was broken the matching of clinical diagnosis results made no sense. SensoDetect AB reanalysed the recordings and found flaws in the computerised algorithm used for analysis that had led to wrongly calculated disease indices. To secure blind evaluation, the original ABR recordings were re-coded in randomized order and a third and independent party was trained to reanalyse the material using the corrected algorithm before a second code-breaking session, which was overseen by the same independent regulatory affairs professional that had participated in the first session.
Statistical analyses
Sensitivity, specificity and other measures of biomarker test performance calculations were done according to standard methods (Reference Fawcett54–Reference Whiting, Davenport and Jameson56). GraphPad PRISM 6, version 6.07 June 2015 (GraphPad Software Inc., La Jolla, CA, USA) was used for statistical computations and receiver operating characteristic (ROC) curve analyses. Rating scale data were reported as medians and range. The Mann–Whitney test was used for significance testing and Spearman’s r for rank correlations.
Results
Characteristics of study participants
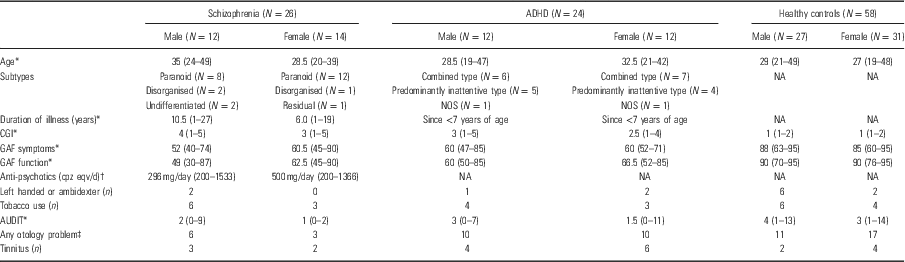
A total of 28 patients with schizophrenia, 28 patients with ADHD and 63 HC were recruited for the study. Two male schizophrenia patients were excluded; due to dropout during registration (n=1) and poor ABR quality (n=1), four adult ADHD patients (three males, one female) were excluded due to registrations not being downloaded correctly (n=2) and poor ABR quality (n=2). Five HC (three males, two females) were excluded due to poor ABR quality (n=2), incomplete registration (n=1) and due to information on family history of psychiatric disease after recruitment (n=2). In the final analyses, complete ABR recordings from 108 participants were available representing 26 schizophrenia patients, 24 adult ADHD patients and 58 HC (Table 2).
Characteristics of study participants

ADHD, attention-deficit hyperactivity disorder; AUDIT, alcohol use disorders identification test; CGI 1–7, clinical global impression of illness, rated 1–7 (normal to extremely ill); cpz eqv/d, chlorpromazine equivalents per day; NA, not applicable; NOS, not otherwise specified.
Global assessment of function (GAF) symptoms: rated 1–100, where 1=risk of self-harm or harm to others, and 100=no symptoms; GAF function: rated 1–100, where 1=unable to handle personal hygiene 100=particularly good function.
* Median (range).
† Antipsychotic medication expressed as cpz eqv/d (median, range).
‡ Any lifetime problem including otitis media, eardrum perforation, myringotomy tubes, mild hearing impairment, hyperacusis, ear trauma.
The median age was 30.5 years for schizophrenia, 29.5 years for ADHD. The median split GAF (symptoms, functioning) scores were 55.5, 53 for schizophrenia and 60, 63 for ADHD. All schizophrenia patients, were on antipsychotic medication; dosages were expressed as chlorpromazine equivalents per day (Reference Woods57, Reference Woods58). The median dose was 425 mg/day (range 200–1533 mg/day). In total, 17 patients, 65.4%, were prescribed clozapine, indicating treatment resistance to first line therapy. Six were on clozapine monotherapy and 11 on clozapine combined with aripiprazole (n=8) or olanzapine (n=1), quetiapine (n=1), perphenazine (n=1). Six patients were on monotherapy with aripiprazole (n=3), olanzapine (n=2) or paliperidon (n=1). Other combinations were zuclopenthixol (injectable) and aripiprazole (n=1), zuclopenthixol and ziprasidone (n=1), and haloperidol and risperidone (n=1). In addition, one patient was on a mood stabiliser, valproate, and eight patients were on antidepressants.
The median age for HC was 27.5 years and they had high split GAF scores: 87, 90. A GAF symptom score of 60 in the control group was due to low grade depressive symptoms during the week preceding test and a single CGI score of 2 was due to symptoms of anxiety during the test. Two HC were on antidepressant medication; both were euthymic at the time of testing. No other psychoactive drugs were used.
The frequencies of alcohol and tobacco use were somewhat higher in the controls as compared with the two patient groups. It was also noted that reports of any lifetime otological problems or tinnitus were more prevalent among the ADHD patients as compared with the other groups.
Test results
Schizophrenia
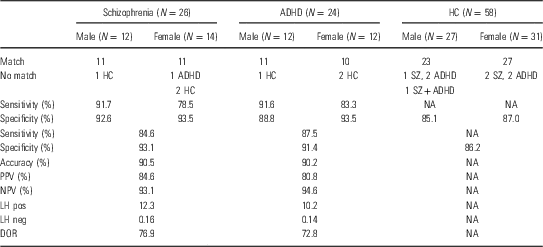
The ABR profiling method for schizophrenia using a disease index of ≥50% identified patients meeting DSM IV diagnostic criteria for schizophrenia with a sensitivity of 84.6% and a specificity of 93.1% (Table 3). The sensitivity was 13 percentage units lower for females than for males. Four schizophrenia patients, three females and one male, failed to get an ABR profiling diagnosis of schizophrenia. One of them had a positive ABR profiling test for ADHD and three tested negative for both schizophrenia and ADHD. The clinical data did not distinguish these participants from the majority of patients with schizophrenia. There were no statistically significant correlations between the disease index values for schizophrenia and scores on the CGI and GAF scales, and there was no significant difference in disease indices between the paranoid versus other subgroups of schizophrenia.
Disorder-specific test matching vs. healthy controls (HC)

Schizophrenia index ≥50% and attention-deficit hyperactivity disorder (ADHD) index ≥50% vs. HC, respectively.
NA=Not Applicable.
Sensitivity: Proportion of participants with the disorder who get a positive test result.
Specificity: Proportion of participants without the disorder who get a negative test result.
Accuracy: Proportion of true test positive participants+true test negative participants/all participants.
Positive predictive value (PPV): Probability that a participant with a positive test result has the disorder.
Negative predictive value (NPV): Probability that a participant with a negative test result does not have the disorder.
Positive likelihood ratio (LH pos): The number of times more likely a person with the target condition is to have a positive test result compared with a person without the target condition.
Negative likelihood ratio (LH neg): The number of times more likely a person with the target condition is to have a negative test result compared with a person without the target condition.
Diagnostic odds ratio (DOR): LH pos/LH neg.
ADHD
The ABR profiling method for ADHD identified patients meeting DSM IV diagnostic criteria for ADHD with a sensitivity of 87.5% and a specificity of 91.4% (Table 3). The sensitivity was 8.3 percentage units lower for females than for males. Three ADHD patients, two females and one male, tested negative for the ADHD ABR profiling method. Two participants in the ADHD group tested positive for both ABR profiling methods. The clinical data did not distinguish these participants from the majority of patients with ADHD. There were no statistically significant correlations between the disease index values for ADHD and scores on the CGI or GAF scales, and there was no significant difference in disease indices between the combined type versus the predominantly inattentive type.
HC
As shown in Table 3, 50 HC tested negative for both ABR profiling methods, that is a specificity of 86.2%. Three HC tested positive for schizophrenia and four tested positive for ADHD; one control tested positive for both schizophrenia and ADHD. There were no indications of mental disorders in these participants from case histories or clinical data.
Dot plots and ROC curve analyses
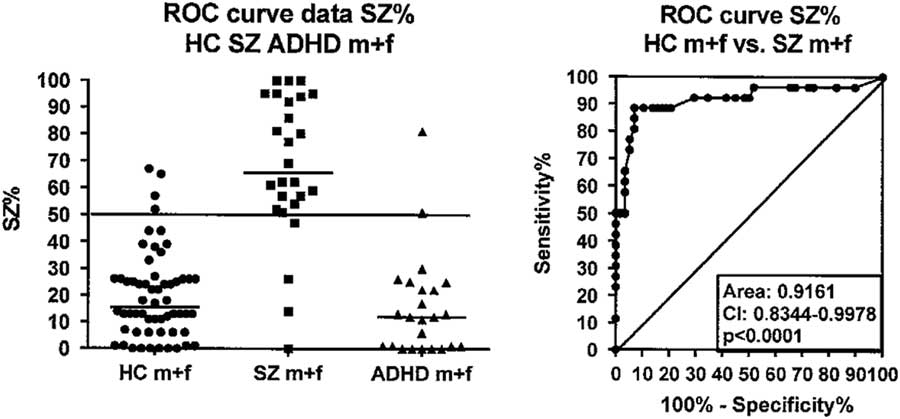
Figure 1 shows the dot plot of all 108 study participants analysed using the ABR profiling method for schizophrenia. The disease index of 50% separated most patients with schizophrenia from both controls (accuracy 90.5%) and ADHD patients (accuracy 88.0%). The ROC curve analysis with the statistically significant area of 0.92 supported the sensitivity and specificity results of schizophrenia versus controls calculated using conventional methods (see Table 3). The ROC curve area was larger for males [0.97, confidence interval (CI) 0.92–1.02] than for females (0.88, CI 0.75–1.01) consistently with the higher sensitivity in males than in females.
Left: Dot plot of schizophrenia index data (SZ index %) for Healthy controls (HC; males + females, N = 58), participants with schizophrenia (SZ; males + females, N = 26) and participants with ADHD (males + females, N = 24). Right: ROC (Receiver Operating Characteristics) curve based on HC and SZ data from the dot plot. ADHD, attention-deficit hyperactivity disorder; CI, confidence interval; HC, healthy controls; ROC, receiver operating characteristic; SZ, schizophrenia.

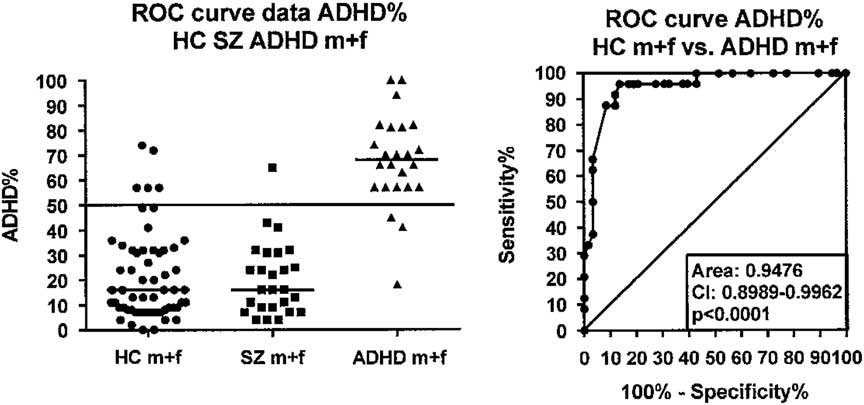
Figure 2 shows the dot plot of all study participants analysed using the ABR profiling method for ADHD. There was a clear separation of most ADHD patients from both controls (accuracy 90.2%) and patients with schizophrenia (92.0%). The ROC curve analysis showed a statistically significant area of 0.95 and the results supported the sensitivity and specificity results of ADHD versus controls shown in Table 3. The ROC curve area was larger for males (0.96, CI 0.91–1.01) than for females (0.93, CI 0.86–1.01) consistently with the higher sensitivity in males versus females.
Left: Dot plot of ADHD index data (ADHD%) for Healthy controls (HC; males + females, N = 58), participants with schizophrenia (SZ; males + females, N = 26) and participants with ADHD (males + females, N = 24). Right: ROC (Receiver Operating Characteristics) curve based on HC and ADHD data from the dot plot. ADHD, attention-deficit hyperactivity disorder; CI, confidence interval; HC, healthy controls; ROC, receiver operating characteristic; SZ, schizophrenia.

Discussion
The results of the present independent, blinded study, using computerised algorithms for analyses of the ABRs, confirm the results of the proposed diagnostic tests for schizophrenia and adult ADHD based on ABR profiling developed by Källstrand and Nielzén (Reference Källstrand and Nielzén40). Our study was done in patients and controls from a different part of Sweden. The sensitivity and specificity figures from our study were comparable with those reported in Källstrand and Nielzén (Reference Källstrand and Nielzén40) including the lower sensitivity percentages in female than in male schizophrenia and ADHD patients. Apparently, there are structural or functional brainstem differences between patients with schizophrenia and ADHD, respectively, versus controls giving rise to the 10–17 disorder and sex-specific traits that have been converted into disease indices (Reference Källstrand and Nielzén40). The nature of such brainstem ABR differences remains unexplained. The clinical diagnoses in the present study were strict, utilising SCID I and II for schizophrenia, and best estimate diagnoses for ADHD, and formal screening of controls for potentially missed ADHD, psychosis and prodromal syndromes. Thus, all ADHD and schizophrenia patients fulfilled DSM IV diagnostic criteria. Most schizophrenia patients had multiple episodes and had been diagnosed by specialists on several occasions (in many cases due to treatment resistance), thus fulfilling the LEAD (Longitudinal evaluation Expert clinicians using All Data) concept (Reference Spitzer59) in support of validity of the clinical diagnoses. Three out of 24 ADHD patients tested negative for ADHD. It cannot be ruled out that medication with central stimulants lingered in their blood although 24 h since last intake before testing was stipulated. It remains unexplained why three HC tested positive with the schizophrenia tests, four tested positive in the ADHD tests, and one tested positive in both tests.
Care was taken to check for ongoing medications, tobacco- and alcohol use, history of ear disease and hearing problems (e.g. tinnitus). Interestingly, it was noted that 20/24 ADHD patients reported a lifetime history of otological problems, and 10/24 suffered or had suffered from tinnitus. The controls and the schizophrenia patient group reported less than half of such problems (cf. Table 3).
There is an abundance of studies of ABR and auditory evoked potentials beyond the 10 ms post-stimulus interval, especially P300 and MMN, in both schizophrenia and ADHD (Reference Kropotov11,Reference Hall14,Reference Luck and Kappenman60). However, recently reported findings have not yet resulted in clinically established diagnostic biomarkers (Reference Näätänen, Shiga, Asano and Yabe7,Reference Johnstone, Barry and Clarke39,Reference Light and Näätänen61). ABR profiling alone, or in combination with other auditory evoked responses (P300, MMN), or oculomotor symptoms (Reference Beedie, Benson, Giegling, Rujescu and St Clair62), may have the potential to differentiate schizophrenia from other psychotic disorders (schizoaffective disorder, bipolar disorder with psychotic symptoms), in first episode psychosis, prodromal syndromes and other mental disorders. To reach regulatory approval and evidence-based clinical acceptance outside of clinical research, systematic assessments of novel biomarkers are needed (Reference Sackett and Haynes63–Reference Perlis65). The ABR profiling methods in combination with stringent clinical diagnostic procedures deserve to be explored further in larger clinical studies including a broad spectrum of mental disorders to determine their respective specificity versus other mental disorders and utility as potential diagnostic biomarkers.
Nielzén et al (Reference Nielzén, Holmberg, Sköld and Nehlstedt66) has recently reported results that are similar to and in support of the study by Källstrand and Nielzén (Reference Källstrand and Nielzén40) using a different method of analysis of the ABRs, namely differences in areas under curve for spans of the ABR waveforms for individual sounds between controls and patients. Källstrand and Nielzén (Reference Källstrand and Nielzén40) used correlations between the tested person and norm curves for spans of the ABRs, usually taking all sounds in combination.
Limitations
Limitations of the present study are the modest number of patients studied, omission of urinary drug screening, and the lack of data on reliability (i.e. test/retest) of the ABR profiling tests. Another limitation is the lack of data on potential effects on test results of antipsychotic, central stimulant and other medications, an important issue to be resolved. GAF and CGI were used as measures of severity of disease in the present study. In future studies of schizophrenia suitable rating scales should be used to establish potential effects on the ABRs of florid psychotic symptoms versus negative and cognitive symptoms. State versus trait issues also need to be investigated.
Conclusions
In conclusion, the ABR profiling methods used in the present study discriminated schizophrenia and ADHD from HC with high sensitivity and specificity. The methods deserve to be further explored in larger clinical studies including a broad range of psychiatric disorders versus controls without mental disorders to determine their clinical utility as diagnostic biomarkers.
Acknowledgements
The present investigator-initiated study was planned and performed as part of doctoral studies and funded by the Medical Faculty, Uppsala University, Uppsala, Sweden. The authors would like to thank to Lars Sjölund for assistance with data collection and Kristina Stjernlöf and Magdalena Lindborg for assistance with SCID-interviews. The authors would also like to thank all study participants. SensoDetect AB, Lund, Sweden is acknowledged for providing access to instrumentation for ABR recordings, training of personnel at the study site, analysis of the ABR recordings using its proprietary methods, and know-how related to the methods. All raw data produced during the study, including individual digitised ABRs, have been made available to the Department of Neuroscience, Psychiatry, Uppsala University for additional analyses after completion of the study. Authors’ Contributions: The study was planned by a research team consisting of the author and the co-authors at Uppsala University Hospital. First draft of the manuscript made by E.J.B. was critically revised by all the co-authors. All co-authors have approved of the final version to be published.
Conflicts of Interest
None.
Ethical Standards
The authors assert that all procedures contributing to this work comply with the ethical standards of the relevant national and institutional committees on human experimentation and with the Helsinki Declaration of 1975, as revised in 2008.