Implications
Extending the length of productive life could be one way to mitigate greenhouse gas emissions, but this still needs to be demonstrated and quantified. Individual and system-based calculations were made using data determined experimentally on 30 cows. The results showed that emissions and economic profit per unit of milk improved with productive lifetime. Cows that had not finished their first lactation performed particularly unfavourably. When including the associated beef production, emissions per unit of animal protein also decreased with age, but individual cow history caused extra variation. These findings support efforts to increase longevity in dairy cattle.
Introduction
Dairy production is often criticized as a major emitter of greenhouse gases (GHG) and thus contributing to climate change (Caro et al., Reference Caro, Davis, Bastianoni and Caldeira2014). Life cycle analysis (LCA) studies explored main determinants of GHG emissions in dairy production systems (e.g. Wolf et al., Reference Wolf, Groen, Berg, Prochnow, Bokkers, Heijungs and de Boer2017). In industrialized countries, three main sources (not considering carbon emissions from land use/land use change) were regularly identified: (1) methane (CH4) produced by fermentation in the rumen, (2) GHG emissions that arise during production, processing, transport and storage of feed and (3) GHG emissions that occur along with the rearing of replacement animals (Hörtenhuber et al., Reference Hörtenhuber and Zollitsch2010; Flysjö et al., Reference Flysjö, Cederberg, Henriksson and Ledgard2011; Wolf et al., Reference Wolf, Groen, Berg, Prochnow, Bokkers, Heijungs and de Boer2017). In this context, increasing the level of production of the individual cow is often mentioned as an option to mitigate CH4 emission intensity (CH4 emissions per unit of milk produced) due to the dilution of maintenance (Capper and Bauman, Reference Capper and Bauman2013). However, this neglects that high yields are often associated with a high replacement rate. The last decades showed that with increasing milk yields of cows their length of productive life (LPL) concomitantly decreased markedly (Knaus, Reference Knaus2009). Increasing the LPL could be considered an option to mitigate GHG emissions as it reduces GHG emissions from the rearing of replacement animals (Zehetmeier et al., Reference Zehetmeier, Hoffmann, Sauer, Hofmann, Dorfner and O’Brien2014; Bell et al., Reference Bell, Garnsworthy, Stott and Pryce2015). The strategy may even improve the profitability of milk production (Horn et al., Reference Horn, Knaus, Kirner and Steinwidder2012; De Vries, Reference De Vries2017). However, no detailed system comparison has yet been made to confirm or disprove the role of LPL in this context.
Another aspect is important when the two strategy options of increasing actual milk yield or increasing LPL are evaluated. Producing milk with a smaller number of high-yielding dairy cows opens a gap in beef supply. Given that no changes in demand for beef occur, this gap is typically compensated by an expansion of suckler beef production (Flysjö et al., Reference Flysjö, Henriksson, Cederberg, Ledgard and Englund2012; Zehetmeier et al., Reference Zehetmeier, Baudracco, Hoffmann and Heißenhuber2012). In this context, Styles et al. (Reference Styles, Gonzalez-Mejia, Moorby, Foskolos and Gibbons2018) showed that an intensification of a dairy production system can lead to increased GHG emissions through land use change and additional suckler beef production. Therefore, if a change of practices in dairy production systems has effects on the number of calves available for fattening, an expanded system should be considered (Puillet et al., Reference Puillet, Agabriel, Peyraud and Faverdin2014) as the GHG emissions of beef from fattened dairy calves largely differs from that from suckler beef systems (e.g. Alig et al., Reference Alig, Grandl and Nemecek2013).
The aim of the present study was to gain insight into how cows of different LPL perform with regard to their lifetime productivity, GHG emissions, and profitability. The analysis applies an LCA approach and a full cost analysis on a case study where a group of animals quite evenly stratified by age was evaluated in detail in a metabolic experiment (Grandl et al., Reference Grandl, Amelchanka, Furger, Clauss, Zeitz, Kreuzer and Schwarm2016a and Reference Grandl, Luzi, Furger, Zeitz, Leiber, Ortmann, Clauss, Kreuzer and Schwarm2016b). Following the reasoning above, we introduced the potential beef produced from these cows in addition to the milk produced as an alternative functional unit for the analyses. The case study setting allowed investigating the effects of LPL in detail at a specific point of time in the life of the animals and from their entire lifespan perspective.
Material and methods
Animal data
The 30 case study cows were part of an experiment with the aim to determine the biological background of potential differences in performance and emissions of dairy cows of different age. Details of the experimental procedures are described in Grandl et al. (Reference Grandl, Amelchanka, Furger, Clauss, Zeitz, Kreuzer and Schwarm2016a and Reference Grandl, Luzi, Furger, Zeitz, Leiber, Ortmann, Clauss, Kreuzer and Schwarm2016b). In brief, the cows were taken randomly from the Brown Swiss herd of the Plantahof (Landquart, Canton of Grisons, Switzerland). Half of the cows each had received a diet either with a limited amount or without concentrate for their entire LPL (‘no concentrate’ and ‘with concentrate’ feeding regime). The cows were between 2 and 10 years old and their LPL (first parturition until the time of the experiment) was from 48 to 2608 days. Information about previous calvings and milk yields was available from the herd book database. The experimental cows are described in Table 1. Milk yield was expressed as fat and protein corrected milk (FPCM) (kg)=uncorrected milk (kg)×(0.337+0.116×fat content (%)+0.06×protein content (%)) (Gerber et al., Reference Gerber, Vellinga, Opio, Henderson and Steinfeld2010). Lifetime milk production of the cows was calculated as the sum of full lactation yields from the first lactation up to the lactation before the experiment plus the test-day yields before the experiment started, and milk yield per day of life as the lifetime milk production divided by the age at the time of the experiment. Lifetime beef production was calculated as the beef yield of the cow as if slaughtered at the time of the experiment plus the beef potentially produced from the respective cow’s offspring. The calculations were based on the assumption that all calves but one of a cow were used for fattening. We assumed the most common beef fattening system in Switzerland which starts with a standard milk/milk replacer feeding phase followed by bull fattening on high quality forages and concentrate as described in Alig et al. (Reference Alig, Grandl, Mieleitner, Nemecek and Gaillard2012) for animals of a final live weight (LW) of 525 kg at a daily LW gain of 1049 g.
Characterization of the experimental cows used for the calculation of greenhouse gas emissions and profitability

FPCM=fat and protein corrected milk yield; DM=dry matter.
1 As calculated by Grandl et al. (Reference Grandl, Luzi, Furger, Zeitz, Leiber, Ortmann, Clauss, Kreuzer and Schwarm2016b).
Greenhouse gas emissions during the experiment and over the entire lifetime
The calculation of GHG emissions for the individual cows followed an LCA approach. An agricultural LCA covers environmental impacts that occur either directly on-farm (i.e. arising on the farm as a consequence of farming activity) or are resulting from off-farm activities along the supply chain of inputs used for farming activities. An LCA comprises four phases: Definition of goal and scope, life cycle inventory, life cycle impact assessment, and interpretation of the LCA results.
Goal and scope
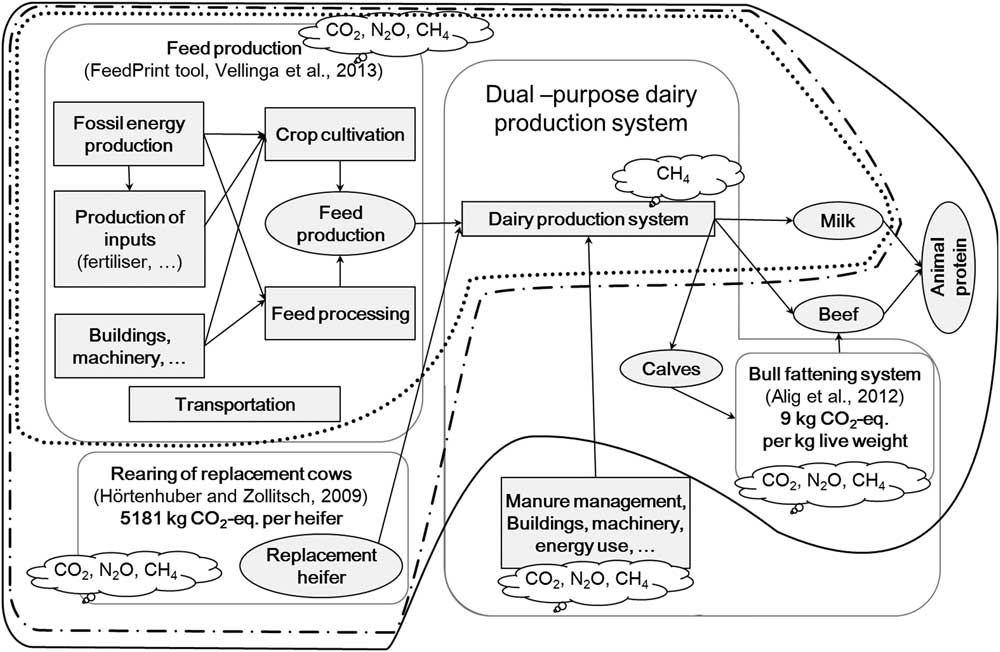
The goal of the study included three steps: First, we investigated the GHG emissions of the cows at their current state of production at the time of the experiment. Second, we assessed lifetime GHG emissions of the experimental cows up to the date of the experiment illustrating the effect of different LPL on emissions per unit of product over the entire LPL. The assessment was performed on the farm level. We applied a simplified farm system model including feed production, rearing and cow emissions as sources of GHG. This simplification was justified because, apart from the diet, all management and housing activities were identical for all animals. Thus, the diverging parameters between the different LPL and the different feeding regimes were covered. In addition, these three sources of emissions account for more than 2/3 of total emissions associated with milk production by dairy cows up to the farm gate (Hörtenhuber and Zollitsch, Reference Hörtenhuber, Lindenthal, Amon, Markut, Kirner and Zollitsch2009). The third step consisted of the calculation of the potential beef output of each case study cow by accounting for their produced offspring and the culled cow meat in addition to the GHG directly originating from milk production. With this system expansion approach, we covered the interaction of beef and milk production. Figure 1 gives an overview of the system boundaries of the three steps.
Interrelationships of processes considered and of the greenhouse gas (GHG) emissions in the different steps of the analysis. Step 1: GHG emissions of the cows at their current state of production at the time of the experiment (considering emissions from feed production and enteric emissions measured at the time of the experiment; dotted line), Step 2: lifetime GHG emissions of the experimental cows up to the date of the experiment (considering emissions from the rearing phase and from feed production and enteric emissions from the first parturition up to at the time of the experiment; dash-dotted line), Step 3: lifetime GHG emissions including the potential beef output of each case study (solid line).

The functional units used in the present study were 1 kg FPCM at the farm gate and 1 kg of edible animal protein (milk protein, meat protein) produced at the farm gate when including the potential beef from the cows. For the amount of milk protein, the routine milk recording data of the experimental cows were used. Meat protein was calculated assuming dressing percentages of 55% and 52% for fattened cattle and cull cows (using measured LW of the experimental cows), respectively, and an average meat protein content of 19% in the part of the carcass edible by humans (calculated by assuming that 74% of the carcass is saleable; Ertl et al., Reference Ertl, Klocker, Hörtenhuber, Knaus and Zollitsch2015).
Life cycle inventory and life cycle impact assessment
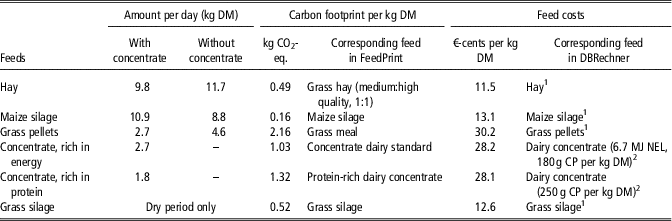
Detailed calculations of GHG based on measured data were made for the dairy cows, whereas literature data were used for the rearing and the fattening stages. The GHG emissions of the production of the individual feeds used for the dairy cows were taken from the FeedPrint tool (Vellinga et al., Reference Vellinga, Blonk, Marinussen, van Zeist, de Boer and Starmans2013). For the analysis of the experimental phase (first step), the actually measured individual intake of each diet component was used (Grandl et al., Reference Grandl, Amelchanka, Furger, Clauss, Zeitz, Kreuzer and Schwarm2016a). The diets consisted of hay, maize silage and artificially dried grass pellets, as well as two types of concentrate for the concentrate-fed cows. The diets for the lactation phase across all lactations for the animals (second step) were taken from the diet records that showed feed amounts offered to the two different groups of cows. The daily amounts of feeds offered and the corresponding carbon footprint of their production are given in Table 2. For the dry periods, across all reproduction cycles, a diet consisting of grass, hay and maize silage supplemented with concentrate (60%, 13%, 20% and 7% of dry matter, respectively) was assumed for cows from both feeding regimes. Thanks to the availability of measured and recorded data, the feed intake data for the dairy cows used for the calculations were based on actual animal and herd-specific data and estimations were only applied for feeding in the dry periods.
Feeds offered to the experimental cows and their assumed carbon footprint (economic allocation, no land use change emissions considered; FeedPrint database, Vellinga et al., Reference Vellinga, Blonk, Marinussen, van Zeist, de Boer and Starmans2013) and costs (according to DBRechner, Bavarian State Research Center for Agriculture (LfL), 2017)

Direct animal emissions were calculated differently in the three steps. For the first step, CH4 emissions measured during the experiment were used. For the second and third step, we calculated the sum of all CH4 emissions of the dairy cows from the beginning of the first lactation using CH4 emissions estimated from the gross energy intakes. The latter were calculated from the amount of feed necessary to produce the lifetime milk yield. We used the CH4 yields (loss of gross energy as CH4 energy, Y m) of 6.42% and 7.26% for cows fed concentrate or no concentrate, respectively, as determined in the experiment (Grandl et al., Reference Grandl, Luzi, Furger, Zeitz, Leiber, Ortmann, Clauss, Kreuzer and Schwarm2016b). For the dry period, we also used as CH4 yield the value 7.26%, as the assumed dry period diet very much resembled the forage-only lactation diet in its analysed nutrient composition. For converting CH4 energy losses into kg of CH4, the standard combustion energy value of 55.5 MJ/kg CH4 was applied. The global warming potential of CH4 (100-year time horizon) was calculated as CO2 equivalents (CO2-eq.) using the Intergovernmental Panel on Climate Change conversion factor of 28 (Myhre et al., Reference Myhre, Shindell, Bréon, Collins, Fuglestvedt, Huang, Koch, Lamarque, Lee, Mendoza, Nakajima, Robock, Stephens, Takemura and Zhang2013).
The aggregated rearing emissions (see Figure 1) included all emissions from animals and emissions of input production up to the first parturition. Rearing emissions were assumed to be equal for all animals amounting to 5181 kg CO2-eq. per first-calving heifer (Hörtenhuber and Zollitsch, Reference Hörtenhuber, Lindenthal, Amon, Markut, Kirner and Zollitsch2009).
The calculation of the GHG emissions from beef production was based on the calculated emissions from beef fattening systems based on calves from dairy systems as described in Alig et al. (Reference Alig, Grandl, Mieleitner, Nemecek and Gaillard2012). Per kg of final LW, 9 kg CO2-eq. were used to calculate the emissions caused by the fattening of the cows’ offspring in the case study. This value also resembled the range described for similar beef production systems in the review of de Vries et al. (Reference de Vries, van Middelaar and de Boer2015). It was assumed that there was no finishing before slaughter for cull cows.
Profitability of dairy cow production systems
Profit for each individual cow was calculated using full cost accounting. Profit is defined as revenues (i.e. receipts from the sale of milk, calves and culled cows) minus variable costs minus fixed costs. The calculation was performed using the online tool LfL DBRechner (full costs calculator) (Bavarian State Research Center for Agriculture (LfL), 2017), which provided a standardized full cost calculation for a typical Brown Swiss dairy cow production system assuming average prices and costs from databases in Bavaria, Germany, of 60 months (July 2012 until July 2017). Individual cow data from the experiment and the herd book were taken where available (Table 1). For all other parameters, default values from the DBRechner tool were used.
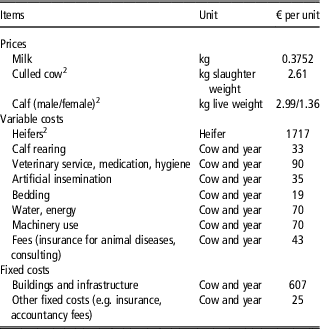
Profit in the present study was expressed as € per cow and year and € per kg of FPCM. Assumptions for prices and costs underlying the full cost calculations are shown in Table 3. We assumed that all calves were sold and all heifers needed for replacement were bought as first-calf heifers at the market. The costs for the feeds are shown in Table 3. The assumptions for feed intake per cow were identical to those used for the GHG emission calculations. Forage costs were taken from the DBRechner, assuming that forages were grown on farm whereas market prices were taken for concentrates using the full cost approach of the DBRechner.
Prices and costsFootnote 1 assumed for the profitability calculation of the dairy cow production system (DBRechner, LfL, 2017)

1 Excl. of imputed costs (labour, own land and capital).
2 Excl. of value-added tax. Marketing fees to be deducted: 21 € per cow, 13 € per calf and 33 € per heifer.
Statistical analysis
The experimental data and the results from the lifetime emission calculations were subjected to parametric regression analyses using R (R Core Team, 2016). The following model was applied:
 $$\eqalignno { Y_{{ijklm}} {\equals} & \mu {\plus}FR_{i} {\plus}\beta _{j} \,\ln \left( {LPL} \right){\plus}\beta _{k} \left( {LPL^{2} } \right) \cr& {\plus}\beta _{l} \left( {\ln \left( {LPL} \right){\times}FR} \right){\plus}\beta _{m} \ln \left( {LW} \right){\plus}{\epsilon}_{{ijklm}} $$
where Yijklm is the individual observation of the respective trait (lifetime production and emissions per animal, emission intensity per unit of FPCM, and profitability per animal); μ the overall mean, FR i the fixed effect of the feeding regime i; βj…m the regression coefficients of the continuous fixed effects of LPL (ln-transformed and squared), of the interaction of LPL and feeding regime (ln(LPL)×FR), and of the covariate ln(LW), and ε ijklm the random residual. Starting from this full model, the Akaike information criterion modified for small sample sizes was used to select the simplest model which at least contained the effect of the feeding regime. If the values of the information criterion differed by <2, the final model was then chosen following the parsimony rule as the one with the least number of coefficients (Symonds and Moussalli, Reference Symonds and Moussalli2011).
Results
Greenhouse gas emissions of the cows at the time of the experiment
The GHG emissions from feed production to cover the daily ration of the lactating cows amounted to 14.7 and 14.6 kg CO2-eq. per day for cows without and with concentrate, respectively. There was no difference in GHG emissions from feed production per kg FPCM between cows of different LPL. Enteric CH4 emissions were greater (P=0.029) without than with concentrate and decreased with increasing LPL (Supplementary Figure S1). Feed production and enteric CH4 equally contributed about 0.4 to 0.5 kg CO2-eq. per kg FPCM to total GHG emissions.
Change in profitability of cows with increasing length of productive life
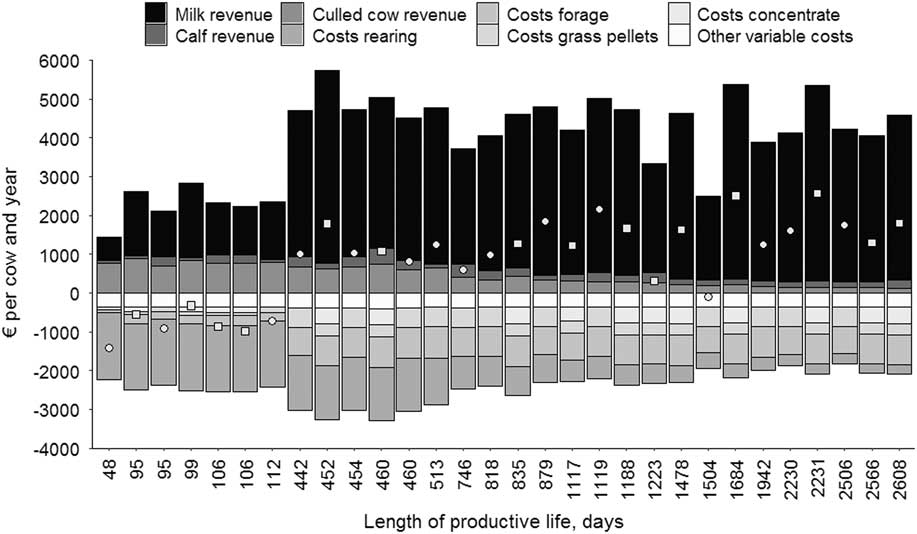
Revenues, costs and profit for individual cows of different LPL are shown in Figure 2. For cows with an LPL of <1 year, a loss was incurred for all investigated cows. The full costs were dominated by costs for replacement heifers (54% to 60% of total full costs). For these cows, revenues from culled cows contributed up to 29% to 53% of total revenues. Cows with an LPL>1 year generated a profit (except for one cow), with a large variation from 314 to 2567 € per cow and year. The cow with an LPL of 4.1 years that incurred an economic loss had a relatively low average milk yield of 5648 kg FPCM/year. Revenues in cows with an LPL>1 year were mainly driven by milk revenues, contributing up to 77% to 94% of total revenues. The contribution of replacement costs decreased continuously from 38% to 9% for cows when LPL increased from 1 to 7 years.
Annual revenues, variable costs (negative scale) and profit (points, □ without concentrate, ○ with concentrate) per individual experimental cow depending on the individual length of productive life.

Milk and beef production and greenhouse gas emissions over the entire lifetime
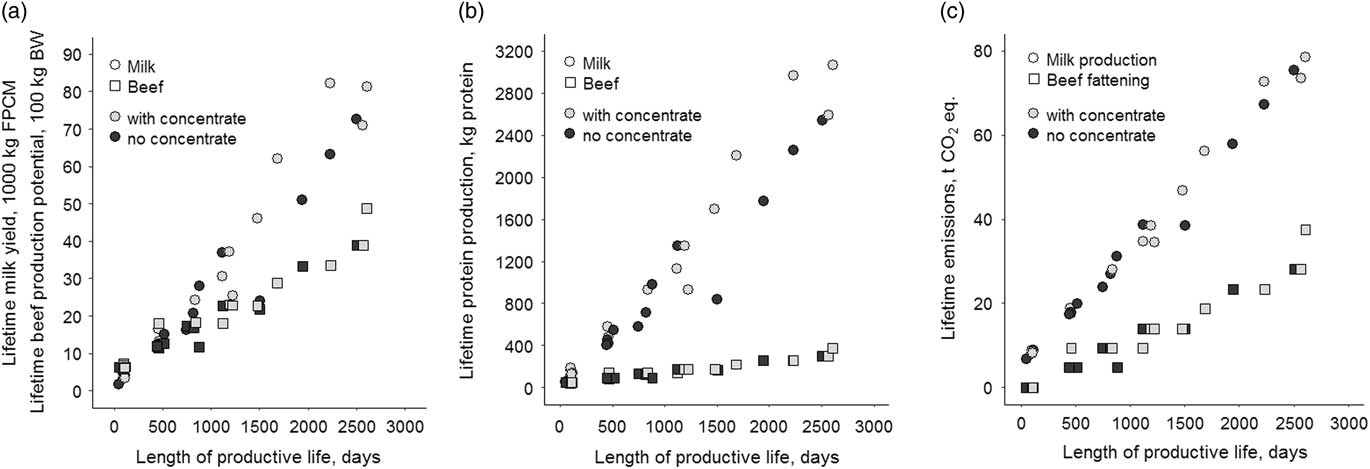
Lifetime production of milk, beef and edible protein increased with LPL (Figure 3a and b). At an increase of 10% in LPL, increases of about 9%, 5% and 8% were observed for FPCM production, beef production, and total edible protein production, respectively. The calculation of the GHG emissions over the entire lifetime comprised emissions of the rearing phase, enteric CH4 emissions as the first calving, and emissions caused by the production of all feeds used as first calving. Rearing emissions equally totalled 5181 kg CO2-eq. for each animal. Lifetime enteric CH4 emissions from the cows ranged from 615 to 30 886 kg CO2-eq., and total emissions from lifetime feed production for the cows ranged from 761 to 39 416 kg CO2-eq. The cumulative lifetime emissions from the cows increased (Figure 3c) at a rate of 6% when LPL increased by 10%. The total lifetime emissions for the calculated fattening of their offspring for each animal also increased with LPL (Figure 3c), this at a rate of 35% when LPL increased by 10%.
(a) Cumulative lifetime production of fat and protein corrected milk (FPCM) and potential beef; (b) cumulative lifetime production of edible animal protein; (c) the corresponding cumulative lifetime emissions from milk production (heifer rearing, feed production, animal emissions) and beef fattening depending on the individual length of productive life of the experimental cows.

Product-related greenhouse gas emissions and profitability
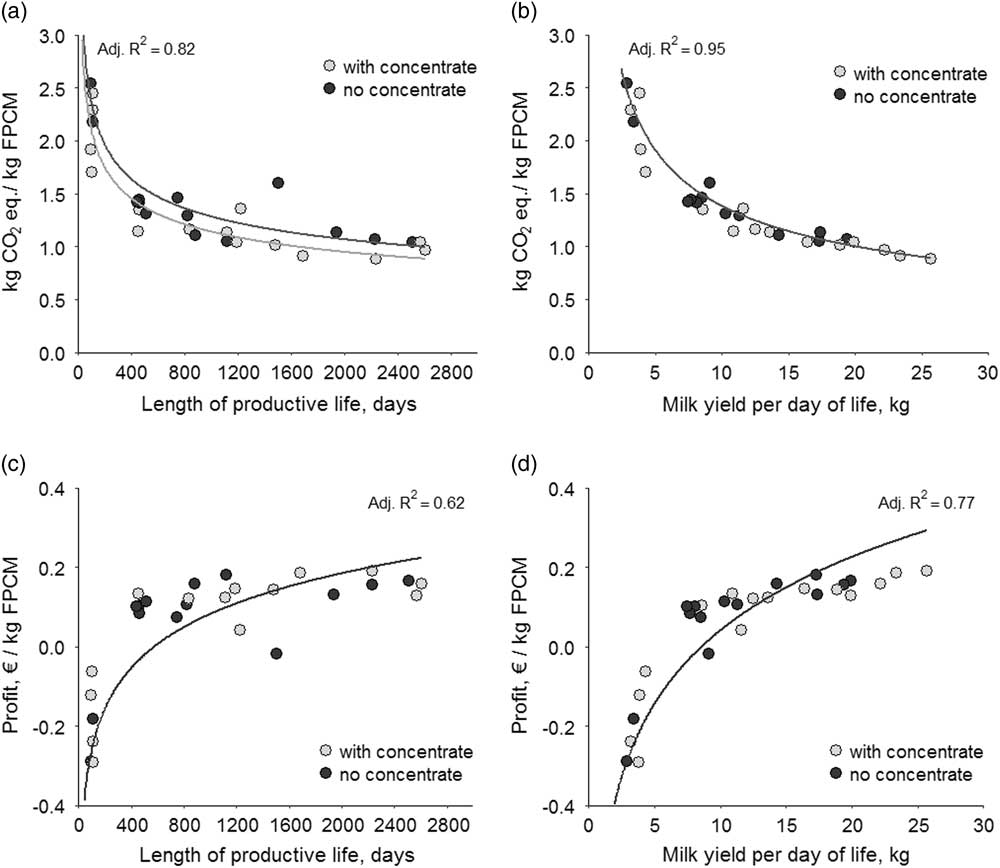
Emission intensity, expressed as lifetime emissions (sum of emissions from the rearing phase, feed production and enteric CH4) per lifetime FPCM production, was negatively (P<0.001) related to the LPL. The decrease with LPL was non-linear with a strong decline for cows with short LPL and a flatter slope towards the end of the observed LPL range (Figure 4a). The same was true when emission intensity was related to the milk yield per day of life (Figure 4b), where a steep decrease in GHG emission intensity was observed up to ~10 kg FPCM per day of life, which levelled out quickly after this threshold of daily lifetime milk yields.
(a) Lifetime greenhouse gas emissions per kg fat and protein corrected milk (FPCM) for the individual experimental cows with different length of productive life and (b) different milk production per day of life; (c) profitability (profit per kg FPCM) for cows with different length of productive life and (d) different milk production per day of life. Regression coefficients for feeding regime (reference level is the feeding regime with concentrate) are 0.118, 0.0375, −0.035 and −0.0113 in (a), (b), (c) and (d), respectively. Regression coefficients are −0.266 and 0.147 for ln(length of productive life) in (a) and (c), and −0.468 and 0.266 for ln(milk yield per day of life) in (b) and (d), respectively.

Profit per kg of FPCM was positively related (P<0.001) to LPL, showing a steep increase up to an LPL of around 400 days (Figure 4c). Beyond this LPL, the increase in profit per kg FPCM was smaller and showed a large variation ranging between −0.02 and 0.19 €/kg FPCM. Profit was also related (P<0.001) to milk yield per day of life (Figure 4d), steeply increasing up to ~10 kg FPCM per day of life and profit values of >0.10 € per kg FPCM.
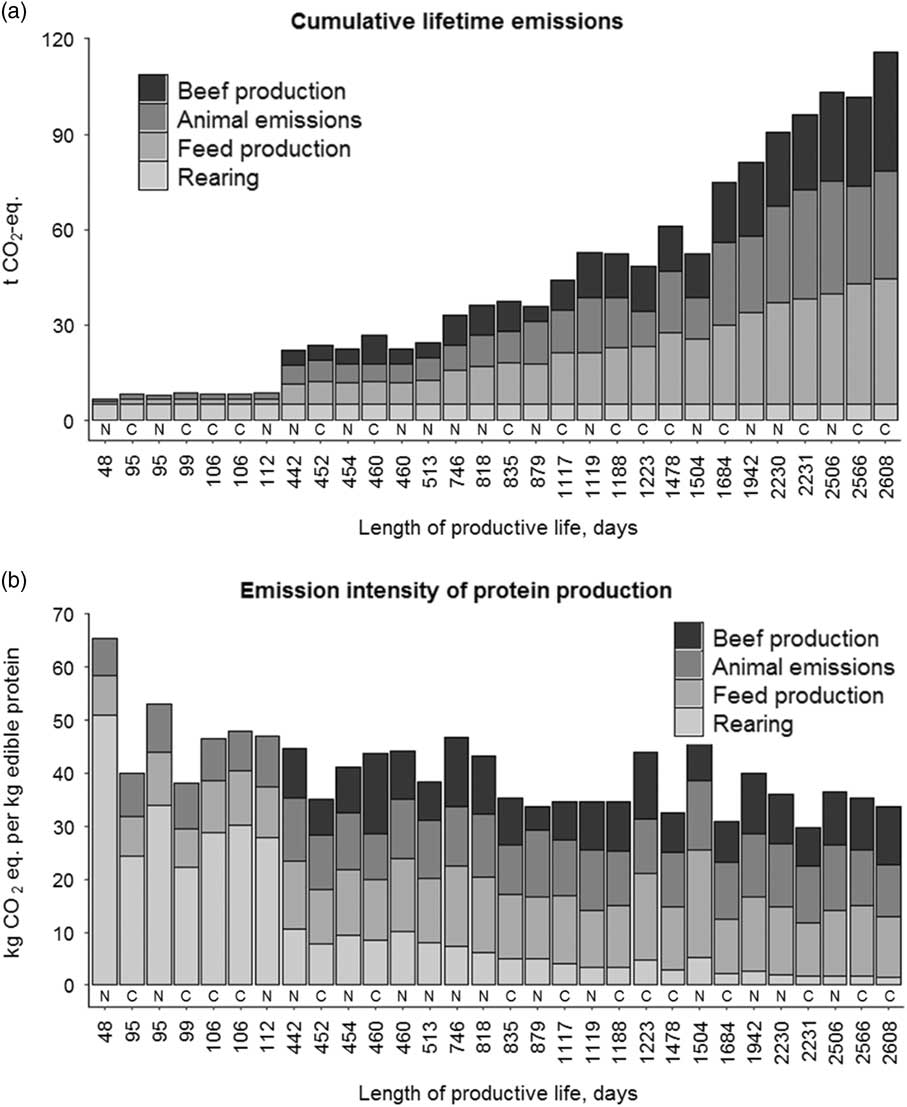
When summing up the emissions per cow from dairy production (rearing, enteric CH4, and feed production) and meat production, the proportion of the total emissions caused by the rearing of replacement animals decreased with increasing LPL from more than 50% to <10% (Figure 5a). Emissions of CH4 and GHG emissions from feed production increased in their proportion with LPL, accounting for more than ⅔ of the total emissions from the third lactation onwards (Figure 5a). Emissions from the beef production activity were more variable than the other emission sources. When total emissions were related to total edible protein produced (including the potential beef produced), proportionate rearing emissions decreased strongly when a short LPL was extended, whereas the decrease was less pronounced in cows with medium and long LPL (Figure 5b). The proportionate emissions of enteric CH4 and feed production increased with LPL whereas the proportionate emissions from beef fattening decreased (Figure 5b). The total emission intensity per unit of protein decreased by almost 50% from the youngest to the oldest cows.
(a) Cumulative lifetime greenhouse gas emissions from milk and potential beef production and (b) greenhouse gas emissions per kg of edible protein depending on the individual length of the productive life of the experimental cows with (C) and without (N) concentrate in the diet.

Discussion
The present study utilized a data set of variables measured experimentally and individually in cows covering a wide age spectrum. We identified changing cow characteristics associated with age and LPL in the experiment (Grandl et al., Reference Grandl, Amelchanka, Furger, Clauss, Zeitz, Kreuzer and Schwarm2016a and 2016b). Thus, the aim was to investigate the effects of differences in LPL on the GHG emissions and profitability of the milk production system. To this end, we calculated a simplified GHG balance and the profit for the current (i.e. at the time of the experiment) production situation and the lifetime production and GHG emissions. We did not consider other emission sources apart from enteric CH4, emissions associated with feed production and the rearing phase. Especially emissions from manure during storage and distribution can be an important source of GHG in livestock production systems (Rotz, Reference Rotz2017). It is, however, unlikely that emissions from manure largely differ with the age of the animals. Therefore, although this simplified approach introduces some inaccuracy by omitting manure emissions of the dairy cow system, variation caused by different LPL were widely covered with our approach. We included the associated emissions of the potential beef production to the lifetime-related calculations. Differences between the two cows groups receiving either no or a limited amount of concentrate, although being distinguished and displayed, are not discussed as these were – probably due to the substantial amount of grass pellets in the diet – mostly very small as diets and performance of the cows did not diverge greatly. We also assumed that rearing emissions were equal for all animals in order to avoid that differences caused by the rearing phase affect the performance determined by the productive life of the cows. It is, however, obvious that the long rearing phase modelled in the case study increased the burden of emissions from the rearing phase, and reducing the length of the rearing phase might be a valid system option.
Greenhouse gas emissions associated with milk production at the time of the experiment
The effect of LPL on the GHG emissions associated with milk production was solely relying on the enteric CH4 emissions as feed provision was identical for cows of all ages and the small differences in actual feed intake did not result in an age-related change of emissions from feed production. Therefore, the GHG emission intensity of the milk produced at the time of the experiment was greatest in cows with short and medium LPL, similar to those of enteric CH4 alone (Grandl et al., Reference Grandl, Luzi, Furger, Zeitz, Leiber, Ortmann, Clauss, Kreuzer and Schwarm2016b). The combined emissions from feed production and enteric CH4 were in the range of 0.70 to 1.15 kg CO2-eq. per kg FPCM. The corresponding combined emissions calculated by Van Middelaar et al. (Reference Van Middelaar, Dijkstra, Berentsen and de Boer2014) for modelled farm systems were in the range of 0.59 to 0.62 kg CO2-eq. per kg FPCM. Ross et al. (Reference Ross, Topp, Ennos and Chagunda2017) calculated GHG emissions of a Scottish research herd in a range between 0.83 and 1.10 kg CO2-eq. per kg energy-corrected milk. The GHG emission intensity calculated in the present study, based on animal and feed production emissions, is comparatively high, although only the lactating cows were considered. The production level is in the range of the other studies, but the diet characteristics (large forage proportion, considerable amounts of grass pellets) are likely to result in greater emissions both from feed production and from enteric fermentation than in the other systems.
Methane emissions alone show less variation among LCA studies for milk production. For example, Flysjö et al. (Reference Flysjö, Cederberg, Henriksson and Ledgard2011) calculated a difference of only ~0.1 kg CO2-eq. per kg energy-corrected milk, this even in rather contrasting systems (milk produced in Sweden v. New Zealand). Different from that, in the present study the measured individual cow CH4 emissions per kg FPCM varied considerably, ranging from 0.27 to 0.55 kg CO2-eq. per kg FPCM. However, more variation can be expected from individual animal data compared with herd data or modelled systems (Garnsworthy et al., Reference Garnsworthy, Craigon, Hernandez-Medrano and Saunders2012).
Greenhouse gas emissions from milk and beef production over the entire lifetime
Cumulated lifetime production of milk and beef increased almost linearly with age. The same was true for the cumulated lifetime emissions from feed production and enteric CH4. Emissions associated with rearing were fixed; thus the average fixed emissions per unit of FPCM decreased with increasing LPL. Although curvilinear changes in CH4 production with age were identified in the cows (Grandl et al., Reference Grandl, Luzi, Furger, Zeitz, Leiber, Ortmann, Clauss, Kreuzer and Schwarm2016b), the lifetime CH4 emissions were calculated with a constant Y m across all ages. As most cows are expected to undergo such a development of Y m across several lactations, this effect levels out. Finally, compared with the large importance of the proportion of rearing replacement animals in this calculation, the direct age effect on enteric CH4 emissions was minor and thus deemed negligible for the further interpretation of the results in terms of the considerations across the entire LPL.
The main effect of age on the average GHG emissions per kg FPCM over the entire lifetime was the decrease in the fixed emissions from rearing. This resulted in the characteristic hyperbolic shape of the curves (c.f. Figure 4a and b), caused by the fixed amount of emissions from rearing being allocated to an increasing amount of milk. Accordingly, the decrease in average emissions with age was particularly steep in the younger cows with <5 kg FPCM per day of life, whereas it levelled out in older cows with>10 to 15 kg FPCM per day of life. Thus, prolonging LPL is particularly efficient in the cows with small amounts of milk produced per day of life. The great impact of LPL on the GHG emissions from milk production was already pointed out by Zehetmeier et al. (Reference Zehetmeier, Hoffmann, Sauer, Hofmann, Dorfner and O’Brien2014). Bell et al. (Reference Bell, Garnsworthy, Stott and Pryce2015) also showed the positive effect of an improved survival by simulations of improvement of fitness traits in the UK.
When the emissions of the potential beef production were added to GHG emissions from rearing, feed production and enteric CH4, absolute emissions increased with LPL because more offspring was fattened per cow. However, there was still a decrease with LPL of the cows in system emission intensity, when CO2-eq. was related to the total edible protein produced. This development was largely linear with age and not hyperbolic like with emissions per kg FPCM (Supplementary Figure S2) because primiparous cows were not yet burdened with emissions from fattening of their offspring.
There were some remarkable differences between individuals, which were directly related to the individual history of the animals. Cows with constantly low milk yield, like the cow with an LPL of 1504 days, had a comparatively high emission intensity; the opposite was true for the cow with an LPL of 2231 days with a high lifetime milk yield (Figure 4b). Another factor of influence is offspring, as can be seen when comparing the cows with an LPL of 2566 days and 2231 days. Both cows had a very similar lifetime milk yield, but the first had one additional calving and two twin births, that is, produced three additional calves, which resulted in distinctively greater absolute emissions from beef production. These individual fluctuations between cows in the individual environmental performance would not be detected in modelled systems using herd averages for calculations. The individual variability underlines the importance of traits like fertility, or more generally, of high productivity at high levels of fitness (as discussed, e.g. in Bell et al., Reference Bell, Garnsworthy, Stott and Pryce2015). However, when the system is expanded to include potential beef production, there is some trade-off between fecundity and GHG emissions. Although regularly calving is essential for efficient milk production by avoiding unproductive phases at long calving intervals, the overall emissions intensity per unit of protein of the combined dairy and beef system increases, when the proportion of protein from meat becomes greater. In the present study, we used human edible protein to account as the functional for both milk and beef output of dairy cow production systems in order to get an insight into the interrelationships of the dual-purpose aspect of dairy production. Different methods are described in the literature to account for the co-product beef of dairy cow production systems (e.g. Flysjö et al., Reference Flysjö, Henriksson, Cederberg, Ledgard and Englund2012). The methods applied can greatly influence the results. Thus, interrelationships between co-product handling and the impact of longevity or other production trait changes in dairy systems on GHG emissions should be the subject of future research.
Profitability of milk production considering the entire lifetime
We calculated profit using a full cost approach to assess differences in profitability of the cows belonging to the data set. In the present study, some 70% of the first lactating cows were not able to amortize replacement costs. Based on data from 101 dairy farms, Boulton et al. (Reference Boulton, Rushton and Wathes2017) found that heifer rearing costs were paid back on average with at least 530±293 days after first calving. This translates into ~1.5 lactations before heifers began to become profitable for the farm. In our study, based on few animals, this turning point was reached at an earlier LPL. The number of days of LPL of the cows investigated had a strong impact on profit per kg FPCM for those cows that did not finish their first lactation. For cows with an LPL of more than one lactation, the slope of increase of profit per kg FPCM with longer LPL was less pronounced.
In order to adjust for influences of either milk yield or LPL, milk yield per day of life was investigated. This indicator reflects also lifetime efficiency for milk production of individual cows. Profit per kg lifetime FPCM was indeed closely related to milk yield per day of the life of the dairy cows investigated. This is consistent with findings by Eilers (Reference Eilers2014) and Horn et al. (Reference Horn, Knaus, Kirner and Steinwidder2012). Horn et al. (Reference Horn, Knaus, Kirner and Steinwidder2012) showed that milk yield per day of life needs to be at least 5 to 10 kg to cover the full costs of dairy production systems, and Eilers (Reference Eilers2014) concluded that milk yield per day of life needs to exceed 11 kg per cow to cover total costs of dairy farms in South-West Germany. These results are consistent with the observations of the present study, where the profitable cows produced at least 7.5 kg FPCM per day of life. However, such results are highly dependent on assumptions like milk price, costs for replacement heifers and beef price. For instance, in the present study, an increase of costs for heifers by 10% resulted in a calculated decrease of profit per kg FPCM from 12% up to 52% for cows not finishing the first lactation.
A potential limitation of the profitability assessment in the current study is the exclusion of opportunity costs of missed performance. The genetic merit of replacement heifers likely exceeds the genetic merit of the cow to be replaced (De Vries, Reference De Vries2017). This implies that increasing the longevity of cows leads to opportunity costs of the forgone revenues from the additional genetic merit of the replacement heifer. However, the impact on the results of the present study is judged to be minor for several reasons. First, De Vries (Reference De Vries2017) concludes that economic longevity depends more on cow depreciation than on the accelerated genetic improvements through heifers. Second, when we compared the breeding values of the animals of the present study using the national herd book database (personal communication Braunvieh Schweiz), there was no age trend in total merit index, milk index and fitness index (data not shown), i.e. the experimental animals were genetically quite similar with regard to the indices. Still it is a topic for further investigations whether genetic variation for characteristics of the cows included in the present study is not covered by these indices and whether opportunity costs of missed performance other than milk yield exist.
Conclusions
In the present study, we investigated the GHG emission intensity and profitability of dairy cows of different productive lifetime fed no or small amounts of concentrate. This showed that increasing the LPL of dairy cows is a viable way to reduce the environmental impact and to improve the profitability of dairy production. In particular, reducing the proportion of cows that leave the herd before finishing their first lactation could result in a substantial improvement with regard to the GHG emissions per unit of food produced and profitability of dairy herds. In the age range covered by the present study, the improvement in environmental and economic performance levelled out in the oldest cows. Future investigations have to show if there are negative consequences of aging that prevent a further increase in LPL.
Acknowledgements
The authors gratefully acknowledge the help of the institutions and numerous persons involved in the experiment, especially at Plantahof (A. Accola, D. Balestra, C. Brandenburger, K. Freuler, J. Jenewein, P. Küchler), Agrovet-Strickhof (M. Hunziker, H. Renfer, S. Rinderknecht, U. Voegeli) and at ETH Zurich (C. Kunz, S. Marquardt, M. Mergani, R. Messikommer, A. Schwarm, P. Stirnemann, E. Wenk). The project was supported by the Mercator Research Program of the ETH Zurich World Food System Center.
Declaration of interest
The authors declare no conflicts of interest.
Ethics statement
The animal experiment was approved by the veterinary office of the Swiss Canton of Zurich (149/2013).
Software and data repository resources
None.
Supplementary material
To view supplementary material for this article, please visit https://doi.org/10.1017/S175173111800112X