I. INTRODUCTION
Tantalum oxide (TaO) and hafnium oxide (HfO) films have proven very useful as boundary layers to allow the deposition of strongly adherent metallic films onto Si semiconductor device wafers. Recently, HfO films in which the HfO exhibits an exceptionally high dielectric constant have proven enabling for the fabrication of 45-nm vs. otherwise 65-nm linewidth semiconductor circuits (Royal Society of Chemistry, 2007). Ta, Hf, TaO and HfO films have been made by sputtering the respective element in either argon or oxygen onto heated Si device wafers. The thicknesses of the films have been measured by three methods. The first method uses X-ray reflectivity of the films as deposited onto Si device wafers. This method gives a thickness measurement that is independent of the film composition. The second method uses the simultaneous X-ray fluorescence count accumulation of the Ta or Hf elements. The film layers investigated are relatively thin so that the matrix effects are minimal. The third method uses the fact that films of these materials are relatively good absorbers of the Si Kα X-ray fluorescence line as excited from the underlying Si substrate.
II. EXPERIMENTAL
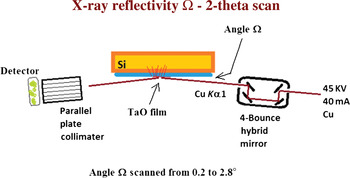
X-ray reflectivity data have been collected using a Panalytical Materials Research Diffractometer equipped with a Cu tube operated at 45 kV and 40 mA. A 4-bounce hybrid X-ray mirror was used as an incident beam monochrometer. A parallel plate diffracted beam optic was used for data collection using Ω − 2θ scans. The geometry for the reflectivity scans is illustrated in Figure 1.
(Color online) The Panalytical MRD X-ray optics used for X-ray reflectivity measurements.

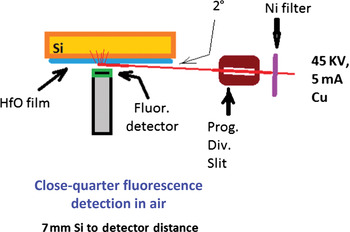
A key aspect of these studies is that glancing incident X-ray irradiation using a Panalytical Materials Research Diffractometer equipped with a programmable divergence slit has been used to precisely collimate the X-ray fluorescence excitation source. In these studies, the glancing angle Ω was set at 2°. A Cu anode X-ray tube with a Ni Cu Kβ filter operated at 45 kV and 5 mA was used for fluorescence excitation. A Peltier cooled Amptek XR-100T energy dispersive X-ray fluorescence detector placed 7 mm directly in front of the Si substrate in normal atmospheric air has been used for fluorescence count data collection. The geometry used for the fluorescence measurements is illustrated in Figure 2. The Si substrates are polished (100) P-type semiconductor wafers that are very smooth and flat so that the geometry is well defined without hitting the fluorescence detector with the primary excitation beam. The films deposited onto the Si substrates then attenuate by one perpendicular film thickness the Si Kα flux excited by the primary beam in the substrate. If one knows the mass absorption coefficient and density of the film layer then the film thickness can in principle be precisely measured by measuring the Si Kα attenuation of the film.
(Color online) The X-ray geometry used for the X-ray fluorescence measurements.

The Ta and Hf containing films were DC magnetron sputtered using a 3″ MightyMak US Inc. sputtering source. The elemental films of Ta and Hf were sputtered using 12 mTorr of Ar at 3 kV onto 350 °C Si substrates. The oxygen containing films were sputtered using 36 mTorr of pure O2 at 3 kV onto 350 °C Si substrates.
III. RESULTS AND DISCUSSION
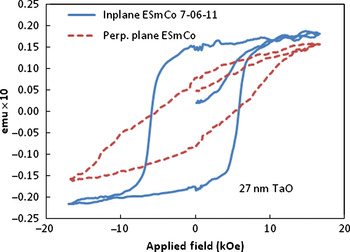
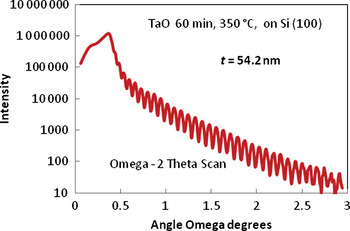
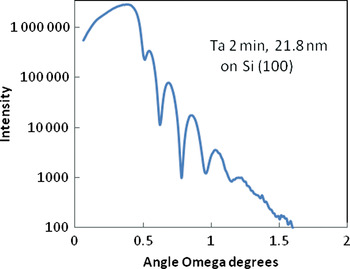
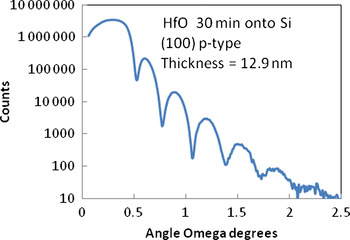
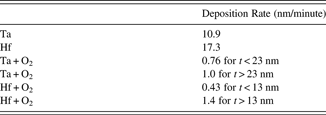
The boundary layers of TaO and HfO on Si (100) device wafers have been used as substrates for these studies, for the deposition of SmCo-based permanent magnet films. An example of a SmCo-based film deposited onto a Si (100) substrate precoated with a 27-nm-thick Ta2O5 boundary layer is shown in Figure 3. The in-plane intrinsic coercivity is about 6 kOe, which is sufficient for many thin film device applications. The development of crystal texturing in the sputtered permanent magnet films has been previously reported by Cadieu (Reference Cadieu1992, Reference Cadieu, Douglas Adam and Francombe2000) and Cadieu et al. (Reference Cadieu, Vander, Rong and Zuneska2011). In this paper, the primary focus is on the boundary layer films of TaO and HfO that facilitate the growth of the magnetic films onto the Si single crystal substrates. An example of a reflectivity measurement for a TaO film made by DC sputtering Ta in 36 mTorr of O2 for a Si substrate temperature of 350 °C is shown in Figure 4. The thickness of the TaO film layer was determined using the Period function of Panalytical Wingixa. In this case, the use of a period over 20 fringes gives an estimated thickness of 54.2 ± 0.1 nm. Figure 5 shows the reflectivity fringing for a Ta film deposited in 12 mTorr Ar for a Si substrate temperature of 350 °C. Figure 6 shows the reflectivity fringing for an HfO film made by sputtering Hf in 36 mTorr O2 on Si at 350 °C. Each of these films was made by magnetron sputtering with an applied voltage of 3 kV. Table I shows the relative growth rate for Ta, Hf, TaO and HfO films. The oxide films show a determined change in film accumulation rate at a thickness of 23 nm for the TaO films and at a thickness of 13 nm for the HfO films. Whether this change is because of a different oxide formation or a transition from an amorphous to more crystalline deposit has not yet been determined. It should be noted that the relative accumulation rates for pure Ta and Hf films are exactly as expected from the relative sputtering coefficients for Ta and Hf.
(Color online) Magnetic hysteresis loops measured in the film plane and perpendicular to the film plane are shown for a SmCo-based film deposited onto a Si substrate sputter coated with a 27-nm-thick TaO film layer. This film was sputtered from a set of SmCo targets enriched in Sm so that the Sm content in the resultant film was in the desired range.

(Color online) An X-ray reflectivity scan for a TaO film made by sputtering Ta in 36 mTorr of pure O2 onto a Si (100) substrate.

(Color online) An X-ray reflectivity scan for a Ta film made by sputtering Ta in 12 mTorr pure Ar.

(Color online) An X-ray reflectivity scan for a HfO film made by sputtering Hf in 36 mTorr pure O2.

The film deposition rates for Ta and Hf films grown at 12 mTorr Ar, 3 kV DC magnetron sputtering onto 350 °C Si, and for TaO and HfO films grown at 36 mTorr O2 onto 350 °C Si.

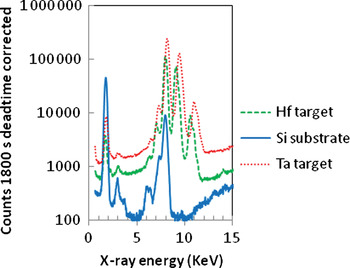
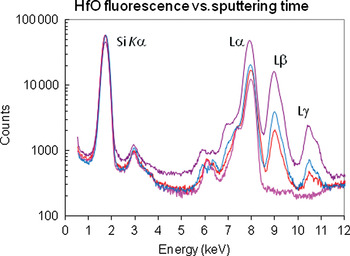
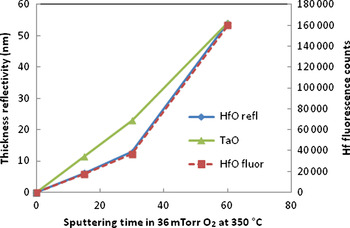
Figure 7 shows X-ray fluorescence counts collected from the Ta and Hf bulk sputtering targets and from a bare Si substrate. The use of a Ni Cu Kβ filter in the primary beam allowed the Ta and Hf Lβ to be present without any overlap from other peaks. The Ta and Hf M lines do overlap with the Si Kα peaks but are relatively weak because the Ta and Hf M lines can only escape from a relatively thin surface layer of these bulk targets. Figure 8 shows X-ray fluorescence counts collected from HfO thin films that were sputtered in O2 for times of 0 (bare Si), 15, 30, and 60 min. The Hf Lβ has no overlap with any peaks from the bare Si substrate and the relative counts for this peak are expected to be proportional to the film thickness for sufficiently thin films. Figure 9 shows the film thicknesses as determined from the reflectivity measurements on the left axis vs. film sputtering time. The right vertical axis shows the Hf Lβ fluorescence counts vs. sputtering time. The thickness values determined from the X-ray reflectivity measurements and the Hf Lβ fluorescence are precisely scalable. This shows that once the fluorescence counts are calibrated, the reflectivity measurements and the fluorescence counts can equally be used to measure film thickness values.
(Color online) X-ray fluorescence data collections from a bare Si substrate and from Hf and Ta sputtering targets as excited in glancing incidence using a Cu tube with a Ni Cu Kβ filter operated at 45 kV and 5 mA.

(Color online) X-ray fluorescence data collections for HfO films sputtered for 0, 15, 30, and 60 min onto Si using the same excitation as in Figure 7.

(Color online) Film thicknesses as measured by X-ray reflectivity vs. sputtering time are shown on the left vertical axis for HfO and TaO films. The right vertical axis shows Hf fluorescence counts vs. sputtering time. The film thickness values measured by X-ray reflectivity are precisely scalable with the accumulated Hf fluorescence counts.

In the glancing incident, fluorescence excitation employed here the primary X-ray beam excites Si Kα fluorescence which is then attenuated by the film thickness before reaching the X-ray fluorescence detector. The distance from the film surface to the detector has by design been made very short so that atmospheric absorption of the Si Kα radiation can be neglected. The formula for this attenuation is particularly simple and just involves one perpendicular transmission through the film deposited onto the Si substrate.

where μ is the mass absorption coefficient, mac, of the film for Si Kα radiation, ρ is the film density, and t is the film thickness. In principle, if the mac for Si Kα and the film density are known, the film thickness can be determined from a simple measurement of the relative Si Kα attenuation by the film that was deposited onto the Si substrate. For the thin films considered here, the relative excitation of the Si Kα occurs over a greater substrate depth than that of the film thickness so that the relative excitation of the Ta or Hf M radiation should be small compared to the Si Kα excitation yield.
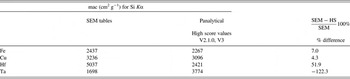
Unfortunately two complications arise in applying this simple formula. One is that the mac values for Si Kα radiation for Ta and Hf obtained from different sources differ greatly. The second is that the Ta and Hf M lines have energies very close to that of Si Kα so that some intensity corrections although believed small for thin films, become increasingly important for slightly thicker films. Table II indicates the mac values obtained from two different sources.
The mass absorption coefficients, mac, for Si Kα radiation for Fe, Cu, Hf, and Ta as obtained from two different sources are indicated. SEM table values are from Goldstein et al. (Reference Goldstein, Newbury, Joy, Lyman, Echin, Lifshin, Sawyer and Michael2003). Panalytical values were obtained using Panalytical High Score X-Ray Analysis Software V2.1.0, which are identical to those given by V3.

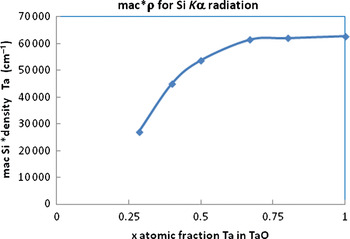
The mac values from these two sources for the commonly analyzed elements Fe and Cu agree to within less than 10%, but the respective values for Hf and Ta differ by a factor of ≈2. The relevant factor for absorption is the product mac*ρ (density). Figure 10 illustrates that the product mac*ρ can be expected to vary over a wide range of about a factor of 3 for the different known Ta oxides. To construct Figure 10 values of mac for the different Ta oxides were computed using the mac calculator tool in Panalytical High Score. The respective densities of the known Ta oxides were obtained from the respective PDF records for the different oxides. Even though the exact values of mac obtained from High Score may be unconfirmed, the total variation of mac*ρ over a factor of about 3 for the different oxides is probably reasonable. In principle, then, measurements of the Si Kα attenuation vs. film thickness can be used to determine a mac*ρ product and hence a level of oxygenation of the films. Figure 10 shows the calculated mac for Si Kα times the respective density for TaO systems. A value of 60 000 cm−1 roughly corresponds to pure Ta films, while a value of 30 000 cm−1 corresponds to Ta2O5. The mac values for this figure were obtained using the Panalytical High Score X-Ray Analysis software V2.1.0. The densities for the different TaO oxides were obtained from the densities reported on the respective TaO PDF records.
(Color online) The calculated mac for Si Kα times the respective density for Ta x O1− x systems.

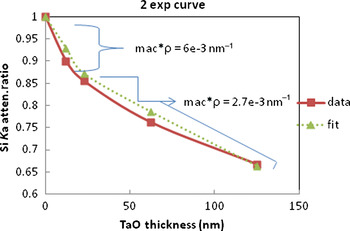
The measurements of the Si Kα radiation from the substrate attenuation ratios are shown in Figure 11 for a series of TaO films with different thicknesses. Films <23 nm in thickness can best be fit by a relatively large mac*ρ = 6 × 10⁻³ nm−1 = 6 × 104 cm−1. Films with thicknesses >23 nm to at least 125 nm thickness can best be fit by mac*ρ = 2.7 × 10⁻³ nm−1 = 2.7 × 104 cm−1. Comparing these results to Figure 10 indicates that the thinner films are mostly metallic Ta and do not fully oxidize until the films reach a thickness >23 nm.
(Color online) The Si Kα attenuation ratio for a series of TaO films of different thicknesses is shown. The dashed curve shows a composite fit for two exponential regions.

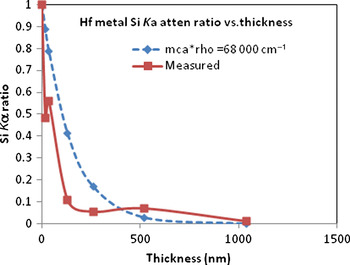
Figure 12 shows the attenuation of the Si Kα radiation for a series of metallic Hf films made by sputtering Hf in 12 mTorr of pure Ar. The very rapid decrease in the Si Kα intensity ratio indicates that the mac value for Hf assuming a density of 13.3 g cm−3 is at least as large as that given by Goldstein et al. (Reference Goldstein, Newbury, Joy, Lyman, Echin, Lifshin, Sawyer and Michael2003), but certainly larger than that given by Panalytical High Score.
(Color online) The Si Kα attenuation ratio for a series of Hf films of different thicknesses is shown. The dashed curve shows the expected attenuation ratio for a mac*ρ value of 6.8 × 104 cm−1.

IV. CONCLUSION
X-ray reflectivity and X-ray fluorescence counts have been shown to give precisely scalable film thickness values for TaO and HfO for thicknesses from a few to at least 125 nm thickness range. X-ray reflectivity although relatively expensive at about $300K gives thickness values that are independent of the chemical composition. A drawback is that in general smooth single crystal substrates are required to give reasonable interference fringes. X-ray fluorescence requires thickness standards, but has two advantages over X-ray reflectivity: (i) a fluorescence detector and counting system can be obtained relatively cheaply for about $10K and (ii) fluorescence counting can be done for cheaper substrates such as glass and metal substrates. It was also shown that the initial growth of TaO and HfO proceeds at a different rate than the subsequent growth for the same sputtering conditions. For the sputtering conditions used here of 36 mTorr O2 and a substrate temperature of 350 °C, the change over occurred at a film thickness of 13 nm for HfO films and at 23 nm for TaO films. The change over thickness is expected to be temperature-dependent, but this aspect has yet to be shown. The initial growth mode corresponds to a greater mac value than the subsequent growth. The mass absorption values reported for Ta and Hf differ greatly as reported by different methods. Some of these differences may be because of measurements being made on thin films in the initial growth mode vs. values for slightly thicker films. Our measurements indicate that the mac value for Hf is substantially greater than that for Ta films. This is consistent with the values reported by Goldstein et al. (Reference Goldstein, Newbury, Joy, Lyman, Echin, Lifshin, Sawyer and Michael2003).