I. INTRODUCTION
For years the main focus point of radio frequency(RF) power amplifier (PA) design for wireless infrastructure applications has been to achieve the highest possible efficiency. This is achieved both by new amplifier concepts, like switch mode power amplifiers, as well as by new technologies, like GaN, that offer higher efficiencies than silicon devices. More recently, the growing data rates in modern wireless communication systems have led to increased requirements on instantaneous bandwidth of RF PA. This raises the question what will happen to the hard-won efficiency if the signal bandwidth will grow. Intuitively one would expect that the efficiency goes down if the signal bandwidth is increased. A good metric to describe this is the efficiency bandwidth in analogy to the well-known gain bandwidth of an amplifier.
To the author's knowledge there exists no formal definition of efficiency bandwidth for a power amplifier. However, when efficiency bandwidth is reported it is usually defined by sweeping a single tone CW signal over frequency and determining the band edges at which the efficiency is reduced with a certain amount compared to the efficiency at the center frequency [Reference Qureshi, Pelk, Marchetti, Neo, Gajadharsing, Van Der Heijden and De Vreede1]. In this paper, however, we propose a definition of efficiency bandwidth that is relevant for wideband modulated signals. This efficiency bandwidth is defined as the signal bandwidth at which the amplifier efficiency has dropped to a level of 90% of the maximum efficiency at small bandwidth. The efficiency bandwidth can be measured or simulated using a modulated signal and measuring the average PA efficiency as a function of the signal bandwidth. The signal bandwidth equals the efficiency bandwidth when the average PA efficiency reaches 90% of the average efficiency obtained with a signal of zero bandwidth.
In this paper we will address the concept of this efficiency bandwidth, show how it can be simulated or measured and apply this to some simple examples. In Section II the efficiency of a signal with zero bandwidth is treated, because that sets the highest achievable PA efficiency. In Section III a complex modulated signal of variable bandwidth is emulated using a sum of multiple tones, which are equally spaced in frequency and have randomized phases. This signal is applied in an example of a simple Class-B amplifier in Section IV, for which we demonstrate how to derive the efficiency bandwidth theoretically. Sections V and VI will extend the examples with an idealized asymmetrical Doherty PA and an outphasing Chireix PA, respectively. We will show that the outphasing PA, using a quarter-λ transmission line combiner, is severely limited in efficiency bandwidth compared with the Doherty amplifier. This is due to the frequency limiting quarter-λ lines as well as to the way the output signals are combined. The influence of realistic transistor output capacitances is shown for the asymmetrical Doherty amplifier in Section V.
II. PA EFFICIENCY OF A SIGNAL WITH SMALL BANDWIDTH
The PA efficiency of a zero bandwidth signal is obtained by determining, either by measurements or simulations, the efficiency η as a function of output amplitude x using a single tone signal at the center frequency. We need to know the probability density function p(x) of the modulated output amplitude that describes the probability p(x)dx for the signal to have an amplitude between x and x + dx. The efficiency is defined as:
 $$\eta (x) = \displaystyle{{P_{RF} (x)} \over {P_{RF} (x) + P_{diss} (x)}},$$
where P RF(x) is the output power and P diss(x) the power dissipated by the PA. Rewriting this we get:
 $$P_{diss} (x) = P_{RF} (x)\left( {\displaystyle{1 \over {\eta (x)}} - 1} \right).$$
Averaging over all amplitude levels gives the average dissipated power  $\overline {P_{diss}} $:
 $$\eqalign{\overline {P_{diss}} & = \int\limits_0^\infty {P_{diss} (x)p(x)dx = \int\limits_0^\infty {\displaystyle{{P_{RF} (x)p(x)dx} \over {\eta (x)}}}} \cr & - \int\limits_0^\infty {P_{RF} (x)p(x)dx =} \int\limits_0^\infty {\displaystyle{{P_{RF} (x)p(x)dx} \over {\eta (x)}}} - \overline {P_{RF}}.} $$
The average efficiency is obtained by:
 $$\overline \eta ^P = \displaystyle{{\overline {P_{RF}}} \over {\overline {P_{RF}} + \overline {P_{diss}}}} = \displaystyle{{\int\limits_0^\infty {P_{RF} (x)p(x)dx}} \over {\int\limits_0^\infty {\displaystyle{{P_{RF} (x)} \over {\eta (x)}}p(x)dx}}}.$$
The symbol  $\overline {\eta}^{P}$ means efficiency averaged over output power.
In any practical realization the output amplitude will be maximized to x max, e.g. by signal clipping during digital signal processing or by output power limitations of the RF amplifier. In this paper we will therefore normalize the peak amplitude by always taking x max = 1.
Since the simulations or measurements are done using a single tone, the signal has by definition zero bandwidth. For many complex modulated signals the real and imaginary parts are Gaussian distributed. Therefore the probability density function p(x) for the amplitude is given by a Rayleigh distribution:
 $$R(x) = \displaystyle{x \over {\sigma ^2}} e^{ - x^2 /2\sigma ^2}.$$
Note that this distribution has no upper limit for x. Introducing x max = 1 as the upper limit to x, we have to normalize the distribution such that its total integrated probability over x between x = 0 and x = 1 equals 1. We then obtain:
 $$p(x) = \displaystyle{x \over {(1 - e^{ - 1/2\sigma ^2} )\sigma ^2}} e^{ - x^2 /2\sigma ^2}.$$
Assuming that the output power is proportional to x 2, the average power is given by:
 $$\eqalign{&\int\limits_0^\infty {P_{RF} (x)p(x)dx} = \int\limits_0^1 {\displaystyle{{x^3} \over {(1 - e^{ - 1/2\sigma ^2} )\sigma ^2}} e^{ - x^2 /2\sigma ^2}} dx \cr & \quad = 1 + 2\sigma ^2 + \displaystyle{1 \over {e^{ - 1/2\sigma ^2} - 1}}.}$$
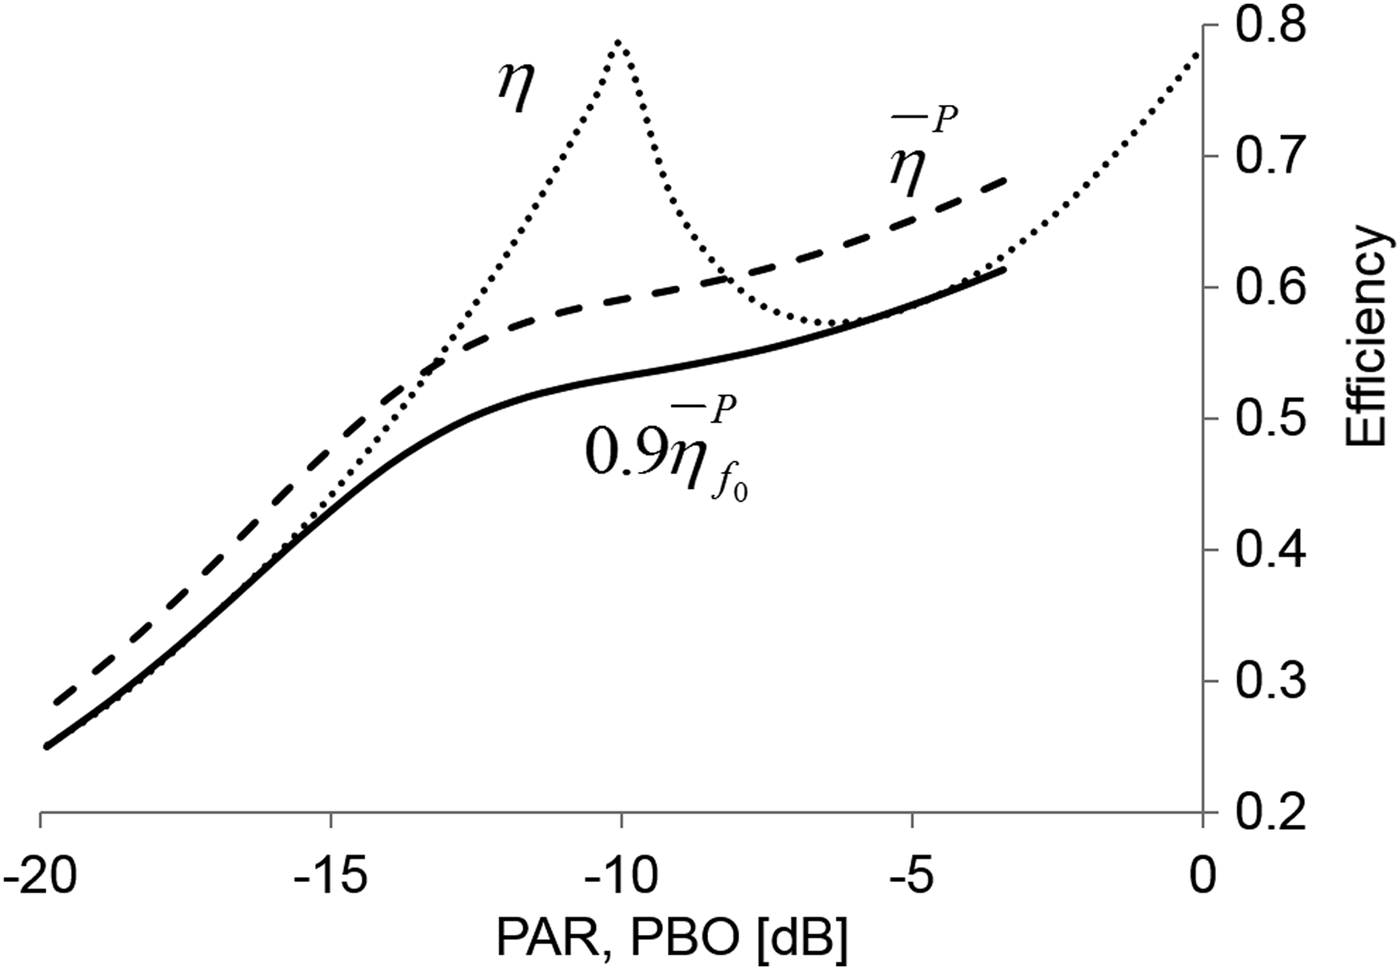
The distribution parameter σ can be used to adjust the peak to average power ratio (PAR) of the distribution. Note that the PAR is undefined if x max is infinite. The average efficiency  $\overline \eta ^P $ is a function of the PAR. An example for an asymmetrical Doherty PA is given in Fig. 1 (we will analyze this PA further in Section IV). Figure 1 shows the instantaneous efficiency η as function of the output power back-off (PBO). Also shown is the averaged efficiency
 $\overline \eta ^P $ as function of the PAR as calculated by the modified Rayleigh distribution of equation (2).
Efficiency versus PBO (dotted), averaged efficiency (striped) and efficiency bandwidth criterion (solid) versus PAR of an asymmetrical Doherty PA. Note that to obtain conventional graphs that correspond to increasing power going to the right on the horizontal axis, we plot PAR and PBO as negative values on that axis. This means that higher PAR and PBO values are to the left.

Throughout this paper we will plot instantaneous efficiency versus PBO and average efficiency versus PAR in the same graphs having both PBO and PAR on the x-axis for an easy comparison.
For a given PAR, we define the efficiency bandwidth criterion as the signal bandwidth at which the average efficiency has dropped to 90% of the zero-bandwidth average efficiency. In Fig. 1 also this criterion  $0.9\overline \eta ^P $ is shown by the solid line.
III. PA EFFICIENCY OF A SIGNAL WITH FINITE BANDWIDTH
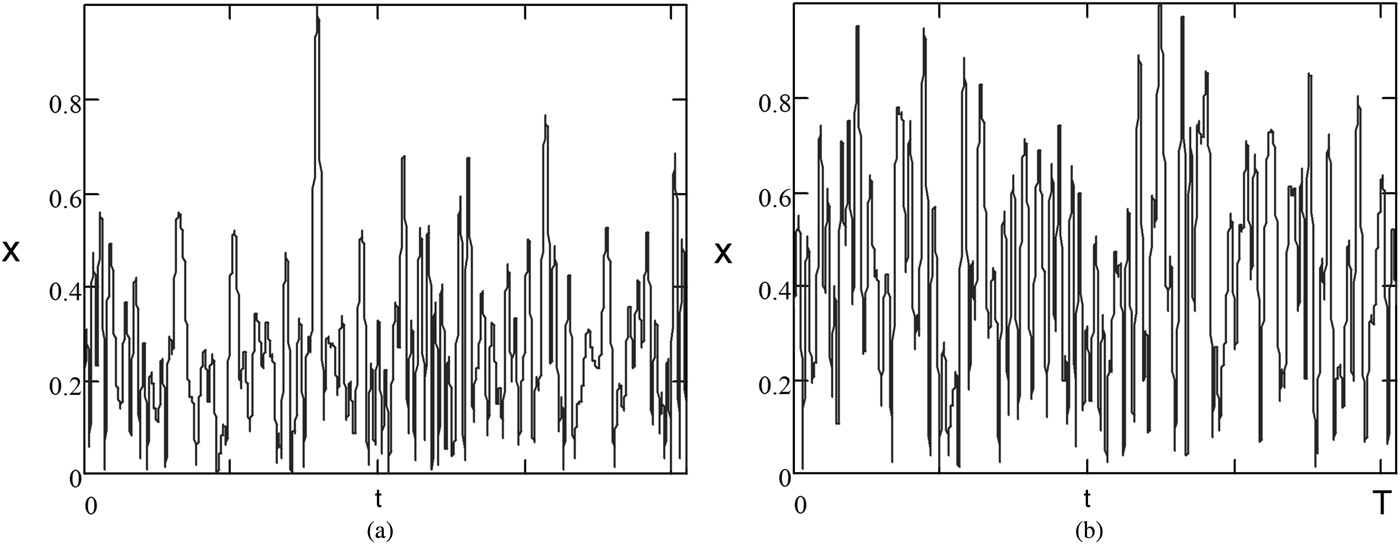
A signal with the right modulation type and with variable bandwidth has to be used for measuring the efficiency as a function of bandwidth. However, such signals are sometimes not available to every RF engineer and even if they are available, they may be easily used in measurements but not so in simulations. Especially for simulations it is simpler to emulate a modulated signal using multiple tones simultaneously. When the number of tones is sufficiently high, the signal power density function p(x) approaches a Rayleigh distribution [2]. We will use a finite number of tones with equal tone spacing, such that the signal is periodic and we can apply Fourier Transforms. The amplitude of the tones is all taken equal, but we assign a random phase to each tone. Since the number of tones is finite, also the maximum amplitude is finite. We normalize the tone amplitudes such that the maximum amplitude is always x max = 1. The signal PAR depends on the random choice of the phases. This means that the simulations have to be repeated multiple times, with each run using another set of random phases of the tones. If the number of tones is high enough, the signal statistics of each run approaches a modified Rayleigh distribution with a different PAR. Figure 2 shows the amplitudes of two separate runs, using 100 tones. In Fig. 2(a) the PAR is 10.1 dB, in Fig. 2(b) the PAR is 6.26 dB. Note that the maximum amplitudes are normalized to 1.
(a) Signal amplitude at the load for a signal consisting of 100 tones with random phases. The PAR is 10.1 dB (b) signal amplitude at the load for a signal consisting of 100 tones with random phases. The PAR is 6.26 dB.
We will show how the efficiency is calculated for each run, such that we can generate a scatter plot of efficiency versus PAR for a modulated signal with a certain signal bandwidth. We can adjust the bandwidth by changing the spacing between tones or the number of tones.
We start by defining the voltage signal S(t) across the load impedance as the sum of a number of RF tones. This guarantees that we always have a perfect signal in the load.
 $$\eqalign{& S(t) = \sum\limits_{p \;=\; 1,p \ne {{{N + 1} \over 2}}}^N {\alpha \exp (j\omega _0 t + j(p - {{{N + 1} \over 2}})\omega _m t + j\varphi _p)} \cr & \quad = \sum\limits_{p \;=\; 1,p \ne {{{N + 1}} \over 2}}^N {V_p \exp (j\omega _p t)},}$$
where N is the number of tones. The factor α is scaled such that the maximum amplitude is normalized to 1. The tone frequencies are given by:
 $$\omega _p = \omega _0 + (p - {\displaystyle{{N + 1} \over 2}})\omega _m $$
The frequencies are equally spaced with distance ω m. Throughout this paper we suppress the carrier by excluding the carrier frequency, i.e. the case p = (N+1)/2, from the summation in equation (4). N is odd, such that both sidebands have equal numbers of tones. The amplitude of the signal is given by:
 $$x = \left\vert {S(t)} \right\vert = \left\vert {\sum\limits_{p \;=\; 1,p \ne {{{N + 1} \over 2}}}^N {V_p}} \right\vert.$$
The voltage wave form across the load is Re[S(t)].
The circuit between the load resistor and the transistor terminal is described by its ABCD matrix. Since at the load the voltage and the current are defined for each frequency, the ABCD matrix can be used to directly calculate the voltages and currents at the transistor terminals. The time domain waveforms at the transistor terminals can then be obtained by simply summing over N frequencies. We will demonstrate that in the examples in the next sections. The situation at the load resistor may be more complex. Indeed the voltage waveform on the load resistor is simply given by equation (4). However, in PA architectures having more than one transistor, we still need to determine how much current each transistor branch provides to the load resistor. This is where the description of the PA architecture comes in. The treatment of a Doherty amplifier (Section V) is still relatively simple. As we will see in Section V, the outphasing Chireix architecture is more complex.
Defining the ideal signal at the load comes with a few bonuses. The major one is that signal linearity is automatically guaranteed. But also is the problem limited to the output side of the transistor: we do not need to know anything about the gain, how to drive the transistor at the input, or how to linearize it. This procedure implicitly assumes that linearization is perfect. This is different from simulations with CAD tools, since it is very cumbersome to achieve (nearly) perfect linearization using such tools. However, CAD tools may serve to study trade-offs between linearity and efficiency, which cannot be done with our approach.
IV. EXAMPLE OF A CLASS-B AMPLIFIER
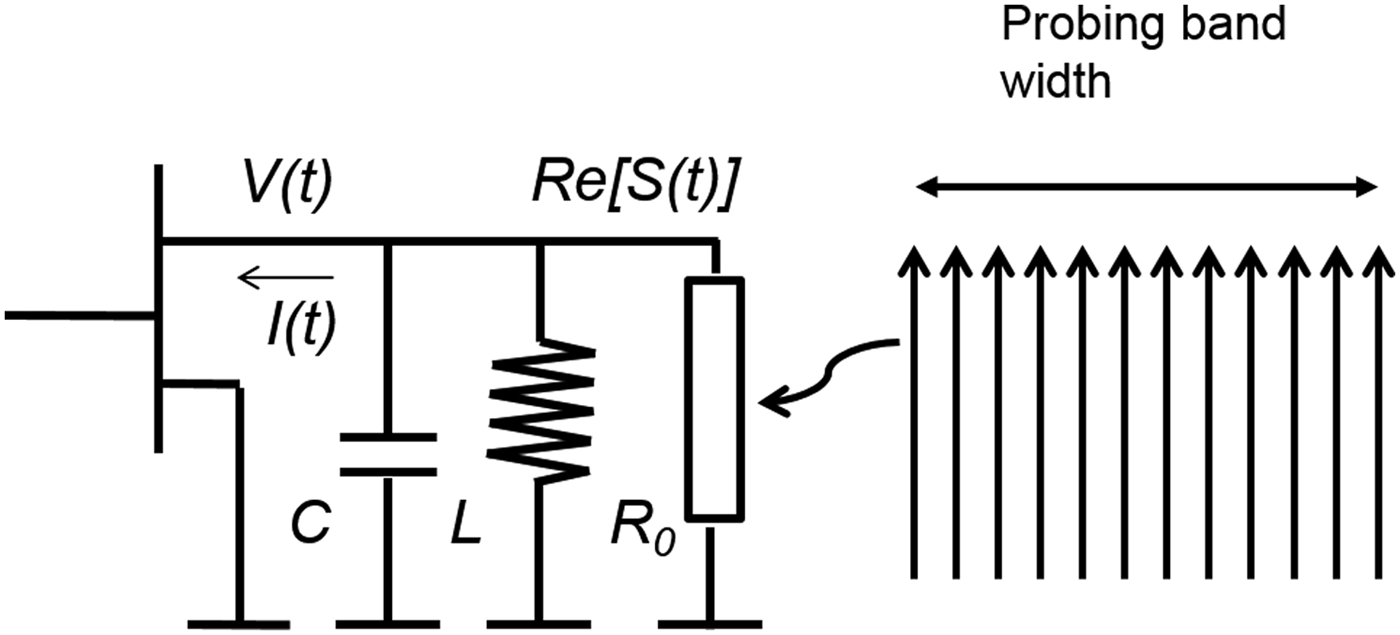
The simplest example to demonstrate how to calculate efficiency bandwidth is a class B biased transistor with a frequency dependent load that consists of a capacitor C, an inductor L and the load resistor R 0 in parallel. See Fig. 3. The capacitance can be thought of as the output capacitance of the transistor. The inductance resonates with the capacitance at the frequency of interest f 0. The example is universal, so the exact choice of f 0 is not relevant. For simplicity we take f 0 = 1 GHz.
Class-B amplifier with a simple output matching circuit.
The voltage across the load resistor is again given by equation (4). In this example that is also the voltage at the transistor terminal. The ABCD matrix of the LC-parallel circuit is:
 $$T_p = \left[ {\matrix{ 1 & 0 \cr {Y_p} & 1 \cr}} \right],$$
where 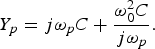 $Y_p = j\omega _p C + \displaystyle{{\omega _0^2 C} \over {j\omega _p}}. $
The voltage and current of the drain terminal are given by:
 $$\left[ {\matrix{ {V_p} \cr {I_p} \cr}} \right] = T_p \left[ {\matrix{ {V_p} \cr {V_p /R_0} \cr}} \right].$$
Equation (5) is a simple multiplication, not requiring any Fourier transform.
To calculate the dynamic load-line of the drain we need to do two more things: take the DC power supply into account and put the transistor in Class-B. Just like we have normalized the output signal amplitude to 1, we will also normalize the supply voltage to 1, so the voltage swing ranges between 0 and 2. This normalization will neither affect the PAR nor the efficiency. We find the total voltage waveform, including DC bias, at the transistor drain simply by:
 $$V(t) = 1 - {\mathop{\rm Re}\nolimits} \left[ {\sum\limits_{p \;=\; 1,p \ne {{{N + 1} \over 2}}}^N {V_p \exp (j\omega _0 t)}} \right].$$
Putting the transistor in Class-B is done by two steps. First we sum the I p into:
 $$I^{\prime}(t) = {\mathop{\rm Re}\nolimits} \left[ {\sum\limits_{p \;=\; 1,p \ne {\textstyle{{N + 1} \over 2}}}^N {I_p \exp (j\omega _0 t)}} \right],$$
which is also a simple summation of sine waves. Next we clip I p such that only positive values remain, i.e. we clip all negative values of I p to I p = 0. This is similar to what happens in a real Class-B amplifier, in which the transistor is biased to conduct current only for positive half cycles of the input signal. Since we also want to normalize the load-line to the current amplitude of 1, we need to multiply the result by a factor 2 to restore the amplitude that has been reduced by chopping off the negative current values. Now the current swing ranges also between 0 and 2. The time domain drain current is given by:
 $$I(t) = 2I^{\prime}(t)\quad {\rm if}\quad I^{\prime}(t) \ge 0\quad {\rm and}\quad I(t) = 0\quad {\rm if}\quad I^{\prime}(t) \le 0.$$
The power dissipation of the transistor can now be calculated by averaging the instantaneous power  $\overline {I(t)V(t)} $. The DC power intake of the transistor is
 $\overline {I(t)} \cdot \overline {V(t)} $. Assume that the matching circuit filters out all harmonics such that no power is delivered into frequency bands around higher harmonics of f 0. This means that the RF power at the band around f 0 consists of the difference of DC power intake and the dissipation: i.e.
 $P_{RF} = \overline {I(t)} \cdot \overline {V(t)} - \overline {I(t)V(t)} $. The PAR is given by 10log 10(P RF/P RF,max). The maximum power P RF,max, that the transistor can deliver is given by 1/8 times the maximum current swing times the maximum voltage swing and therefore equals 0.5.
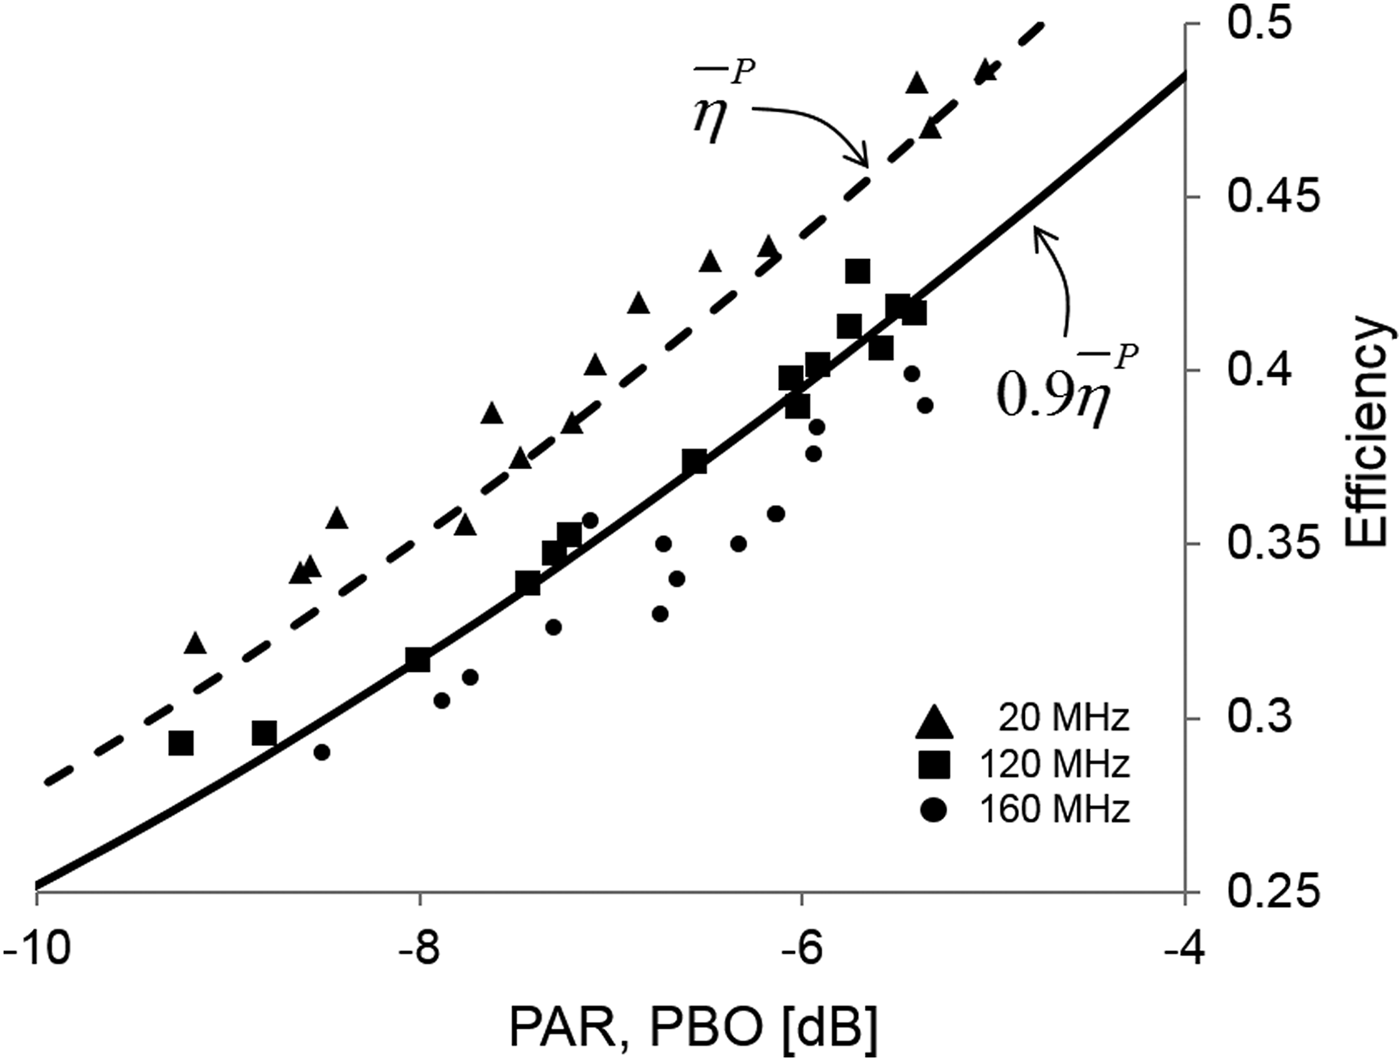
Using a capacitor value C = 10−9 and L resonating with C at f 0, we did several calculation runs, each with a different set of random tone phases. As explained in Section II, each random phase realization will result in a signal with a different PAR. In this Monte Carlo method each run will therefore result in a value for efficiency and PAR that we plotted in Fig. 4. We used 20 tones (N = 21) and three cases of tone spacing: 1, 6 and 8 MHz, giving signal bandwidths of 20, 120 and 160 MHz.
Class-B amplifier. Striped curve: zero bandwidth efficiency averaged over power. Solid curve: 0.9 times zero bandwidth efficiency averaged over power, which is the efficiency bandwidth criterion. Symbols indicate Monte Carlo calculations of efficiency for several signal bandwidths and random phase multi-tone realizations.
The zero-bandwidth curve (striped) is calculated in a fully analytical way, with the help of equations (1) and (3), using the fact that the efficiency η equals πx/4 and the normalized output power equals x 2. It is clear that 20 MHz signal bandwidth shows the same efficiency as zero bandwidth. However, a 120 MHz wide signal has a reduced efficiency. Its calculated points coincide with the efficiency bandwidth criterion (solid curve), while those of a 160 MHz signal are clearly below the criterion. From this we derive that for this particular choice of C = 10−9 the efficiency bandwidth is 120 MHz.
This very simple example of a Class-B amplifier shows how the principle of calculating the efficiency bandwidth works in a few simple steps. Since the desired signal is defined at the load, which for example can be an antenna, signal integrity is guaranteed. How the integrity is achieved in practice is of no concern in the method to calculate the efficiency bandwidth. As we will show in the next sections, this property allows to apply this method to more complex PA architectures, limiting the required knowledge to the output circuitry only. The next example is that of a Doherty amplifier.
V. DOHERTY AMPLIFIER EXAMPLE
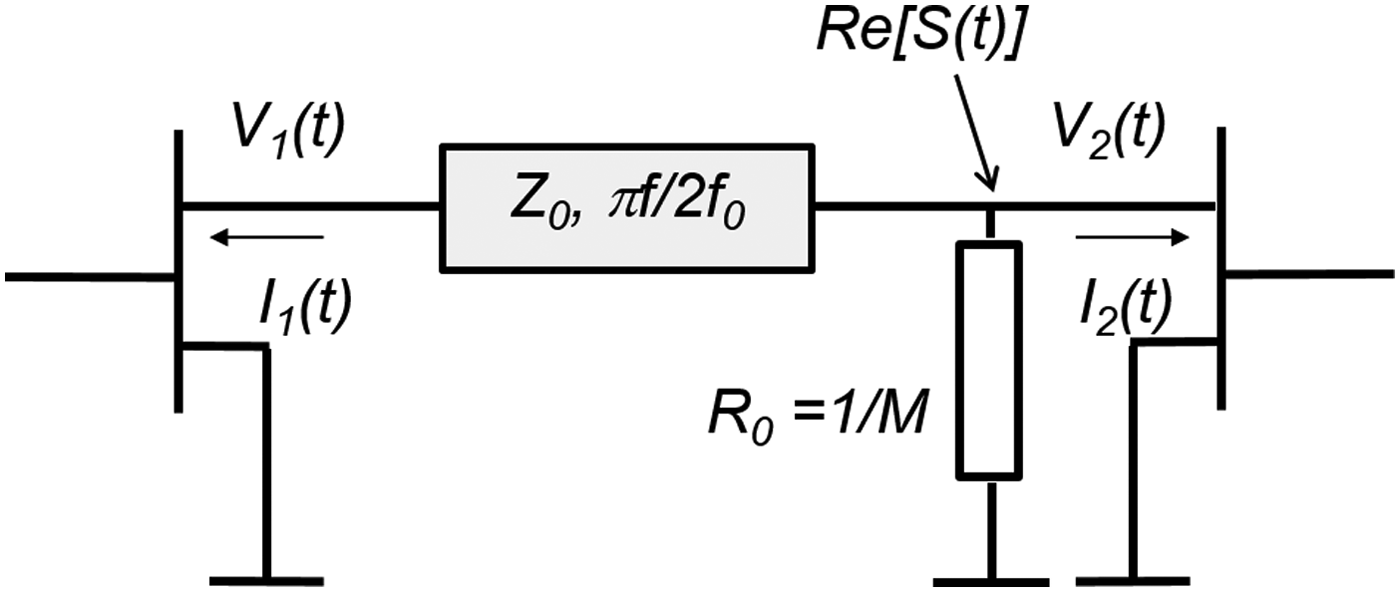
An asymmetrical Doherty amplifier architecture is shown in Fig. 5. A detailed description of the working principles of a Doherty amplifier can be found in [Reference Cripps3]. For our calculations we assume that the transistors are ideal, even the output capacitance as well as all other parasitic elements are ignored. We further assume that both transistors are operating in Class-B mode. The main amplifier (left transistor) is connected via a transmission line to the load resistor. The transmission line is a quarter-λ transmission line at the center frequency f 0 with a characteristic impedance equal to 1. The peak amplifier (right transistor) is directly connected to the load resistor. The asymmetry is chosen such that the instantaneous efficiency peaks at 10 dB PBO. This means that the load-line modulation of the main amplifier is M = √10 and the load resistor R 0 = 1/M.
Asymmetrical Doherty amplifier. Main amplifier on the left, peak amplifier on the right.
Just as in the previous example of a Class-B transistor we start by defining the signal at the load as a sum of multiple tones, equally spaced, with random phases, see equation (4). Next we consider the main PA and ignore the peak PA completely. The main PA will see a termination by the transmission line and a real load resistance R main, that is equal to R 0 at low power levels, i.e. when ∣S(t)∣ < 1/M. At higher signal levels the load is modulated by the PA and the main amplifier will see R main = ∣S(t)∣MR 0. As in the case of the Class-B amplifier above we can now calculate the dynamic load-line of the main amplifier using the ABCD matrix of the transmission line:
 $$T_p = \left[ {\matrix{ {\cos ({\displaystyle{\pi \over 2}}\ {\displaystyle{f \over {f_0}}} )} & {jZ_0 \sin ({\displaystyle{\pi \over 2}}\ {\displaystyle{f \over {f_0}}} )} \cr {\displaystyle{j \over {Z_0}} \sin ({\displaystyle{\pi \over 2}}\ {\displaystyle{f \over {f_0}}} )} & {\cos ({\displaystyle{\pi \over 2}}\ {\displaystyle{f \over {f_0}}} )} \cr}} \right].$$
With our choices for M and R 0, the characteristic impedance of the transmission line in the Doherty PA is Z 0 = MR 0 = 1. From the dynamic load-line we can again extract the dissipation, efficiency, RF output power and PAR using the same procedure as in the previous example and equations (6) and (7).
The current delivered by the main amplifier into the load resistor is S(t)/R main. The total current in resistor R 0 is S(t)/R 0. The difference between both currents is of course delivered by the peak amplifier. This immediately gives the dynamic load-line, and the efficiency, of the peak amplifier. Knowing the efficiencies of the transistors and the total output power, we can again evaluate the total efficiency of this Doherty architecture by changing the tone spacing.
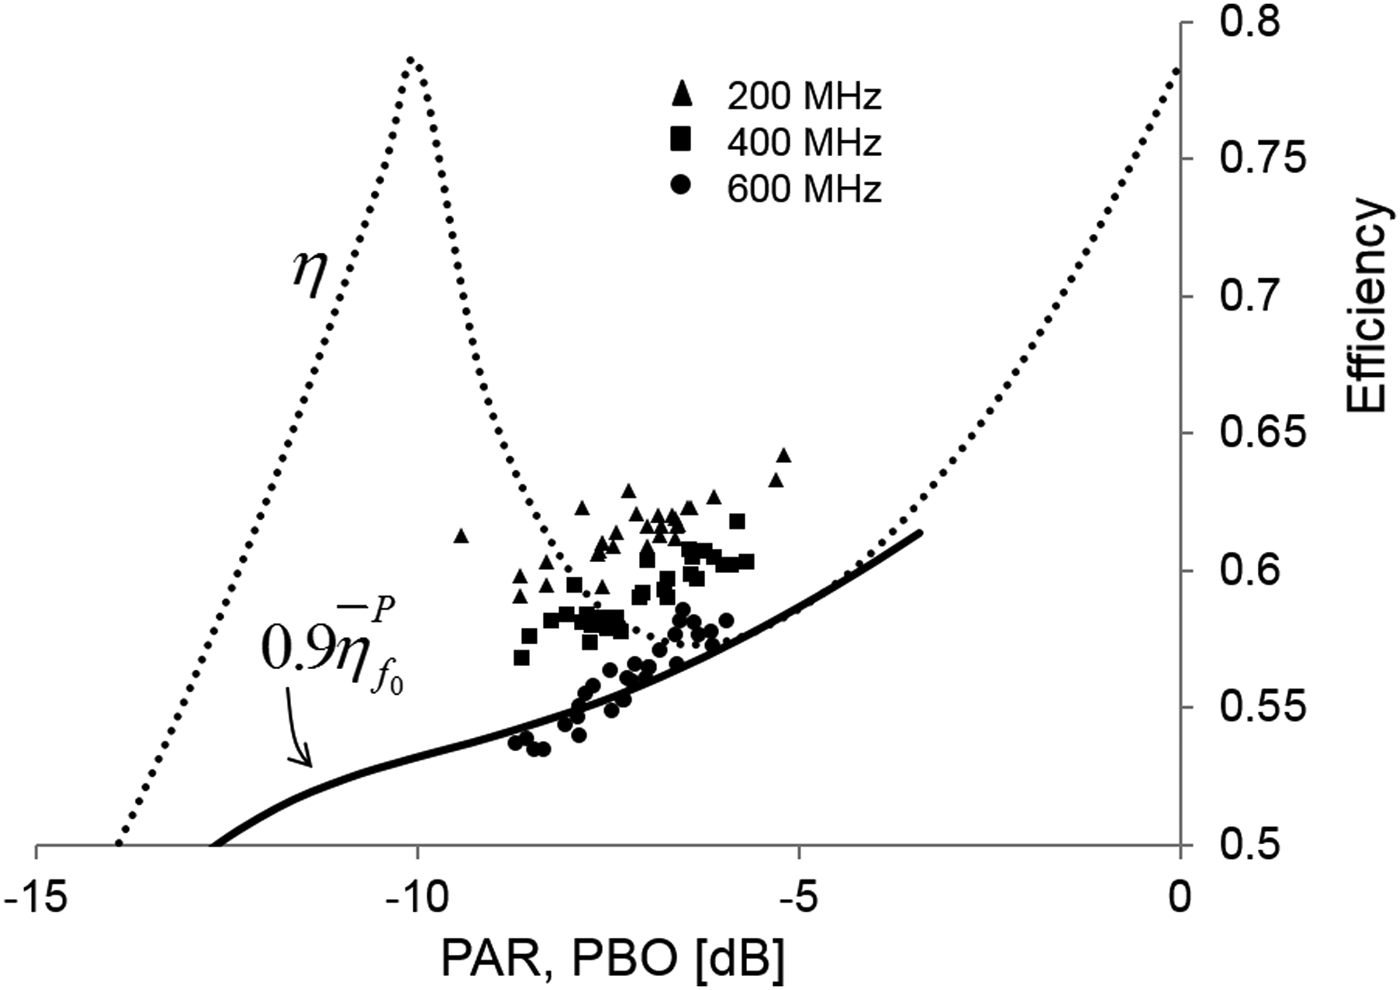
In Fig. 6 the instantaneous efficiency is shown (dotted curve) as well as the efficiency bandwidth criterion (solid curve). The calculated points are achieved using 40 tones (N = 41) for 200 MHz and 400 MHz bandwidth and 60 (N = 61) tones for 600 MHz bandwidth. The number of tones is chosen to obtain convenient tone spacing. Comparing calculations with 20 tones or more does not show significant different results. The graph clearly indicates that calculations with 600 MHz bandwidth coincide with the efficiency bandwidth criterion curve, so we may conclude that the efficiency bandwidth is 600 MHz, which implies an instantaneous bandwidth of 60%. For a symmetrical Doherty PA even 72% efficiency bandwidth is obtained.
Asymmetrical Doherty amplifier. Instantaneous efficiency (dotted) and efficiency bandwidth criterion (solid). Symbols denote Monte Carlo calculations with varying signal bandwidths.
These very large efficiency bandwidths are achieved because we have used idealized transistors without output capacitances. Typical LDMOS transistors have an output capacitance of about 0.23 pF per Watt output power at a supply voltage of 28 V. So far we have worked with normalized voltages and currents, without units. However, to evaluate the influence of the output capacitances correctly we need to use volts and amperes in our calculations. Therefore the MathCAD code in [4] is used. We set the supply voltage to 28 V, the maximum current of the main amplifier arbitrarily to 5 A and the transistor knee voltage to zero. The maximum power of the transistor is 1/4 × 28 × 5 = 35 W, so its output capacitance is 8.05 pF. The peak transistor is larger by a factor of  $\sqrt {10 }- 1 $ and has an output capacitance of 17.4 pF. Simple matching of the transistors is done by shunt inductors in parallel with the output capacitances. The capacitance and the inductor resonate at the center frequency of the signal. The ABCD matrix of T p is multiplied by the matrix of the parallel combination of output capacitance and shunt inductor. This means e.g. for the main transistor that T p from equation (8) becomes:
 $$T_p = \left[ {\matrix{ 1 & 0 \cr {jC_{out} (\omega - \displaystyle{{\omega _0^2} \over \omega} )} & 1 \cr}} \right].\left[ {\matrix{ {\cos ({\displaystyle{\pi \over 2}}\ {\displaystyle{f \over {f_0}}} )} & {jZ_0 \sin ({\displaystyle{\pi \over 2}}\ {\displaystyle{f \over {f_0}}} )} \cr {\displaystyle{j \over {Z_0}} \sin ({\displaystyle{\pi \over 2}}\ {\displaystyle{f \over {f_0}}} )} & {\cos ({\displaystyle{\pi \over 2}}\ {\displaystyle{f \over {f_0}}} )} \cr}} \right].$$
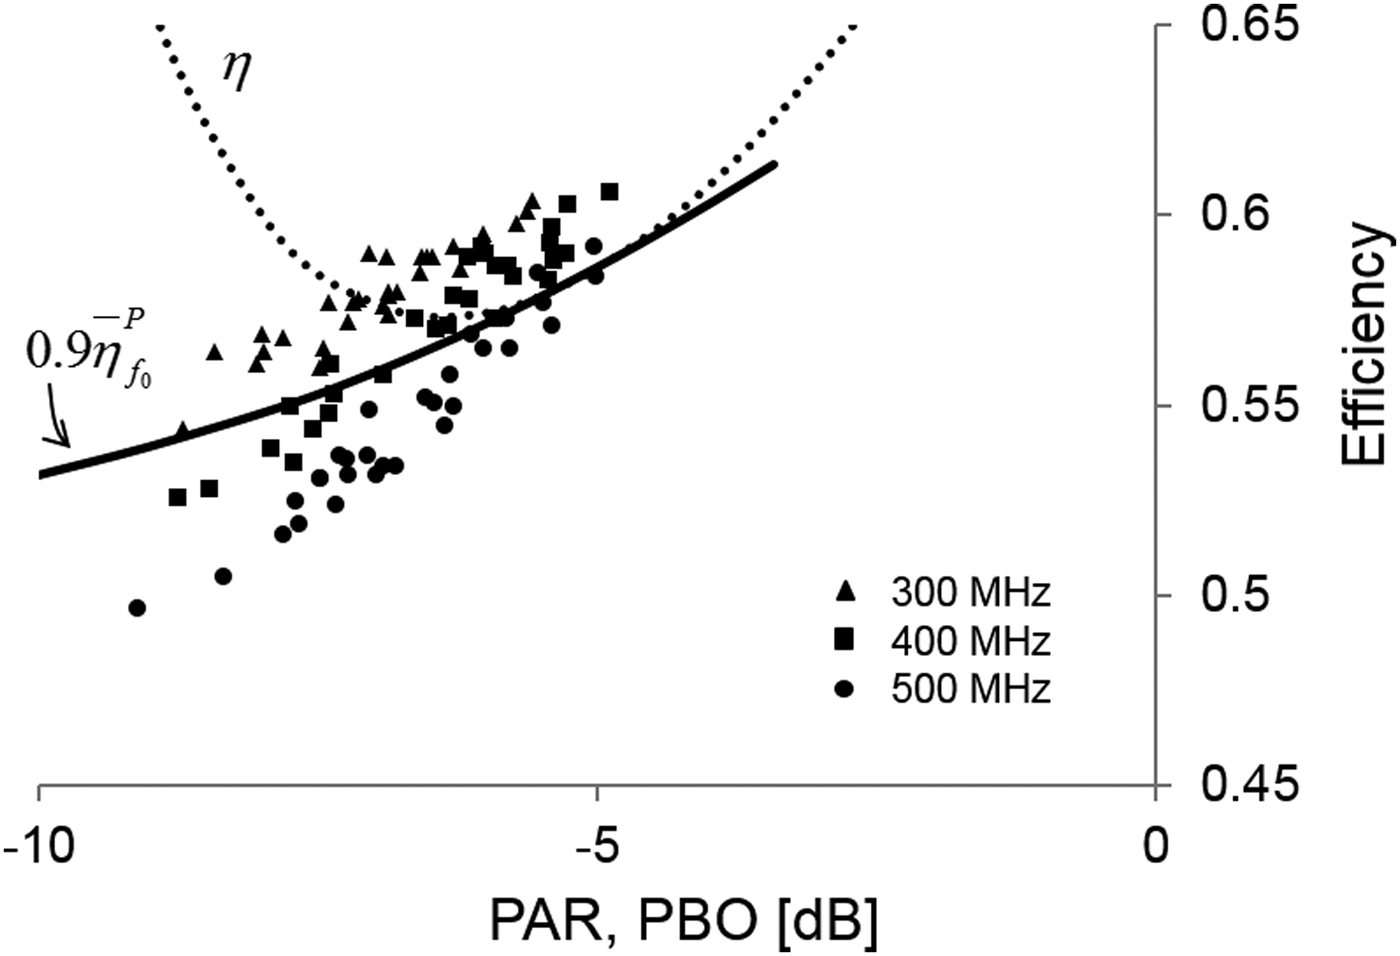
After doing the same calculations as in Fig. 6, the points in Fig. 7 show the Monte Carlo results of the efficiency for 300, 400 and 500 MHz signal bandwidths. The center frequency is 1 GHz. The efficiency bandwidth has been reduced from 600 MHz in Fig. 6 to 400 MHz in Fig. 7 due to the increased Q of the matching circuit consisting of output capacitance and shunt inductance.
Asymmetrical Doherty amplifier with LDMOS transistor output capacitances. The center frequency of the signal is 1 GHz. Instantaneous efficiency (dotted) and efficiency bandwidth criterion (solid). Symbols denote Monte Carlo calculations with varying signal bandwidths.
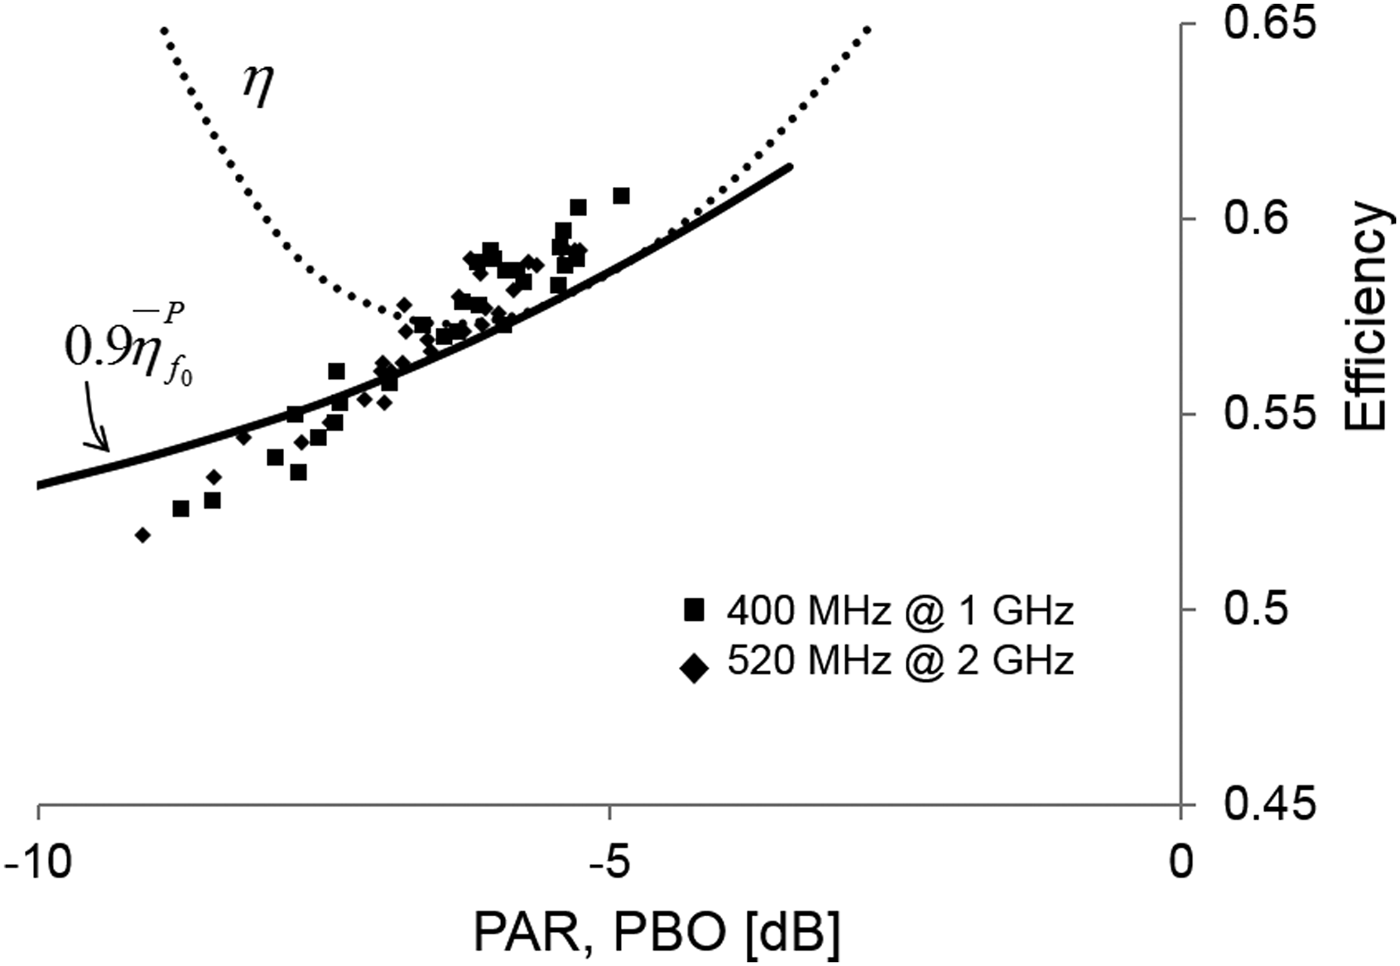
Since C out has a fixed value that does not change with frequency, the efficiency bandwidth depends on the signal frequency but it is not a fixed percentage of it. This is illustrated in Fig. 8. Efficiencies are plotted for a signal at 1 GHz with a bandwidth of 400 MHz and a signal at 2 GHz with a bandwidth of 520 MHz. Both scattered data clouds coincide, showing that the efficiency bandwidth increases from 400 MHz at 1 to 520 MHz at 2 GHz.
Asymmetrical Doherty amplifier with LDMOS transistor output capacitances. Instantaneous efficiency (dotted) and efficiency bandwidth criterion (solid). Symbols denote Monte Carlo calculations with signal bandwidths of 400 MHz at 1 GHz center frequency (squares) and 520 MHz at 2 GHz center frequency (diamonds). Both coincide and overlap with the efficiency bandwidth criterion curve around −7 dB PBO.
VI. EXAMPLE OF OUTPHASING CHIREIX AMPLIFIER
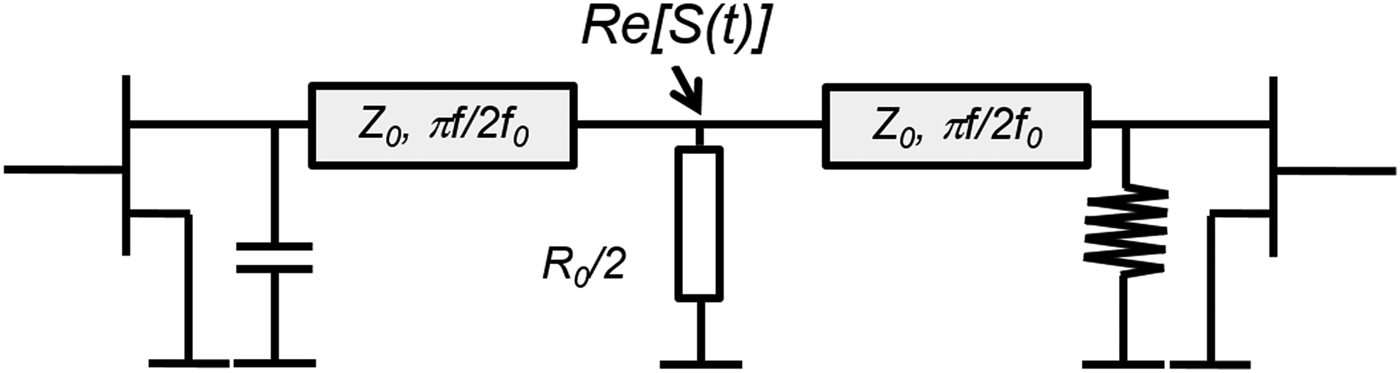
The next case we consider is that of a Chireix outphasing amplifier, in which the power combining is achieved using two quarter-λ lines as impedance inverters. See Fig. 9. We will use again idealized transistors without output capacitances for simplicity.
Chireix outphasing amplifier. The impedance inverters are quarter-λ lines. The capacitor and inductor are Chireix elements.
Both transistors deliver the same signal to the load but there is a phase difference 2θ between the two signals. This leads to vectorial adding of the signals at the load. For example, if θ is zero, both signals are added to give the maximum amplitude. If θ is 90 degrees both signals are in opposite phase and cancel each other. This results in zero amplitude at the load. Any amplitude in between can be realized at the load by a proper choice of θ. Under all circumstances the transistors work in saturation and can achieve high efficiency. However, high efficiency does not come automatically, due to mutual load-pulling by the two transistors: the effective load seen by one transistor is influenced by the other transistor and will therefore depend on θ. This reduces the efficiency of both transistors if θ deviates from zero. To partly compensate this effect, so-called Chireix elements are added, which are shown in Fig. 9 by the capacitance at the left transistor and the inductance at the right transistor. For one specific angle θ C they compensate the mutual load-pulling perfectly, leading to maximum efficiency for the power level belonging to angle θ C. It goes beyond the scope of this paper to explain the function of the Chireix outphasing amplifier in further detail. For that the reader is referred to the open literature, e.g. [Reference Zhang, Larson and Asbeck5].
The ABCD matrices of the Chireix capacitor and inductor are Xp and Λ p respectively:
 $${\rm X}_p = \left[ {\matrix{ 1 & 0 \cr {\displaystyle{{j\omega _p R_0 \sin (2\theta _c )} \over {2\omega _0 Z_0^2}}} & 1 \cr}} \right]\quad {\rm and}\quad \Lambda _p = \left[ {\matrix{ 1 & 0 \cr {\displaystyle{{\omega _0 R_0 \sin (2\theta _c )} \over {j2\omega _p Z_0^2}}} & 1 \cr}} \right].$$
In this paper we optimize the amplifier to have maximum efficiency at 10 dB PBO, which means that θ c is 71.56 degrees. The ABCD matrix of the quarter-λ lines are given by equation (8). The Chireix elements can be taken together with the quarter-λ lines into: K C = XpTp and K L = ΛpTp.
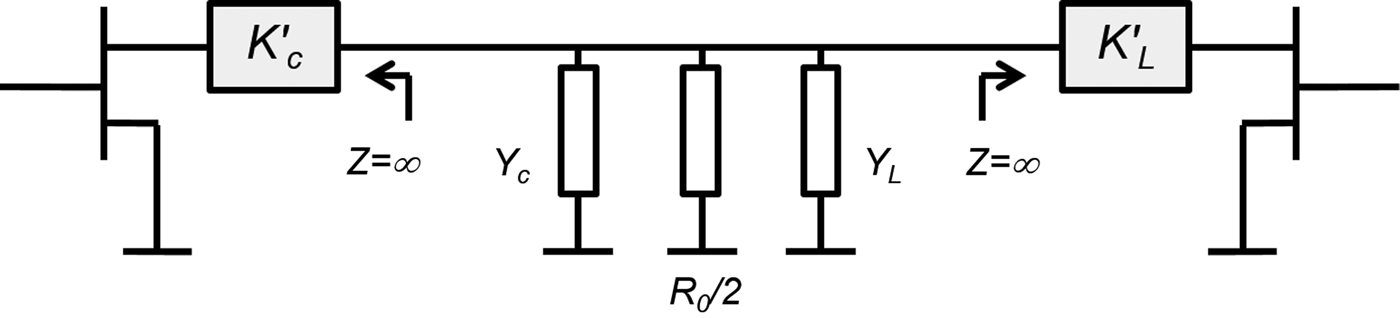
The Chireix power combiner does not provide isolation between both branches. This means that the left branch will not only be loaded by the load R 0, but also by the right branch and vice versa. In the next step we will transform the amplifier such that this mutual loading is incorporated in an effective total load and the remaining power combiner becomes isolating. Therefore we separate K C and K L each into two parts: their output impedances, Y C and Y L, respectively, and the remainders K C’ and K L’ in such a way that K C’ YC = K C and K L’ YL = K L. See Fig. 10. Note that K C’ and K L’ are mathematical constructs and do not represent physically realizable circuits. The transistors in an outphasing amplifier are assumed to be voltage sources hence their output impedance is zero. Therefore:
 $$Y_C = \displaystyle{{ - (K_C^{ - 1} )_{2,2}} \over {(K_C^{ - 1} )_{1,2}}} \quad {\rm and}\quad Y_L = \displaystyle{{ - (K_L^{ - 1} )_{2,2}} \over {(K_L^{ - 1} )_{1,2}}}. $$
Note that if the output impedances of the transistors were finite, e.g. because of a matching circuit or due to parasitic elements, we could still use the same procedure if we first absorb the transistor output impedances into K C and K L. The total effective load admittance of the amplifier is Y load = Y C + 2/R 0+Y L.
The Chireix outphasing amplifier after transformation
Same as before, we start by defining S(t) as a sum of multiple tones, equally spaced, with random phases. This means we rewrite equation (4) to:
 $$S(t) = \alpha e^{j\omega _0 t} \sum\limits_{n \;=\; 1}^{N/2} {(e^{jn\omega _m t \;+\; j\varphi _n} +} e^{ - jn\omega _m t \;+\; j\phi _n} ),$$
where ω m is the tone spacing and ϕ n and φ n are the random tone phases. The real constant α is again scaled such that the maximum value of ∣S(t)∣ equals 1. The first term in the summation is the right sideband signal and the second term is the left sideband signal. The current through the load is Y loadVload, but what is the contribution of each transistor to that current? We know that the currents flowing into the load from the left and right sides are equal, but with a phase difference of 2θ. So we can rewrite equation (10) into:
 $$S(t) = {\displaystyle{1 \over 2}}e^{j\chi (t)} e^{j\omega _0 t} (e^{j\theta (t)} + e^{ - j\theta (t)} ).$$
The factor ejχ is needed to describe complex amplitude. From equation (11) it is clear that the currents from each branch are:
 $$\eqalign{& I_{left} (t) = {\displaystyle{1 \over 2}}Y_{load} e^{j\chi (t)} e^{j\omega _0 t} e^{j\theta (t)} \quad {\rm and} \cr & \quad I_{right} (t) = {\displaystyle{1 \over 2}}Y_{load} e^{j\chi (t)} e^{j\omega _0 t} e^{ - j\theta (t)}.}$$
From equations (10) and (11), the outphasing angle θ is found as θ(t)=arccos|S(t)| and the in-phase angle is:
 $$\chi (t) = - j\ln \left\{ {\displaystyle{{\sum\limits_{n\, =\, 1}^{N/2} {({e^{jn{\omega _m}t \;+\; j{\varphi _n}}} + } {e^{ - jn{\omega _m}t \;+\; j{\phi _n}}}} \over {\left\vert {\sum\limits_{n\, =\, 1}^{N/2} {({e^{jn{\omega _m}t \;+\; j{\varphi _n}}} + } {e^{ - jn{\omega _m}t \;+\; j{\phi _n}}}} \right\vert}}} \right\}$$
.
As can be seen from equation (11), χ(t) is just the angle of the output signal. Equation (12) can only be used in the time domain since the terms χ(t) and θ(t) are functions of time. However, we need a description in the frequency domain if we want to calculate what the signal is on the transistor terminals. We use Fourier series descriptions of I left(t) and I right(t) in terms of multiples of ω m. Due to the signal decomposition in the left and right amplifier branches many more Fourier terms are needed to describe I left(t) and I right(t) than to describe S(t). This bandwidth expansion in each amplifier branch is a typical challenge for outphasing architectures [Reference Mustafa, Ahmed and Faulkner6]. The Fourier series descriptions of I left and I right are denoted by Ĩ left and Ĩ right, etc. Once we have determined  $\tilde{S}(t)$ and Ĩ left we can calculate the voltages and currents on the left transistor terminals easily by:
 $$\left[{\matrix{ {{V_p}} \cr {{I_p}} \cr } } \right] = {K_C}\left[ {\matrix{ {\tilde{S}(t)} \cr {{{\tilde{I}}_{left}}} \cr } } \right].$$
Using the same procedure as in equations (6) and (7) we can construct the dynamic load-line. In an identical way the dynamical load-line of the other transistor is obtained. Note that this procedure assumes the transistors are in saturated Class-B operation.
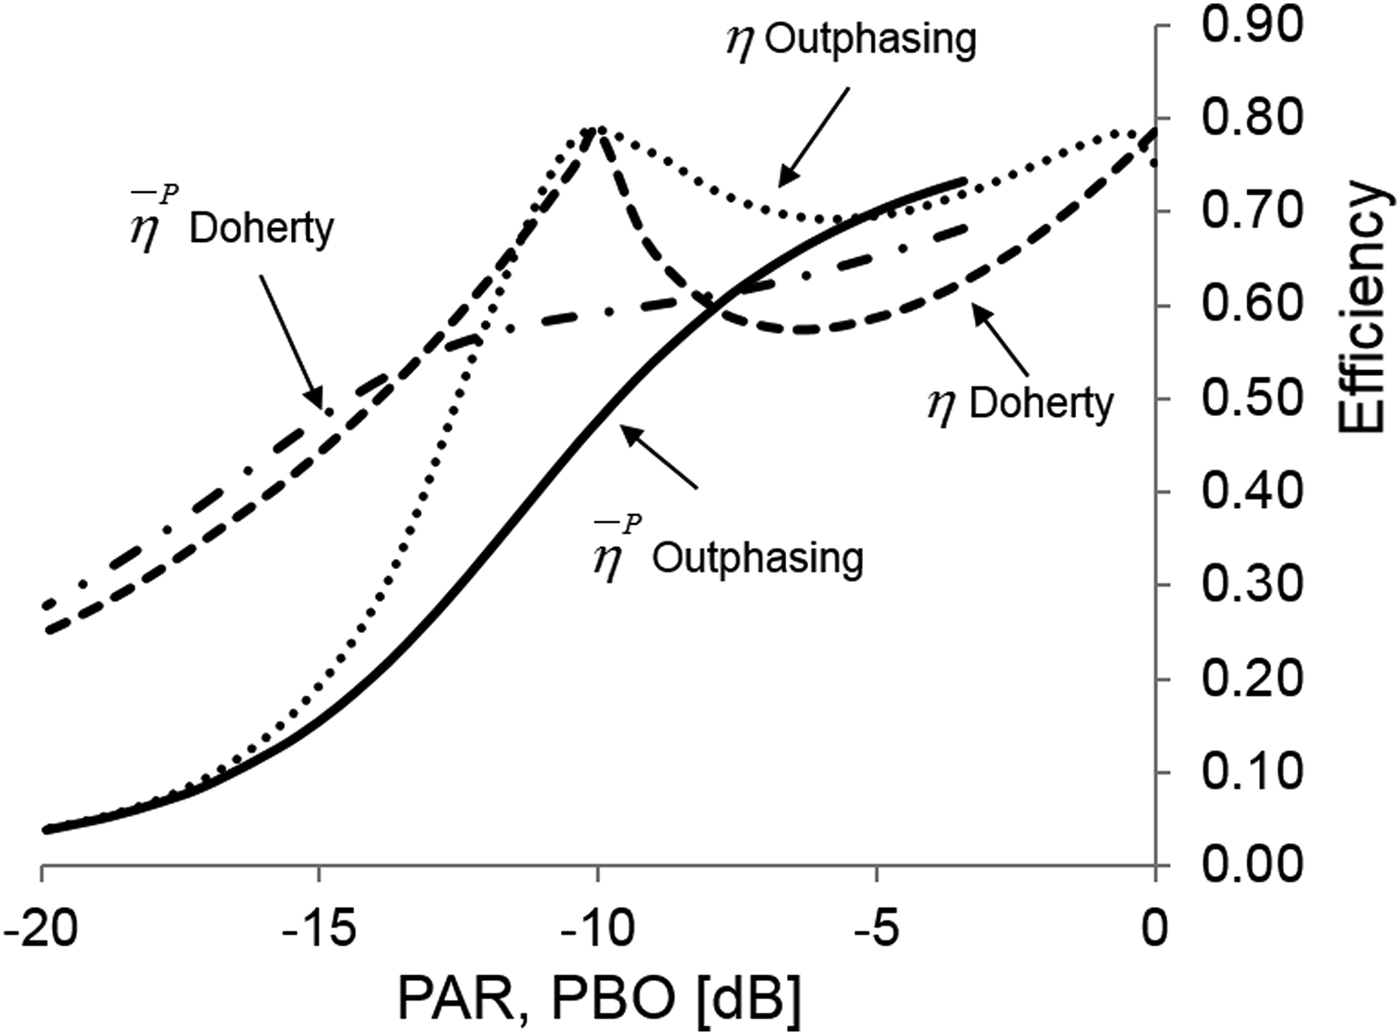
In Fig. 11 the instantaneous efficiencies of the asymmetrical Doherty and outphasing amplifiers are plotted versus PBO. Both amplifiers are optimized for 10 dB back-off power. Also plotted are their efficiencies averaged over power as function of PAR. It is clear that the average efficiency of the Doherty amplifier is higher for PAR values larger than 8 dB.
Instantaneous efficiencies of the Doherty and Chireix outphasing amplifiers (striped and dotted curves resp.). Corresponding efficiencies averaged over power are indicated by the striped-dotted and solid lines, respectively.
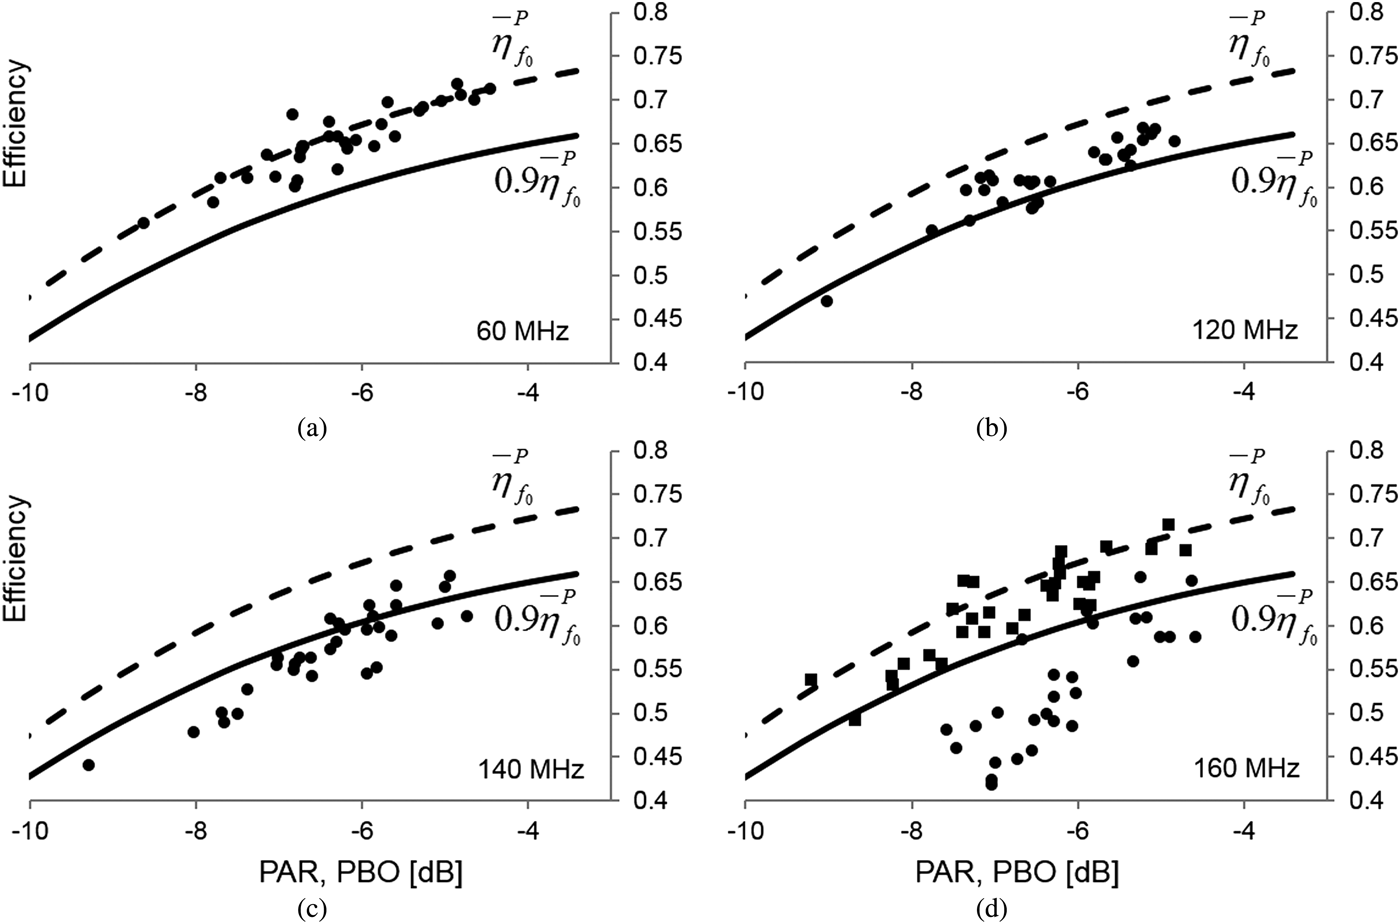
Using a signal of 20 tones and varying the tone spacing we performed Monte Carlo calculations of the efficiency of the Chireix outphasing amplifier for signal bandwidths of 60, 120, 140 and 160 MHz. Comparing the results, shown in Fig. 12, with the efficiency bandwidth criterion (solid curves) it is clear that the amplifier's efficiency bandwidth is slightly below 140 MHz. It can also be observed that at lower power the PA efficiency is less than the efficiency bandwidth criterion. We can conclude that in this case the efficiency bandwidth itself depends on the signal PAR. The efficiency bandwidth value of 140 MHz is valid for PAR values between 4 and 6 dB, while 120 MHz is probably a better value for PAR values higher than 6 dB. In simulations in which the quarter-λ transmission lines are replaced by ideal impedance inverters with infinite bandwidth, much higher efficiency bandwidths are found. In Fig. 12(d) the efficiency results from Monte Carlo simulations are plotted for a signal bandwidth of 160 MHz for both inverters but with identical Chireix elements. The efficiency of the amplifier with ideal inverters is much higher than that of the amplifier with quarter-λ line inverters. In fact, the efficiency of the ideal amplifier is still almost equal to the small-bandwidth efficiency at 160 MHz. So in the non-ideal case the efficiency bandwidth is limited by the quarter-λ transmission lines rather than by the Chireix elements.
Chireix outphasing amplifier. Dotted lines: zero bandwidth averaged efficiency. Solid lines: efficiency bandwidth criteria. Symbols are Monte Carlo results for various signal bandwidths. In Fig. 10(d) the circles are results for 160 MHz using quarter-λ line impedance inverters, the squares are results using ideal impedance inverters, giving a much higher efficiency indicative of a much larger efficiency bandwidth.
VII. CONCLUSION
In this paper we demonstrate the use of a novel method to calculate or measure the efficiency bandwidth of RF amplifiers. This method uses an ideal signal at the load, consisting of equally spaced multiple tones with random phases, and calculating backwards to the transistor terminal to obtain the dynamic load-line and hence the power dissipation by the transistors. This method automatically results in perfect signal linearity. The approach is limited to the output side of the transistors, so no knowledge of driving the transistor or linearizing the signal is required.
Three examples are treated: a Class-B, an asymmetrical Doherty and a Chireix outphasing PA are compared. All three cases are highly idealized, using transistors without parasitics, such as output capacitance, and without matching circuits. The impedance inverters in the Doherty and outphasing architectures consist of quarter-λ transmission lines. The maximum realizable efficiency bandwidth of the Doherty amplifier is 60%, which is much larger than that of the outphasing amplifier, which is 14%. The efficiency bandwidth limitation in the outphasing PA is caused by the quarter-λ impedance inverters and not by the Chireix elements. The output capacitance in realistic transistor models limit the efficiency bandwidth, e.g. for the asymmetrical Doherty the efficiency bandwidth is 600 MHz for idealized transistors but 400 MHz if the output capacitance is taken into account at a signal center frequency of 1 GHz.
The proposed method for calculation of the efficiency bandwidth can easily be extended to describe more realistic amplifiers, with matching circuits and parasitic elements. The MathCAD code is made available on-line for various amplifier architectures [4]. MathCAD software is required to run the programs.
ACKNOWLEDGEMENTS
The author likes to thank Per Landin and Christian Fager from Chalmers University, Sweden, for helpful discussions and critical proof reading of the manuscript.
Rik Jos holds a Ph.D. in Physics from the University of Utrecht. In 1986 he joined Philips Semiconductors in the Netherlands to work on the development of process technologies for RF transistors for power amplifier applications. In 2002 he became a Philips Semiconductor Fellow in the technology development of both active and passive RF devices. At NXP Semiconductors (spun-out of Philips in 2006) he currently leads the innovation of technologies and application architectures for RF power. Since 2004 he is also appointed as adjunct professor at Chalmers University in Sweden. His field of research concerns high-efficiency RF amplifier architectures like switch mode power amplifiers and wide band gap devices, especially GaN high electron mobility transistors.