

DISCUSSION POINTS
• The paper presents a systematic and objective approach for selecting the most suitable solar energy system for a large and diverse range of applications.
• This process can serve dual purposes, (i) finding the most suitable system configuration and (ii) pointing out vital research and development objectives.
I. Introduction
I.1 The role and availability of renewable energy
Energy is essential for sustaining and developing our civilization, from its food to its social order, but overwhelming measured data indicate that staying on the present course of fossil fuels exploitation would have far reaching ramifications on human civilization and could even lead to our demise.Reference Jackson, Le Quere, Andrew, Canadell, Korsbakken, Liu, Peters and Zheng1,Reference Le Quéré, Andrew, Friedlingstein, Sitch, Hauck, Pongratz, Pickers, Korsbakken, Peters, Canadell, Arneth, Arora, Barbero, Bastos, Bopp, Chevallier, Chini, Ciais, Doney, Gkritzalis, Goll, Harris, Haverd, Hoffman, Hoppema, Houghton, Hurtt, Ilyina, Jain, Johannessen, Jones, Kato, Keeling, Goldewijk, Landschützer, Lefèvre, Lienert, Liu, Lombardozzi, Metzl, Munro, Nabel, Nakaoka, Neill, Olsen, Ono, Patra, Peregon, Peters, Peylin, Pfeil, Pierrot, Poulter, Rehder, Resplandy, Robertson, Rocher, Rödenbeck, Schuster, Schwinger, Séférian, Skjelvan, Steinhoff, Sutton, Tans, Tian, Tilbrook, Tubiello, van der Laan-Luijkx, van der Werf, Viovy, Walker, Wiltshire, Wright, Zaehle and Zheng2 Replacing fossil fuels with renewable resources may be the most likely successful path to a sustainable future.
Conversion of natural energy resources to heat and electricity has been the driving force behind the accelerated improvement of human quality of life over the past two centuries.Reference Olah, Goeppert and Surya Prakash3,Reference Armaroli and Balzani4 As a result, the global demand of energy has been growing at a faster rate than the population.Reference Ritchie and Roser5 The sustainability and continued development of human civilization depend on the economical availability of energy resources. On Earth, the energy resources available for conversion to heat and/or electricity can be divided to three categories—fossil fuels, nuclear energy, and renewable energy. Considering the ramifications of using each of these energy categories, renewable energy resources are relatively benign.Reference Le Quéré, Andrew, Friedlingstein, Sitch, Hauck, Pongratz, Pickers, Korsbakken, Peters, Canadell, Arneth, Arora, Barbero, Bastos, Bopp, Chevallier, Chini, Ciais, Doney, Gkritzalis, Goll, Harris, Haverd, Hoffman, Hoppema, Houghton, Hurtt, Ilyina, Jain, Johannessen, Jones, Kato, Keeling, Goldewijk, Landschützer, Lefèvre, Lienert, Liu, Lombardozzi, Metzl, Munro, Nabel, Nakaoka, Neill, Olsen, Ono, Patra, Peregon, Peters, Peylin, Pfeil, Pierrot, Poulter, Rehder, Resplandy, Robertson, Rocher, Rödenbeck, Schuster, Schwinger, Séférian, Skjelvan, Steinhoff, Sutton, Tans, Tian, Tilbrook, Tubiello, van der Laan-Luijkx, van der Werf, Viovy, Walker, Wiltshire, Wright, Zaehle and Zheng2,6–Reference Wiser, Barbose, Heeter, Mai, Bird, Bolinger, Carpenter, Heath, Keyser, Macknick, Mills and Millstein11 Therefore, if they can be exploited in an economical and ecologically acceptable manner, in sufficient quantities, renewables should be adopted at an increasing rate, gradually replacing other more polluting and potentially harmful resources.
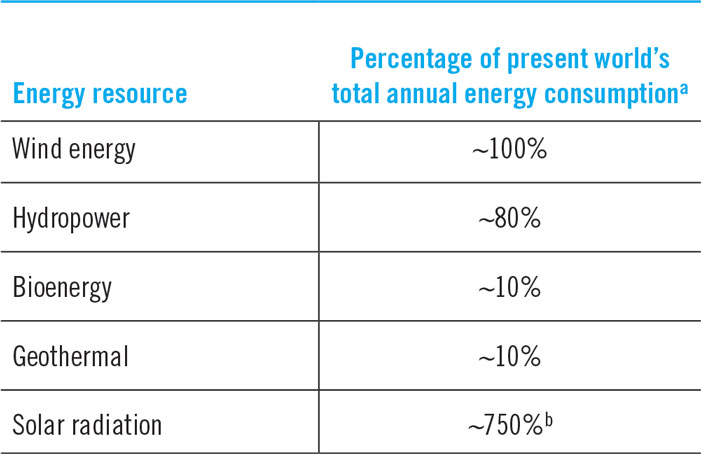
Table 1 lists the percentages of the present world’s total energy consumption that could be provided by using all the available energy of each of the main renewable energy resources, based on present estimates.

a Present total annual global consumption of primary energy ≈ 450 EJ/year (EJ = exajoules = 1018 joules).
b The solar radiation reaching the earth’s surface is approximately 3.4 × 10⁶ EJ/year [Ref. Reference Dostrovsky18, p. 79]. If just 1% of it (34,000 EJ/year) were converted to electricity at an efficiency of 10%, it would have provided 3400 EJ/year of electricity, which is 7.5 times the present consumption.
Based on Table 1, solar radiation is the only renewable resource available in a large enough quantity to provide the world’s energy needs seemingly indefinitely. This has been known for at least 30 yearsReference Dostrovsky18 Therefore, while all other renewable resources could and should be used responsibly, if renewables are going to supply a major portion of the world’s energy needs, solar radiation must become the principal resource.
I.2 Utilization of solar energy
Various methods of using sunlight for cooking, home and water heating, steam generation and other applications have been suggested since the early days of human civilization, and some were realized.Reference Perlin19–Reference Jones and Bouamane21 Efforts to implement electric power generation from the solar resource have been made since the early 20th century.Reference Fraas22 Growing awareness of anthropogenic impact on the environment,Reference Revelle and Suess23–Reference Sawyer25 as well as recurring oil crises and fossil fuel price volatility,Reference Lyndon and Donev26 helped promote research and development of solar-driven electricity production and chemical conversion in recent decades.Reference Fraas22,Reference Kearney27–Reference Fletcher30 The resulting cost-reduction of PV panels and systems,31 together with public concern over sustainability, has led to a large increase in the number and capacity of solar power generation plants—from 170 MW in 2000 to over 300 GW in 2017.Reference Wesoff32
Even with this increasing deployment, despite being the largest energy resource available on earth,Reference Dostrovsky18 energy derived from solar radiation produces only about 1% of the total world electricity generation.Reference Orcutt33 Note that examining only the design power rating of solar plants can lead to a false impression of much higher generation than the actual energy output, because the Capacity Factor (CF) of most solar plants is relatively low (20–30% if no energy storage is included in the system).Reference Orcutt33 In addition, the limited dispatchability of power generated from intermittent sources forces the grid operators to curtail solar (and wind) energy supply in regions with relatively high solar/wind installed capacity.Reference Temple34,Reference Zhou and Lu35 An alternative energy conversion option—solar-driven synthetic fuel production—is still at a precommercial stage. It is therefore not surprising to find persistent arguments that solar radiation could never provide a major share of the energy demanded by human civilization on earth.Reference Hayden36,Reference Kelly37
In summary, after half a century of extensive development and investments of billions of dollars, we are still faced with the same questions:
(i) What can realistically be expected from solar energy generation as the planet seems to be heading toward catastrophic pollution ramifications and climate change in the coming decades?
(ii) Among possible solar system configurations, how can we determine the preferred option for a given application?
(iii) How does a selected solar system compare with other, nonsolar (renewable and nonrenewable) options, not only from a direct cost of energy perspective but also taking into account impacts on societal, environmental, health, security and other aspects?
I.3 Solar plant types
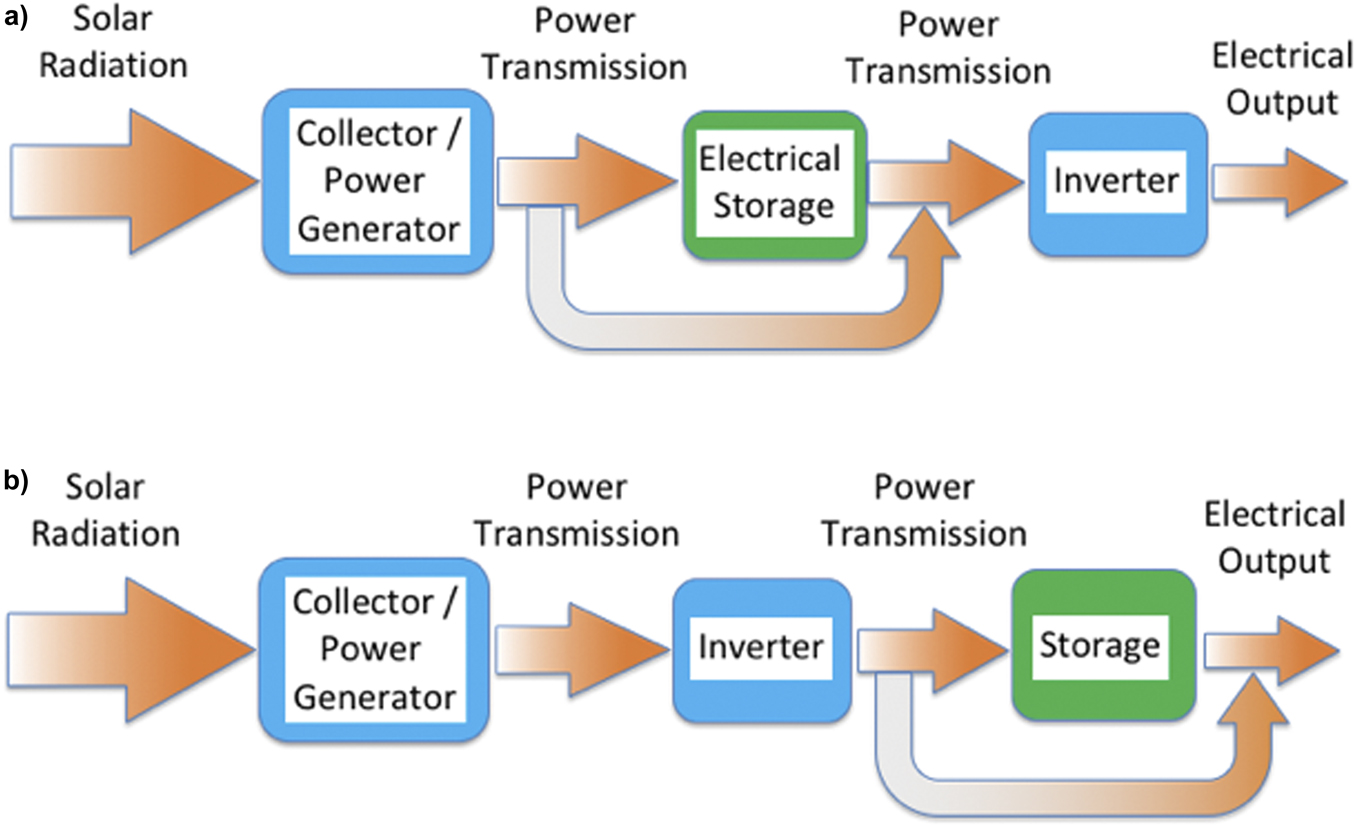
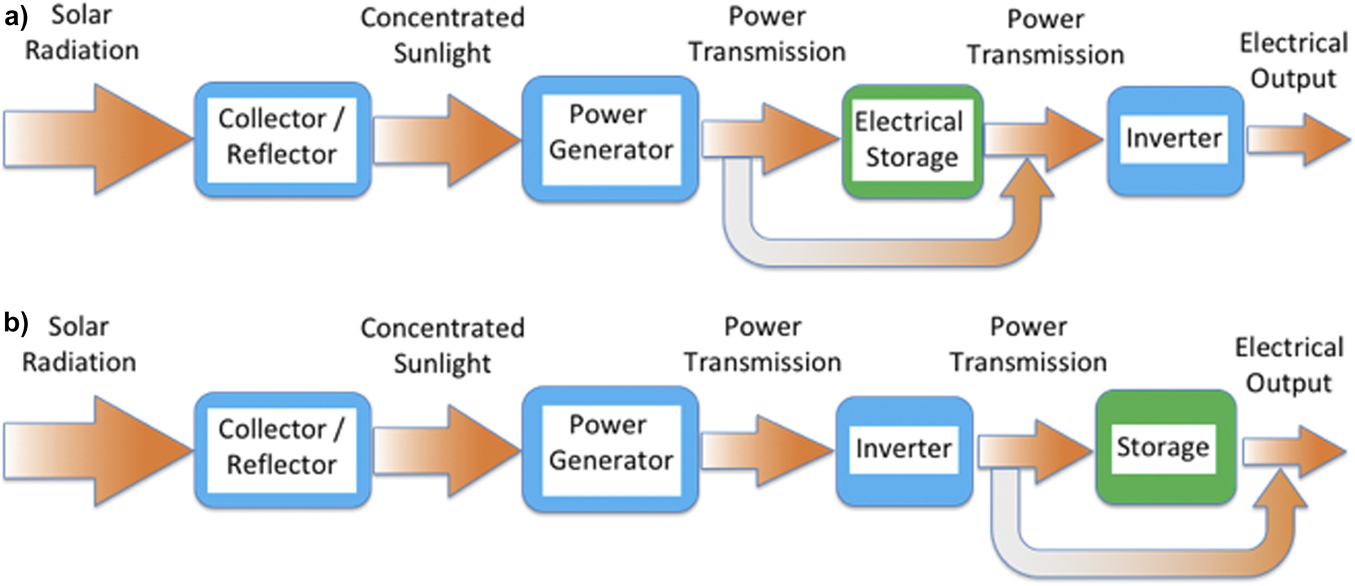
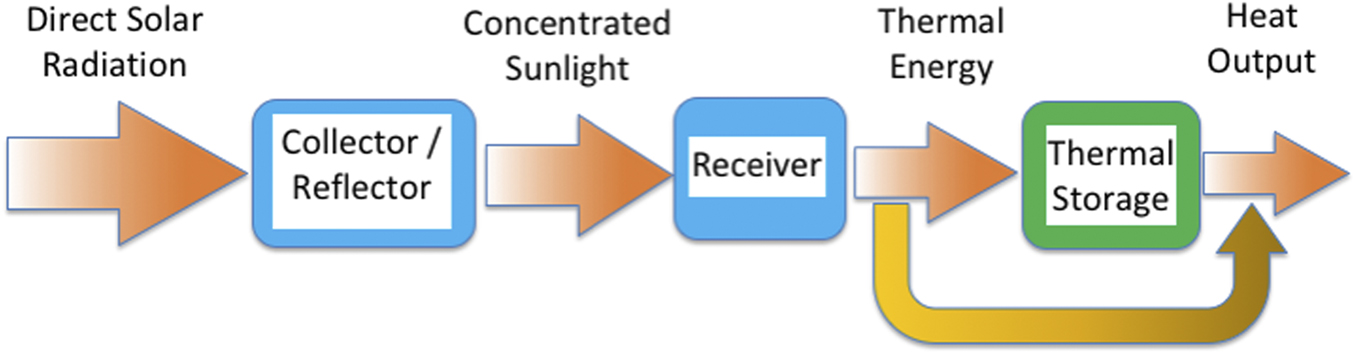
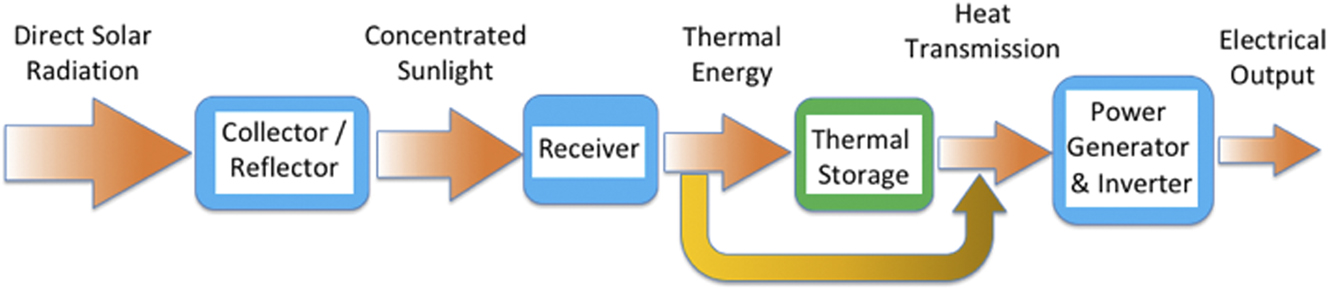
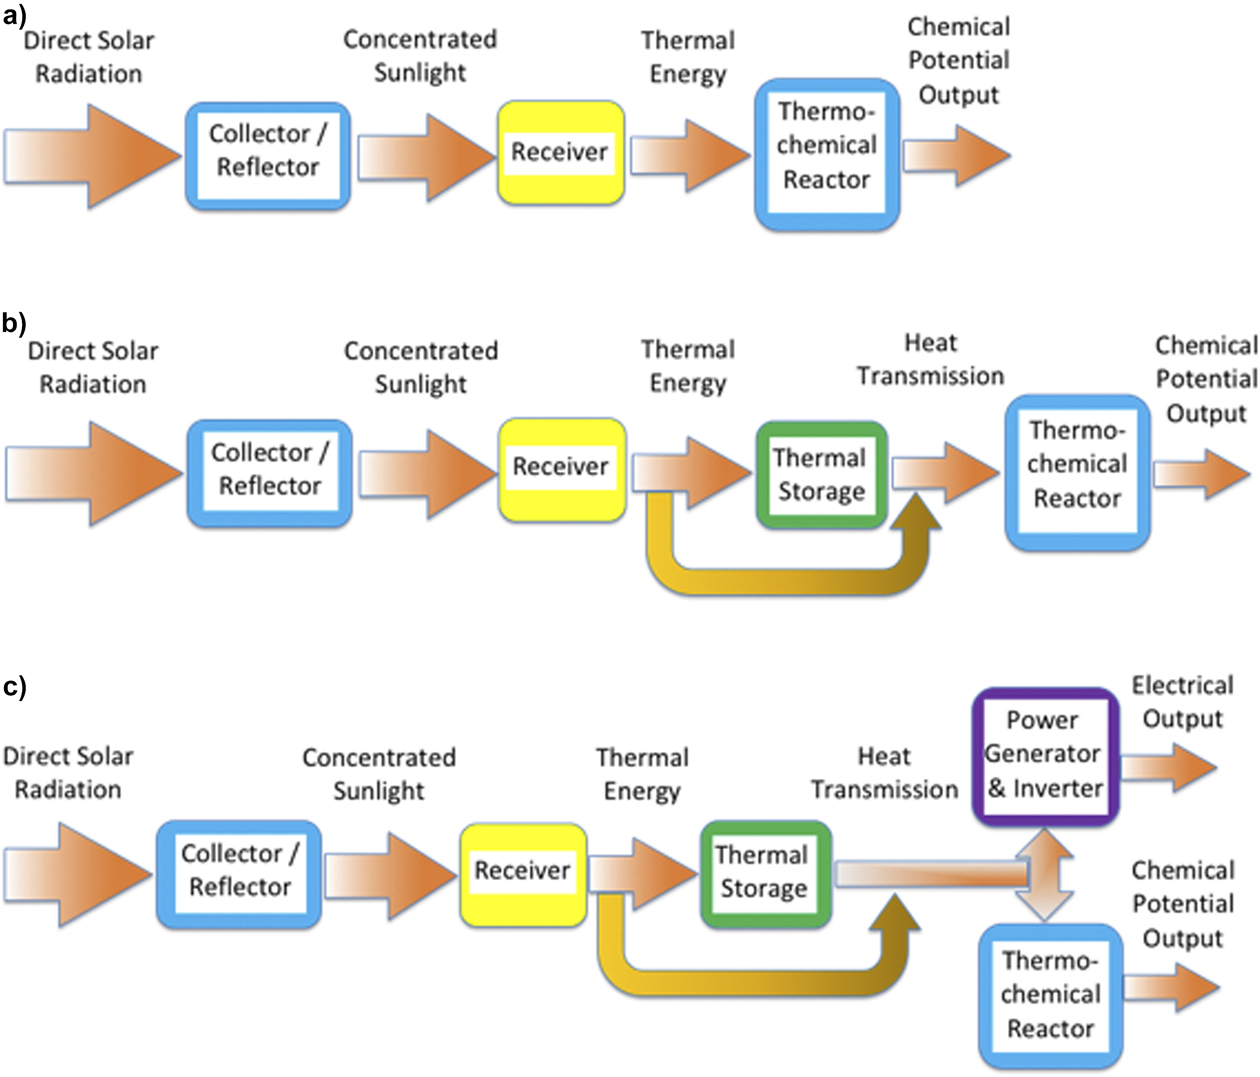
Solar energy–generating systems are designed to convert solar radiation to thermal energy, electricity, chemical potential, or some combination of these products.Reference Fraas22,Reference Kearney27–Reference Fletcher30 Two different solar energy conversion methods are commonly used—photovoltaic and solar-thermal. Figures 1–2 and 3–5 display schematic block configurations of photovoltaic power plants (PVPP) and solar-thermal power plants (STPP), respectively. The figures illustrate that each of these methods can be used in various system configurations, having different components and layouts, based on the design requirements and possibly other considerations. However, all PVPP systems use solar cells to convert solar radiation to electricity using the photovoltaic effect, whereas all STPP systems first convert solar radiation to heat, then they either use the heat (Fig. 3), or convert it to electricity (Fig. 4), or chemical potential [Figs. 5(a) and 5(b)], or a combination of electricity and chemical potential [Fig. 5(c)]. Other combinations of heat, electricity and chemical potential productions are also possible.
Schematic configurations of “conventional” (not concentrated) photovoltaic systems. The “blue” components are always present. Storage (“green” components) can be added. (a) Electrical storage (e.g., batteries, flywheels, and capacitors) is added before the DC to AC inversion. (b) Storage (e.g., pumped-hydro and compressed air) is added after the DC to AC inversion. In both cases, the power can be transmitted through the storage or around it. Other options, where power is converted to fuel via photocatalysis, electrolysis and other photoelectrochemical processes, either before or after the DC to AC inversion, are mentioned in the bottom of Section V.1.

Schematic configurations of concentrated photovoltaic systems. Unlike “conventional” PV (Fig. 1), here the Collector and Power Generator are separated. Similar to Fig. 1, the “blue” components are always present. Storage (“green” components) can be added. (a) Electrical storage (e.g., batteries, flywheels, and capacitors) is added before the DC to AC inversion. (b) Storage (e.g., pumped-hydro and compressed air) is added after the DC to AC inversion. In both cases, the power can be transmitted through the Storage or around it. Other options, where power is converted to fuel via photocatalysis, electrolysis and other photoelectrochemical processes, either before or after the DC to AC inversion, are mentioned in the bottom of Section V.1.

Schematic configurations of solar-thermal systems for heat production. The “blue” components are always present. Thermal storage (“green” component) can be added and then heat can flow either through it, or around it, or in both routes.

Schematic configurations of solar-thermal systems for electricity production. The “blue” components are always present. Thermal storage (“green” component) can be added. Part or all of the thermal energy from the Receiver can be delivered directly to the Power Generator (orange arrow), or deposited in the Thermal Storage and then transmitted to the Power Generator, per the demand for power.

Schematic configurations of solar-thermal systems for chemical energy (fuel) production. The “blue” components are always present. (a) The Thermochemical Reactor may be designed to receive concentrated sunlight and convert it to a chemical potential, or a Receiver can be used the convert the sunlight to heat and then the Reactor converts the heat to chemical potential (e.g., fuel). (b) If a Receiver is used, Thermal Storage can be located downstream of it, to assure continuous heat supply to the Reactor. (c) Similar to (b) but here the heat from the thermal storage can be used for producing either chemical potential or electricity, or both simultaneously.

I.4 Suggested solution approach
This article provides a generalized method for assessing and choosing the most suitable renewable energy approach for a large number of energy applications and thus hasten the transition from fossil fuels to renewables. Since solar energy is by far our most abundant renewable resource (see Section I.2), much of the discussion not only addresses solar energy systems but also shows that the suggested approach can be used with other renewable (and nonrenewable) energy conversion technologies. Additional work will be needed to further optimize deployment strategies with regard to social and ecosystems, and these too will need to be carefully assessed with similar cost models.
A systematic methodology is presented, which minimizes the risk of overlooking factors that might affect the outcome. The potential for bias can be reduced further by including peer review in the implementation process.
Section II presents the definition of the project objectives and fundamental system design requirements through a set of examples. Section III establishes a reliable and objective method for determining energy costs, which can be used for comparison of all the system options considered (Sections III.2 & III.3). Section IV describes a systematic methodology for obtaining system configurations, such that all the design requirements are met and the cost of the produced energy is minimized, including detailed guidelines for its implementation. Application of the methodology is then demonstrated in section V for a specific example case.
Different applications—such as large-scale grid-connected plants, stand-alone distributed power generation, and fuel production or upgrade—each have different objectives, fundamental design requirements and operating conditions. Additionally, available solar radiation, its daily and seasonal variations, other climate conditions, regulations, customer needs, environmental concerns, etc., are all expected to change from one location or facility to the next. The different objectives and conditions lead to different solutions for the best-suited system configuration in different cases.
A systematic, impartial methodology, such as presented in this article, should be an important part of the decision-making process when specific projects are considered. It can also be used to help identify fruitful research and development paths forward to improve system performance. If targets set by technology providers and researchers are introduced (e.g., component performance and cost targets), then the methodology makes it possible to identify their effect on the overall system competitiveness, thus highlighting the necessary and effective research and development directions.
The paper is aimed at multiple audiences:
(i) Analysts, system designers and decision makers who need to evaluate, compare and select renewable systems, can use the methodology described in the paper as a tool for selecting an optimized solution.
(ii) Inventors, researchers and component developers can use the paper to help them determine how valuable their approach is to the overall system.
(iii) R&D policymakers can use the approach of this paper to help identify research paths and directions that would have the most significant impact on the viability of optional renewable energy systems
II. Objectives and design requirements
II.1 Awareness of customer needs
The basic goal of any project or product should be to provide a solution that best serves the customers. To accomplish this, customer needs must be identified and included in the project’s fundamental objectives. An analysis of potential solutions should include all factors, not only technology-related parameters, such as performance and cost, but also health, environmental, societal, political and cultural considerations. Accordingly a “Societal Impact Factor” (SIF) is proposed in Section III.3, which facilitates the inclusion of these parameters in the decision-making process. An appropriate evaluation of the customer needs and the associated priorities will enable selection of a solution that is specifically optimized for the customer, including considerations of the broad needs of society on the local and national level, as applicable.
Customer needs often vary with location, but some are important to most customers, regardless of the location of the plant:
(i) 24/7, year-round, reliable electricity (or fuel) supply per demand;
(ii) Durable solution requiring minimal attention from the customer;
(iii) Reduction of pollution and CO2 emission;
(iv) Esthetics, minimal interference in day-to-day life and the least possible environmental impact;
(v) Affordable costs.
In many cases, consideration of customer needs and requirements is not the focus of the offered solution. Too often, the business model is not primarily directed at optimizing a solution for customer needs, but rather aims at exploiting special niche circumstances, favorable regulations or financial opportunities (e.g., subsidies), or regulatory loopholes. This approach may enable an entrepreneur and/or energy provider to make a profit on a small number of projects, but might not provide optimal solutions to the customer needs. It might be acceptable when the industry is young and/or the application is at a relatively small scale, in a limited market, but it is unlikely to lead to a healthy market expansion or be sustainable over a long period.38,39
Developers who choose the above approach for their first few plants may invest some of the profit and know-how they gain in the development of the next generation of plants. They could consider using the approach suggested in this article for selecting the best-suited system configuration for their customer needs and identify the key development efforts necessary for meeting the system design requirements at a minimum cost. Often, however, developers prefer to minimize risk, tending to continue building familiar systems, with small modifications, as long as it is profitable. This can lead to unintended consequences for the customer, as long-term effects may be overlooked.
Regulations sometime encourage this trend, for example:
(i) Granting a tax benefit for installing a renewable energy system, but not tying it to continued successful production—based on evolving performance objectives and gradual cost reduction—may translate to unrewarded public expenditure and abandonment of under-producing projects;
(ii) Awarding a large feed-in tariff can adversely affect local industry and reduce its international competitiveness, as the tariff may have an adverse impact on growth and affordabilityReference Zhang40;
(iii) Imposing renewable-favoring regulations forcing electricity distributers (grid handlers) to maximize the purchase of intermittent energy (e.g., wind and/or solar), without adequate storage. This conduct can disrupt the grid’s overall generation-supply balance, causing costly cycling, shut down, reduced production, efficiency drop and O&M increase of other (conventional) power generation plants.Reference Van den Bergh and Delarue41,Reference Kumar, Besuner, Lefton, Agan and Hilleman42 Indeed, the larger the spinning inertia of a conventional power plant, the more difficult and stressful it is to cycle. Such detrimental effects on conventional plants during periods of high renewable energy share are often overlooked.
Some of the ways used by entrepreneurs over the years to exploit favorable regulations include the following:
(i) Receiving government subsidized electricity sale contracts (such as feed-in tariffs, tax incentives and stimulus funds), whose purpose is usually to help market penetration and allow time for improving competitiveness, although the technology needs to evolve further before its competitiveness could be improved.38,39,Reference Mufson43,Reference Böhringer, Landis and Reaños44 Such support schemes create a short-term market pull, but could better benefit long-term perspective with greater consideration of other factors, such as those proposed in this paper.
(ii) Hybridizing the solar plant with a substantial boost from fuel (e.g., natural gas) combustion (sometimes 20% or more of the total generation), while receiving subsidized feed-in-tariffs for all the electricity sold, including that generated by fuel combustion.Reference Danelski45
A possible way to mitigate some of the adverse effects listed above, which can hasten the transition to renewables, is to encourage fossil fuel producers and users to invest a portion of their profits into renewables (including energy storage) as an alternative to the likely ever high carbon taxation.Reference Taylor, Paiva and Slocum46
II.2 Examples of objectives and fundamental design requirements
In this section we illustrate the method of defining the general objectives of the project and the fundamental system design requirements for making the best-suited system to meet these objectives.
The following are examples of different energy endeavors, having diverse general objectives:
(a) Provide electricity for remote settlements, not connected to a centralized grid.Reference Akinyele, Belikov and Levron47
(b) Distributed generation of electricity, connected to a centralized grid48
(c) Ensure electricity supply to the grid during peak demand.49
(d) Provide heat for industrial processes, including enhanced oil recovery (EOR)Reference Bierman, O’Donnell, Burke, McCormick and Lindsay50 with minimal environmental effects.
(e) Provide extensive supply of renewable energy, aiming to gradually replace most or all of the fossil fuel combustion in a highly populated region (e.g., a state or a country).Reference Klare51
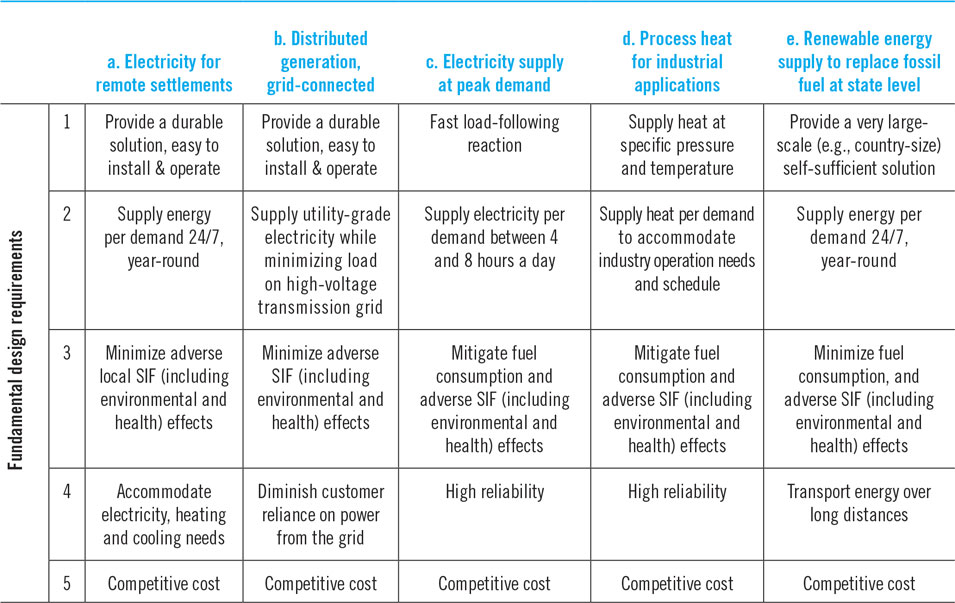
These undertakings have very different objectives. In all of them the customer should define the fundamental requirements that the system must satisfy. Generally, these requirements are different for each case, and will comprise technological, environmental, economic, societal and possibly even political issues. Table 2 lists plausible fundamental design requirements of systems capable of meeting the objectives listed above. Five prominent requirements are listed for each one, although likely there are others. Obviously, each specific case has a different set of requirements.
Plausible fundamental design requirements of several solar energy systems with different objectives.

Table 2 shows that projects with different objectives typically share some similar requirements:
(i) Most require dispatchable supply, each one per its demand scenario.
(ii) The selected solutions should reduce SIF effects.
(iii) The selected solutions must be cost competitive, in comparison to other options.
Consideration of such common requirements may allow adoption of certain aspects of the solutions to different projects. This can reduce the cost and time required to optimize and implement solutions.
III. Determination of energy cost
III.1 Suggested framework
Solar energy conversion systems can produce and sell energy in the form of electricity, heat, or chemicals, such as fuels. Hence, the specific cost of the product is a monetary value divided by a total system energy yield value, e.g., $/kWh, or $/kJ.
It is necessary to define a consistent generally applicable method for comparing a wide range of different alternatives. The profitability parameters—Net Present Value (NPV), Internal Rate of Return (IRR) and Yield—are obviously important, but they greatly depend on the assumed sale price and projected cash flow scenario. When the system is at the development and demonstration stages, the estimated sale price and cash flow scenario of the future product are usually, at best, rough educated guesses. Even after the technology is commercialized, its sale scenario and price could vary widely from one project to the next. Therefore, to have a useful and reliable tool for cost-comparison of different systems, it is better to first estimate the specific cost of producing the desired energy commodity, i.e., the Levelized Energy Cost (LEC) [also known as the Levelized Cost of Energy (LCOE)]. A lower LEC would lead to an improvement of the other profitability indicators and enhance the system’s competitiveness.
Evaluation of the LEC includes case-specific and site-specific assumptions, e.g., solar resource, financing terms, labor cost, taxation, SIF (including environmental and health effects), insurance and other charges. Scheduling effects (e.g., load shifting and required energy storage), which take place once a plant is operating, must also be included during the design phase, when assessing the project value and alternatives. When comparing options, one must apply appropriate assumptions to each of the alternatives, to ensure they are all on common ground.
III.2 Definition of the levelized energy cost (LEC)
An LEC expression is needed that can be applicable for all energy systems. It can then be the main cost-comparison parameter between potential systems for a specific project.
The LEC is commonly defined as52,Reference Musi, Grange, Sgouridis, Guedez, Armstrong, Slocum, Calvet, Al Obaidli, Calvet and Richter53
 $${\rm{LEC}} = {{{\rm{Total}}\;{\rm{cost}}\;{\rm{over}}\;{\rm{the}}\;{\rm{lifetime}}\;{\rm{of}}\;{\rm{the}}\;{\rm{generation}}\;{\rm{plant}}\;\left( {{\rm{in}}\;{\rm{constant}}\;{\rm{\$ }}} \right)} \over {{\rm{Total}}\;{\rm{net}}\;{\rm{energy}}\;{\rm{produced}}\;{\rm{by}}\;{\rm{the}}\;{\rm{plant}}\;{\rm{over}}\;{\rm{its}}\;{\rm{life}}\;{\rm{span}}\;\left( {{\rm{in}}\;{\rm{kWh}}} \right)}},$$
where “Total cost” includes all the costs to procure the plant and to operate it (including decommissioning expenses), and “Total net energy” means that energy consumed by the plant for its operation was subtracted from the total energy produced by the plant. The hourly variation of solar input, ambient temperature and other environmental conditions, operational constraints (e.g., threshold Direct Normal Irradiance (DNI) for STPP), and degradation of performance must all be included in the evaluation of production.
Since most energy generation systems operate in a closely repeatable annual cycle, Eq. (1a) can be written asReference Pitz-Paal, Dersch, Milow, Téllez, Ferriere, Langnickel, Steinfeld, Karni, Zarza and Popel54
 $${\rm{LEC}} = {{{\rm{Total}}\;{\rm{annual}}\;{\rm{cost}}\;{\rm{of}}\;{\rm{the}}\;{\rm{generation}}\;{\rm{plant}}\;\left( {{\rm{in}}\;{\rm{constant}}\;{\rm{\$ }}} \right)} \over {{\rm{Total}}\;{\rm{net}}\;{\rm{annual}}\;{\rm{energy}}\;{\rm{produced}}\;{\rm{by}}\;{\rm{the}}\;{\rm{plant}}\;\left( {{\rm{in}}\;{\rm{kWh}}} \right)}}{\rm{,}}$$
where both production and cost are annualized, as explained in Section III.3. All the parameters are evaluated at the point of delivery to the customer (e.g., grid connection and fuel storage).
The wording “Total net annual energy produced by the plant…” appearing in the denominator of Eq. (1b) is adequate when the energy is produced by fuel combustion, which can be turned on and off, or adjusted per the required energy demand. But it can be misleading when projecting the electricity output of plants using intermittent sources, such as solar or wind energy. When calculating the LEC of solar power plants based on energy production, which is customary,52–56 it is assumed that the plant would be able to sell all the electricity it could produce, over its entire lifetime. But the hourly, daily and seasonal changes of the irradiance have no relation to the variation of electricity demand. Therefore, it is not guaranteed that the power distributer, who is responsible for dispatching electricity per customer demand, will always be able, or willing, to accept electrical power, which is not synchronized with the demand. When the intermittent supply is only a small part (say, up to about 20%) of the total power demand, the distributer can usually handle it using tolerable adjustments of the power supplied by its other sources, e.g., fuel-driven steam and gas turbines. Integration of a larger share of intermittent sources involves sophisticated grid management and balancing schemes.Reference Notton, Nivet, Voyant, Paoli, Darras, Motte and Fouilloy57,58 When such measures are insufficient or unavailable, some of the other power plants (e.g., steam-Rankine units) are forced into production fluctuations that could significantly reduce generation efficiency and machinery’s longevity; hence, their LEC is increased.Reference Van den Bergh and Delarue41,Reference Kumar, Besuner, Lefton, Agan and Hilleman42 Alternately, excess intermittent renewable generation can lead to curtailment of supply.Reference Temple34,Reference Zhou and Lu35,Reference Luo, Dan, Zhang and Guo59 In some cases power purchase agreements (PPAs) include provisions for sharing the risk of curtailment between suppliers and grid operator,Reference Bird, Cochran and Wang60 so some of the generated power is not paid for. In other cases, negative prices are imposed,Reference Amelang and Appunn61,Reference Starn62 penalizing either the producers (lowering their income) or the customers, who may have to pay a surcharge, e.g., in the form of high tax rates (over 50% in countries such as Denmark and Germany).63
Energy storage is a way to enable adequate dispatchability of energy derived from an intermittent resource, like solar radiation, but it can have a significant influence on the system cost. See discussion in Section V.
Energy transmission can also help increase the amount and profitability of energy sold. There are several interrelated parameters affecting energy transmission methods and viability:Reference Zhou and Lu35,Reference Luo, Dan, Zhang and Guo59,Reference Chien, Yang and Zhang64,Reference Temple65
(i) transmission distance and means;
(ii) energy form (e.g., electricity or fuel);
(iii) accessibility and cost of the energy transmission;
(iv) demand and storage conditions at the endpoints.
Presently, curtailment and uneconomical, including negative, pricing occur in the United States, Europe, and China, where electricity is transmitted in relatively advanced power grids.Reference Chien, Yang and Zhang64,Reference Sterling, Stearn, Davidovich, Quinlan, Pang and Vlahoplus66–Reference Yasuda, Bird, Carlini, Estanqueiro, Flynn, Forcione, Lazaro, Higgins, Holttinen, Lew, Martin-Martinez, McCann, Menemenlis, Smith, Betancourt and Ackermann68 Various studies show that further expansion, improved transmission and smart management of the grid can improve dispatchability of intermittent renewables.Reference Chien, Yang and Zhang64–Reference MacDonald, Clack, Alexander, Dunbar, Wilczak and Xie70 However, these studies do not suggest that curtailment and/or uneconomical pricing could be eliminated without energy storage. It is projected that in most markets, if power supply from intermittent renewables is increased according to plan, curtailment and/or negative pricing will also increase, despite optimistic models of future grid improvements.Reference Chien, Yang and Zhang64,Reference Temple65 The reality is that as electricity producers using intermittent sources attempt to further increase their supply, without synchronizing it with demand conditions, they reach a point where the distributor is no longer able to accept all the electricity that could be generated by these sources. Consequently, as the installed capacity of plants using solar and/or wind energy increases, it is less likely that intermittent energy suppliers could obtain long-term (e.g., >10–12 years) Power Purchasing Agreements (PPAs) with a guarantee from the distributor to buy all the energy they could produce at a fixed price. Indeed, PPAs, which include a combination of fixed and variable price components, time-of-day price caps, and even utility-controlled production rate are becoming common in areas where there is extensive use of solar or wind power.Reference Sterling, Stearn, Davidovich, Quinlan, Pang and Vlahoplus66
In some cases PPAs may include quantity-dependent pricing (i.e., lower price for power above a certain level). The sold energy should be normalized to reflect the different values of the product, including factoring in of curtailment and negative pricing. When comparing options one must be careful to use the same assumptions for all the alternative technologies, both for the generation of power and for the ability to sell it, although their implementation might differ. For example, in some cases, different technology-dependent PPA structures or financing terms may be used in the same location. Nonetheless, to ensure a common denominator, in this study, it is assumed that the customer terms of all PPAs are the same for all alternative technologies.
Since curtailment is a realistic possibility, a better definition of the LEC than Eqs. (1a) and (1b), which can prevent overestimation, is
 $${\rm{LEC}} = {{{\rm{Total}}\;{\rm{annual}}\;{\rm{cost}}\;{\rm{of}}\;{\rm{the}}\;{\rm{generation}}\;{\rm{plant}}\;\left( {{\rm{in}}\;{\rm{constant}}\;{\rm{\$ }}} \right)} \over {{\rm{Total}}\;{\rm{annual}}\;{\rm{energy}}\;{\bf{sold}}\;{\rm{by}}\;{\rm{the}}\;{\rm{plant}}\;\left( {{\rm{in}}\;{\rm{kWh}}} \right)}}{\rm{,}}$$
where
 $${{{\rm{Total}}\;{\rm{annual}}\;{\rm{energy}}\;{\rm{sold}}} \over {{\rm{Total}}\;{\rm{annual}}\;{\rm{net}}\;{\rm{energy}}\;{\rm{production}}\;{\rm{capacity}}}} \equiv {{{E_{{\rm{sold,yr}}}}} \over {{E_{{\rm{net ‐ cap,yr}}}}}} \equiv \xi \le 1.$$
Note that ξ is different from the Capacity Factor (CF)—the ratio between the net energy generated and the energy that could have been generated at continuous full-power operation during the same period.
An important objective of the plant’s design and financial planning is to maximize the amount of energy sold by the plant, i.e., strive to reach the conditions where ξ ≈ 1, for the lifetime of the plant. Achieving this goal, without hindering the operation of other plants can significantly reduce the LEC and improve profitability, especially of large-scale plants (several hundred MWe, or larger); it would also be embraced by power distributers and regulatory authorities.
Energy storage can be used for increasing ξ. However, in general, the preferred energy storage method for alleviating or eliminating dispatchability problems caused by hourly and daily fluctuation of solar irradiance is not necessarily also the best storage solution for seasonal variations of daily solar energy input. Hence, selecting the best storage means for meeting the system design requirements and minimizing the LEC may not be a simple task. Selection of a storage method (or methods) is discussed in Section V.
III.3 The levelized energy cost (LEC) function
Based on the above discussion and Eq. (1c), the general mathematical expression of the LEC function is
 $${\rm{LEC}} = {{{\rm{fcr}} \cdot {C_{{\rm{invest}}}} + {C_{{\rm{O\& M}}}} + {C_{{\rm{fuel}}}}} \over {{E_{{\rm{sold,yr}}}}}} = {{{\rm{fcr}} \cdot {C_{{\rm{invest}}}} + {C_{{\rm{O\& M}}}} + {C_{{\rm{fuel}}}}} \over {\xi {E_{{\rm{net ‐ cap,yr}}}}}},$$
where C invest is the total capital expenditure (CapEx) in the plant’s Engineering, Procurement and Construction (EPC), and all other related expenses; C O&M includes all the plant’s annual operation and maintenance costs (e.g., including rent and capacity-based taxes) and periodic expenses, such as major services (including some part replacements) and end-of-life decommissioning costs; C fuel is the plant’s annual fuel cost; ξ, E sold,yr, and E net-cap,yr are defined in Eq. (2a).
Note that the fuel cost is considered separately from O&M, as is a common practice in solar systems, where often very little or no fuel is used. When the fuel provides less than about 5% of the total energy input, its effect on the LEC is negligible and C fuel can usually be deleted from the LEC equation.
The definition of the Annualized Fixed Charge Rate (also called the Annuity Factor), fcr, is52,Reference Pitz-Paal, Dersch, Milow, Téllez, Ferriere, Langnickel, Steinfeld, Karni, Zarza and Popel54
 $${\rm{fcr}} = {{{k_{\rm{d}}}{{\left( {1 + {k_{\rm{d}}}} \right)}^N}} \over {{{\left( {1 + {k_{\rm{d}}}} \right)}^N} - 1}} + {k_{{\rm{insurance}}}},$$
where k d is the cost of capital (the real debt interest rate); k insurance is the annual insurance cost rate (which could be considered part of the O&M, but is introduced here per common practice); and N is the depreciation period in years.
The term  ${{{k_{\rm{d}}}{{\left( {1 + {k_{\rm{d}}}} \right)}^N}} \over {{{\left( {1 + {k_{\rm{d}}}} \right)}^N} - 1}}$ is called the Capital Recovery Factor (CRF).
Equation (1d) is the general LEC equation of all energy systems, but the parameters of E net-cap,yr are different for different energy conversion systems. Introducing the parameters of E net-cap,yr for a solar energy conversion system, Eq. (1d) becomes
 $${\rm{LEC}} = {{{\rm{fcr}} \cdot {C_{{\rm{invest}}}} + {C_{{\rm{O\& M}}}} + {C_{{\rm{fuel}}}}} \over {\xi {\eta _{{\rm{sys,yr ‐ avg}}}}{A_{{\rm{collector}}\;{\rm{aperture}}}}\int_{{t_{{\rm{yr}}}}} {{I_{{\rm{irrad}}}}{\rm{d}}t} }},$$
where A collector aperture is the collector aperture area (in m2), i.e., the total area designated for collecting (and in some cases also reflecting) solar radiation; t yr is the time of the year (in hours); I irrad is the solar irradiance (kW/m2) at the plant’s site, at a given time; and  $\int_{{t_{{\rm{yr}}}}} {{I_{{\rm{irrad}}}}{\rm{d}}t}$ is the annual solar radiation energy on a unit area (kWh/m2/year). Note that in systems with no radiation concentration means (e.g., conventional photovoltaic, or rooftop solar-thermal collectors), the I irrad is either the Global Horizontal Irradiance (GHI) or the Global Tilted Irradiance (GTI), whereas in systems using concentrating means (e.g., concentrator photovoltaic, or solar-thermal power generation), the I irrad is the DNI.
ηsys,yr-avg is the overall system efficiency averaged over one year, or, overall annual-average system efficiency; it is defined as
 $${\eta _{{\rm{sys,yr ‐ avg}}}} = \prod\limits_1^n {{\eta _{i{\rm{,yr ‐ avg}}}}} \quad ,$$
where ηi,yr-avg are the annual-average efficiencies of all the components of the specific system under evaluation, including parasitic losses associated with the plant’s operation.Reference Karni, Chen, Prasad and Jaduria55
Equation (1e) shows that, in addition to cost reductions, increasing either ξ, ηsys,yr-avg, or  $\int_{{t_{{\rm{yr}}}}} {{I_{{\rm{irrad}}}}{\rm{d}}t}$ would lead to LEC reduction. Increasing the overall annual-average system efficiency, ηsys,yr-avg, is especially effective in reducing the LEC, since it leads to smaller radiation collection area, per a given energy output, thus reduces C invest and C O&M. Conversely, although A collector aperture appears in the denominator of the LEC equation, increasing it would result in a corresponding increase in C invest and C O&M, and often a decrease of the overall annual-average system efficiency, ηsys,yr-avg; therefore, increasing A collector aperture would not, in general, contribute to LEC reduction. Detailed discussions of the system efficiency and LEC, and their parameters are provided in various references.Reference Musi, Grange, Sgouridis, Guedez, Armstrong, Slocum, Calvet, Al Obaidli, Calvet and Richter53–56
In mature, commercial solar and wind power plants, using little or no fuel and having relatively small O&M costs (≤5% of the capital cost per year), the LEC is roughly proportional to the capital cost divided by sold energy:
 $${\rm{LEC}} \propto {{{C_{{\rm{invest}}}}} \over {{E_{{\rm{sold,yr}}}}}}.$$
Equation (5) is a good “LEC indicator”, especially useful as a first estimate, when comparing the relative LEC of different solar power generation systems.
It should also be considered what else society could do with the resources to be spent on the renewable energy system to improve its well-being. For example, if they were spent on mass transit could greater CO2 reduction be obtained than installing more solar and wind? What yields the best jobs and other opportunities for the community? What minimizes the overall negative impact on the environment and health? Such questions and other important issues related to social, economic, environmental and political impacts of renewable and other energy technologiesReference Olson and Lenzmann71–Reference Demırbas74 are beyond the scope of this article. However, it is hypothesized here that they can be accounted for by multiplying the LEC by a Societal Impact Factor (SIF) which is set to unity until sociologists, urban planners, environmental scientists and economists can define how to value it. The SIF is real, as is the case where burning fossil fuels generates immediate wealth for some, but causes long-term health issues for people and the planet—all of which should (and can) be represented by cost models. Inclusion of the SIF, properly valued, may enable a more comprehensive, clearer assessment of the available options, and more “real” conclusions, in particular, when the cost of renewables is competitive with fossil fuels. For example, giant wind turbines in a residential area, or far away from the grid and where power is needed, may increase the effective LEC, whereas giant wind turbines offshore, but near densely populated coastal regions may have a SIF of about 1 (or perhaps <1), and thus would not increase the LEC.
The SIF is introduced to the methodology presented in this article in the form of three factors associated, respectively, with the CapEx, O&M and fuel terms in the numerator of Eq. (1e). The general expression of the LEC then becomes
 $${\rm{LEC}} = {{{\rm{fcr}} \cdot {C_{{\rm{invest}}}} \cdot {K_{{\rm{SIF &amp;amp;#x2010; IN}}}} + {C_{{\rm{O\&amp; M}}}} \cdot {K_{{\rm{SIF &amp;amp;#x2010; OM}}}} + {C_{{\rm{fuel}}}} \cdot {K_{{\rm{SIF &amp;amp;#x2010; F}}}}} \over {\xi \cdot {\eta _{{\rm{sys,yr &amp;amp;#x2010; avg}}}} \cdot {A_{{\rm{collector}}\;{\rm{aperture}}}} \cdot \int_{{t_{yr}}} {{I_{{\rm{irrad}}}}{\rm{d}}t} }}\quad ,$$
where K SIF-IN is the SIF associated with the capital investment (CapEx), K SIF-OM is the SIF associated with operations and maintenance (O&M) and K SIF-F is the SIF associated with fuel production, handling and use. As mentioned in relation to Eq. (1d), in many solar energy systems, less than 5% of the total energy input comes from fuel and the term containing C fuel can usually be deleted from the LEC calculation, unless its SIF is much larger than 1.
III.4 LEC for cogeneration of two or more products
Equation (1f) should be used for determining the LEC of all solar energy conversion systems, which produce and sell a single product, e.g., heat, electricity, or fuel. Some systems may produce and sell more than one product, for example, heat and electricity, heat and fuel, electricity and fuel, or all three of these products. In such cases Eq. (1f) should be modified accordingly:
 $${\rm{LEC}} = {{{\rm{fcr}} \cdot {C_{{\rm{invest}}}} \cdot {K_{{\rm{SIF &amp;amp;#x2010; IN}}}} + {C_{{\rm{O\&amp; M}}}} \cdot {K_{{\rm{SIF &amp;amp;#x2010; OM}}}} + {C_{{\rm{fuel}}}} \cdot {K_{{\rm{SIF &amp;amp;#x2010; F}}}}} \over {\left[ {\sum\limits_i {\xi \cdot {\eta _{{\rm{sys,yr &amp;amp;#x2010; avg}}}}} } \right] \cdot {A_{{\rm{collector}}\;{\rm{aperture}}}} \cdot \int_{{t_{{\rm{yr}}}}} {{I_{{\rm{irrad}}}}{\rm{d}}t} }},$$
where ξi and ηsys,yr-avg,i are calculated for each of the products, based, respectively, on Eqs. (2a) and (4), and
 $$\sum\limits_i {{\xi _i} \le 1} .$$
Note that when there is only one product, Eq. (1g) becomes identical to Eq. (1f).
Examples of such systems are discussed in Section VI.
IV. Methodology for selecting the best-suited solar system configuration
The objectives, fundamental system design requirements and the method for estimating the cost of the energy produced and sold were discussed in the previous sections. The task now is to develop a systematic, executable and impartial methodology for optimizing the system configuration such that all the system design requirements are met and the LEC is minimized.
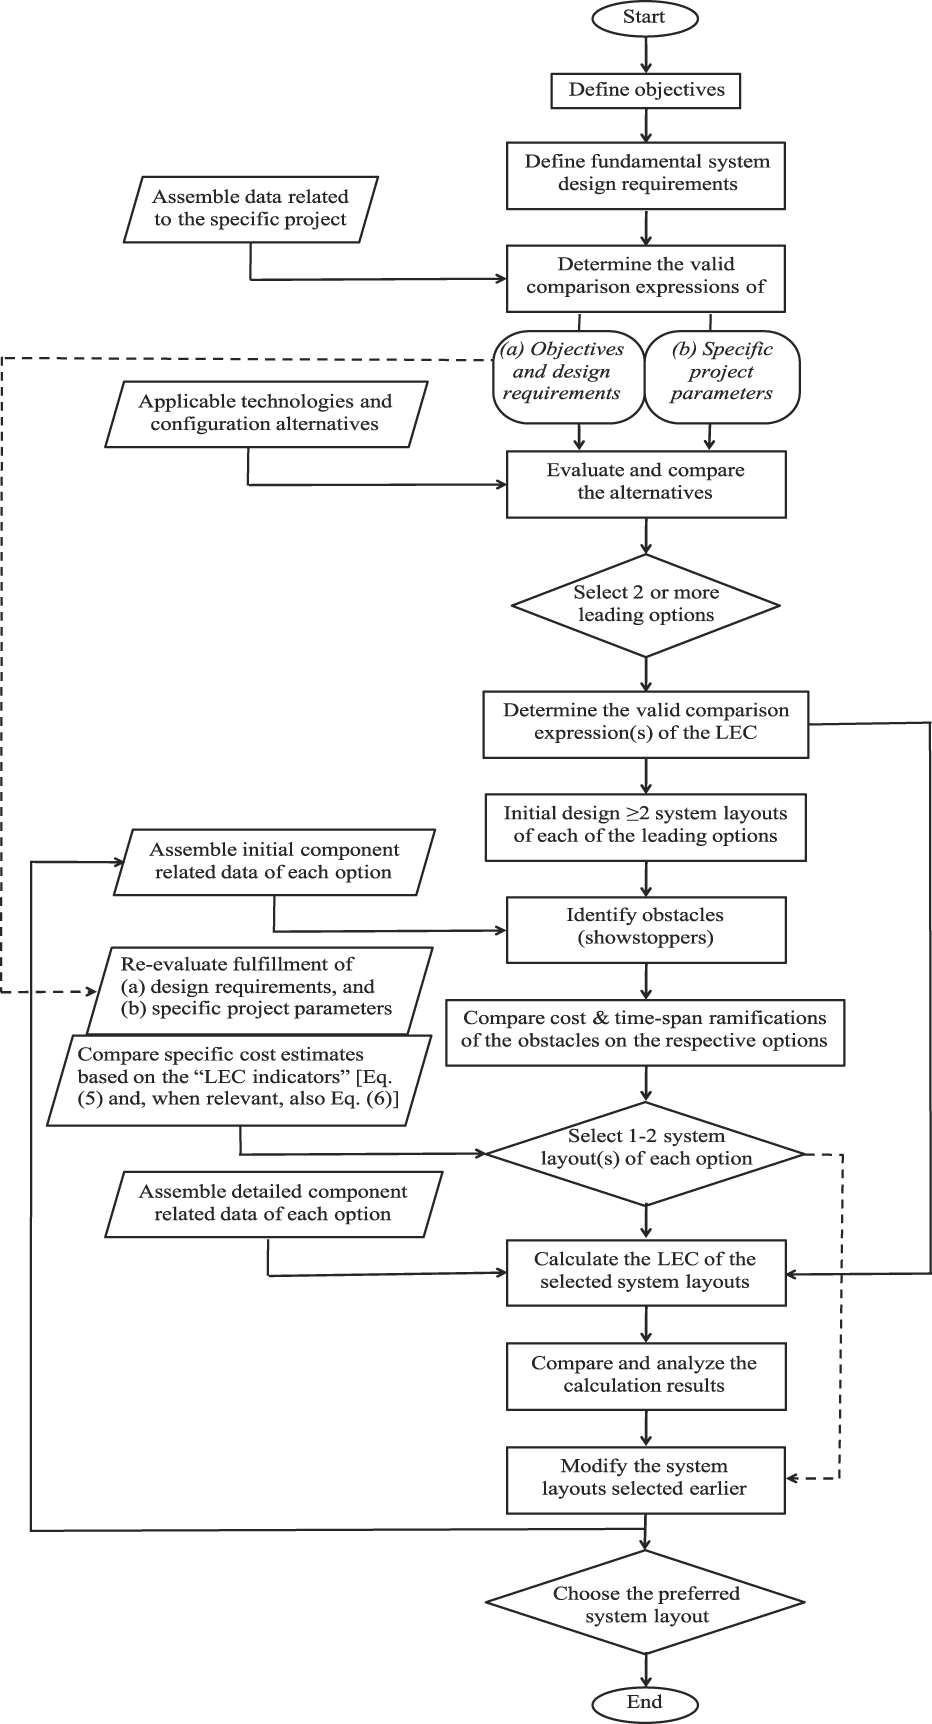
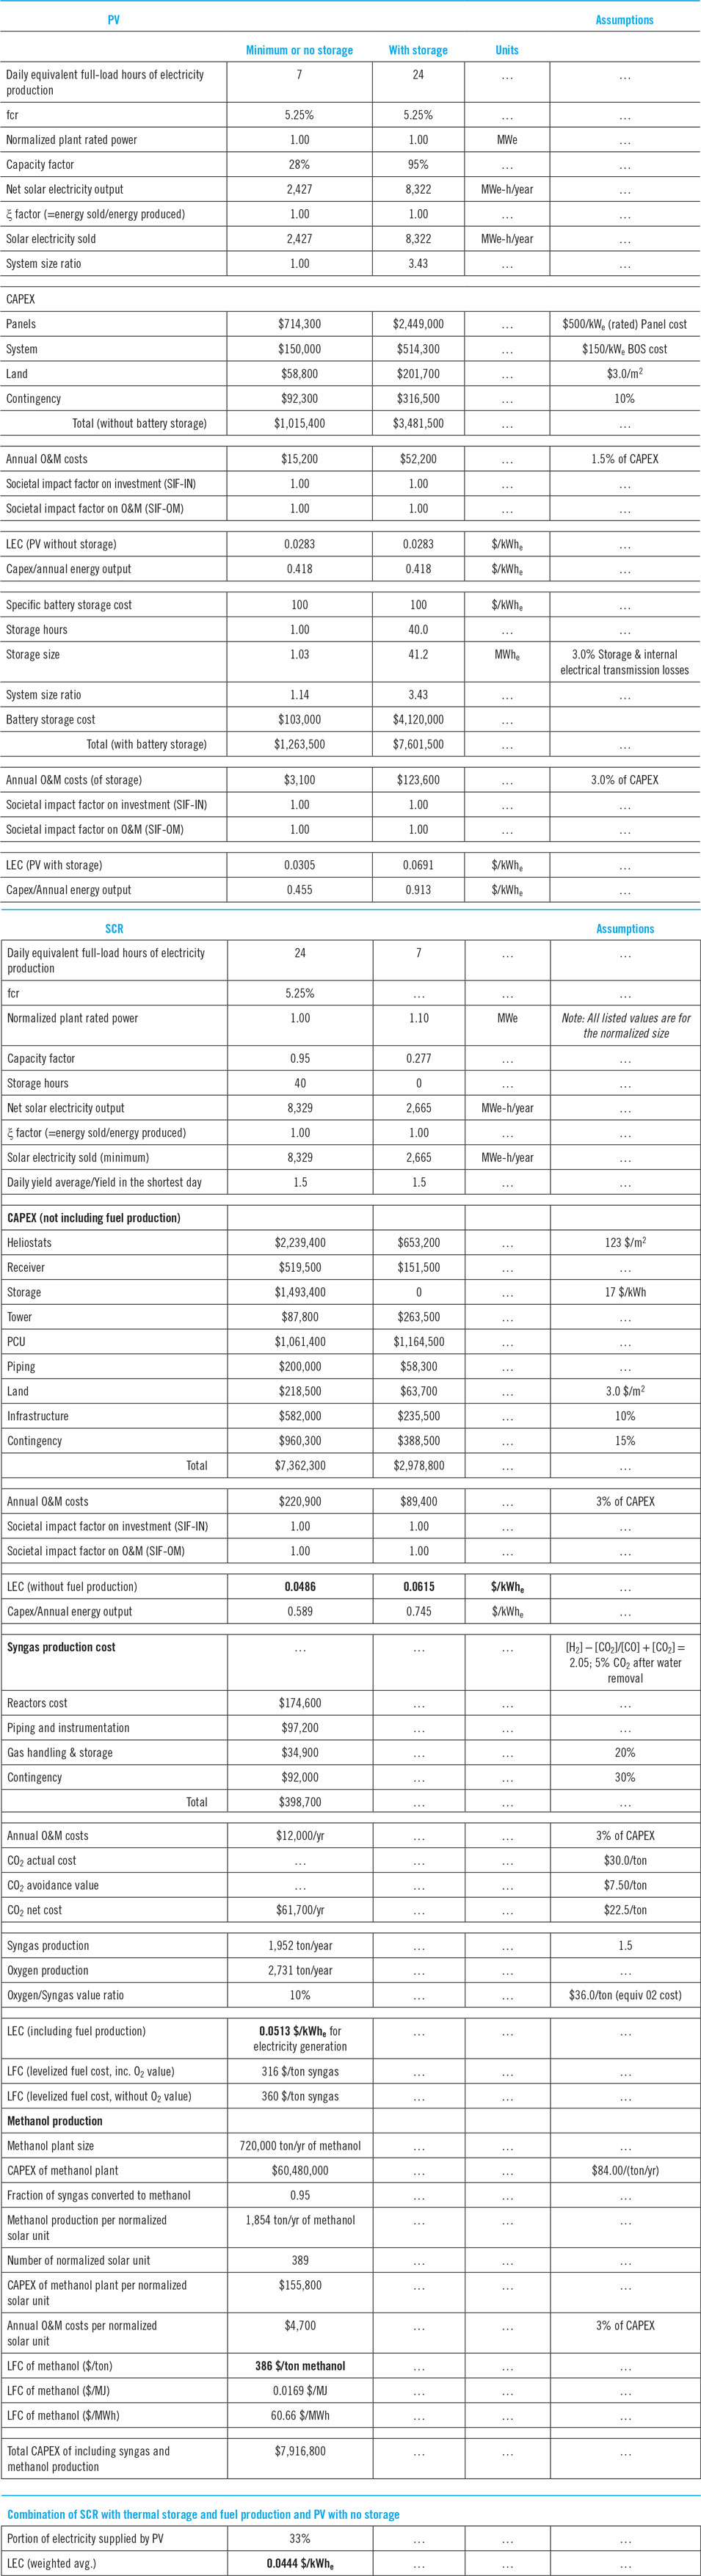
Appendix 1 provides an algorithm of the generalized method for assessing and selecting a suitable energy system. It also includes a flow chart of the assessment process (Fig. 11) and a calculation example (Tables 5 and 6). As shown there, the project objectives, fundamental design requirements, specific project parameters, technical obstacles, and the LEC are all part of the system selection process.
The sections below provide insight and guidelines for the solution process.
IV.1 The overall energy conversion system as the focus of the optimization process
The discussion in Section III.3 describes how the system’s performance and LEC are linked together. With this in mind, after the system’s objectives and design requirements are established, the detailed system configuration, operating conditions, and components should be structured for meeting these requirements, while attaining the best overall system performance. This can be achieved by combining high efficiency, reliability and longevity with the largest possible energy sale (ξ ≈ 1), thus reaching the lowest product cost (LEC).
In the method suggested here, each component—i.e., every component of each system shown in Figs. 1–5 — is evaluated solely based on its contribution to (i) meeting the overall system’s design requirements and (ii) lowering the overall system’s LEC. Since the design and operation of each component often affect the design and operation of other components, improving a specific component, as a stand-alone unit, does not necessarily lead to the best system performance and lowest LEC.
It is apparent from published literature that much of the applied research and development related to solar (and other) energy systems address specific components or features of certain components.Reference Karni, Chen, Prasad and Jaduria55,75,76 While important, to fully assess the significance of such studies, they should routinely be accompanied or followed by an analysis of the potential impact of the study’s outcome on the overall performance and LEC of one or more selected systems. Often the latter evaluation is given little attention or is inadvertently overlooked.
Consideration of the overall system performance as the optimization target should be included in all stages of a project. System-wise optimization is inherent in the methodology presented in this article, but it is only the first step. Design, costing, construction and operation should all aim at getting the best out of the system as a whole, even though some of these tasks are performed in later phases of the project’s life, and are beyond the scope of this article.
Having the system performance as the goal does not imply that the quality of its individual components is not important. For a system to be successful, both its elements and their integration must be as optimal as possible. However, one must bear in mind cases where integrating the “best” component may actually have an adverse effect on the system. Some examples follow.
System versus components example 1: windowed volumetric receiver
Two of the present authors and coworkers, as well as other proficient R&D groups, have developed volumetric solar receivers whose radiation-absorbing surface, which is located in a cavity facing the incoming concentrated radiation, is placed behind a transparent window.Reference Karni, Kribus, Ostraich and Kochavi77–Reference Kribus, Doron, Rubin, Reuven, Taragan, Duchan and Karni79 These receivers have demonstrated an ability to sustain high sunlight concentration (1000×–2500×), high temperature (800–1200°C) and high pressure (up to 20 bar), while operating at a very high efficiency (typically >80%). Thousands of hours of operation of several precommercial receiversReference Sánchez80 have demonstrated excellent durability, including that of the fused silica (quartz) windows. Moreover, the projected specific costs of these receivers, at a high-volume production, are low relative to those of other receivers. In short, it appears that based on stand-alone performance and cost, the windowed volumetric receivers are better than other receivers used in, or developed for solar-thermal systems.
However, the size of these receivers is limited by the size of a commercially producible quartz window, which presently cannot exceed a diameter of 1 m. Consequently, the largest Power Conversion Unit (PCU), e.g., a recuperated Brayton cycle, that could be powered by heat from such a receiver would be rated at about 200–250 kWe. The thermal-to-electric efficiency of PCU’s at this size—averaged over the operating conditions of an entire year—is about 30%. This is low compared to larger PCUs, whereas the specific costs of such small PCU’s are high, in comparison to larger PCU’s. Hence, sadly, seemingly exceptional receivers may not lead to the best overall system performance and lowest product cost among the possible system configurations. For most implementations the preferred option, leading to a lower LEC of the overall system, seems to be an inferior receiver, which can be produced in a larger size, to match a more efficient PCU with a lower specific cost.
On the other hand, in solar-thermal systems, enlarging the PCU size and thus increasing its efficiency and lowering its specific cost, means the size of the collection/reflection area must also increase. This leads to a lower efficiency of the optical and receiver components in Solar Central Receiver (SCR) plants, and lower transmission efficiency in Trough plants. Evidently, optimization for best performance and lowest LEC of the overall system, not of any of its components, isn’t straightforward; it is discussed in detail in Sections IV.2.2 and V.
System versus components example 2: energy storage
Developers and suppliers of various storage technologies compare their units according to various parameters, such as energy density, storage capacity, power rating, discharge time, longevity, levelized cost and other parameters or usage categories.Reference Ibrahim, Ilinca and Perron81,Reference Guney and Tepe82 All of these are parameters of the storage unit alone. But integration of storage in an energy system may affect the performance and cost of other components. So, similar to the example with the volumetric receiver, the performance and cost of the storage component as a stand-alone unit are not adequate design parameters. What matters is how the storage affects the performance and LEC of the overall system; see Section V.
System versus components example 3: multi-junction PV cells
Multi-Junction (MJ) PV cells offer the highest solar radiation-to-electricity conversion efficiency of all solar energy conversion devices—MJ cells with >40% efficiency are available commercially, single cell efficiency of 46% has been demonstrated and 50% is within reach.83,84 In addition these cells are capable of operating with highly concentrated radiation (up to about 1000×). Hence, the total required cells’ area is reduced in proportion to the concentration ratio, which is more than enough for compensating for the increase in cell cost, relative to standard PV systems. But the remarkable characteristics of the MJ cells are offset by the requirement of high concentration PV (HCPV) systems for an optical focusing component and often a cell’s cooling component,Reference Dreger, Wiesenfarth, Schmid, Bett, Mine, Jager-Waldau and Helm85,Reference Kusek, Karni, Caraway and Lynn86 which substantially increase system’s cost and reduce its efficiency.
Consequently, overall system performance and LEC analyses show that high concentration PV (HCPV) systems using MJ cells with extremely high, unparalleled solar-to-electricity efficiency cannot compete terrestrially with systems using simple multicrystalline, or monocrystalline silicon cells, whose average efficiency over their lifetime is about 12–15%, or only 1/3rd that of MJ cells.
System versus components example 4: high temperature solar-driven thermochemical reactions
Extensive research programs, in various labs including ours, have been dedicated to high-temperature solar-driven chemical reactions. The objective in many cases is to develop endothermic processes, which use solar energy to increase the chemical potential of the reactants. Some examples are methane reforming, water splitting, CO2 dissociation, coal gasification, and reduction of various metal-oxides.Reference Piatkowski and Steinfeld87–Reference Tou, Michalsky and Steinfeld91 A significant number of these studies have included the development of innovative solar reactors, where the endothermic reaction is performed.Reference Piatkowski and Steinfeld87,Reference Klein, Karni and Rubin89,Reference Tou, Michalsky and Steinfeld91
Examination of the overall systems required for performing these processes at a commercial level reveals the following:
(i) In all cases, the reaction takes place only when the operating temperature reaches a certain value, which is typically at least 800°C and in some cases much higher. Hence,
(a) The mass of the reactor, its inlet/outlet piping and other “hot” components of a commercial facility are expected to be substantial. Consequently, their daily heating, after sunrise, until the desired reaction temperature is reached, may take considerable time and consume a significant portion of daily solar radiation input. Thus, the net energy produced by the thermochemical process is significantly reduced. The severity of this problem increases as the operating temperature is increased.
(b) Since daily cycling of the reactor and other “hot” components typically increases materials’ fatigue, it may reduce components longevity.
(ii) Some of these processes require very high temperatures, often more than 1300°C, even at atmospheric pressure. Examples are direct reduction of CeO2, Al2O3, MgO, Fe2O3/Fe3O4, etc. without introducing carbon or a hydrocarbon to the reaction. Reaching such high temperatures forces the optical system to provide a concentration ratio of ∼3000×, to maintain acceptable radiation and convection losses from the receiver/reactor. This leads to lower efficiency and higher cost of the optical component.
Such issues, related to the adverse effects of “improving” components on the overall system, must be taken into consideration in the system design. Unless an adequate solution is found, in each case, the “improved” component may cause a reduction of the overall system performance and an increase of the LEC. Hence, it should not be included in the optimized system solution.
IV.2 Guidelines for the selection of the system configuration and components
The discussion in Section III.3 explains that LEC reduction can be achieved by increasing ξ, ηsys,yr-avg, and/or  $\int_{{t_{{\rm{yr}}}}} {{I_{{\rm{irrad}}}}{\rm{d}}t}$, where ξ is related to the system configuration (see also Section V),
 $\int_{{t_{{\rm{yr}}}}} {{I_{{\rm{irrad}}}}{\rm{d}}t}$ is determined by the site selection, and ηsys,yr-avg depends on the components’ annual efficiencies and the interrelation between them.
The LEC can also be decreased by cost reduction: The system’s capital expenditure (CapEx), C invest, can be reduced by improvements of design and production methods and by increasing the overall annual-average system efficiency, ηsys,yr-avg. In addition, improvement of components’ durability and longevity reduces operation and maintenance costs (C O&M).
IV.2.1 Gathering initial system and components data
At this stage of the system selection process, the project’s objectives and system fundamental design requirement are defined, but the system configuration and operating conditions are yet to be determined. The selected system can be one of several options, included in the schematic configurations depicted in Figs. 1–5. For example, if a system objective is solely the production of electricity, all the system configurations shown schematically in Figs. 1, 2, and 4 are relevant options. If, in addition, the system must supply electricity during periods of no solar irradiation, all the configurations, which do not include storage, become irrelevant.
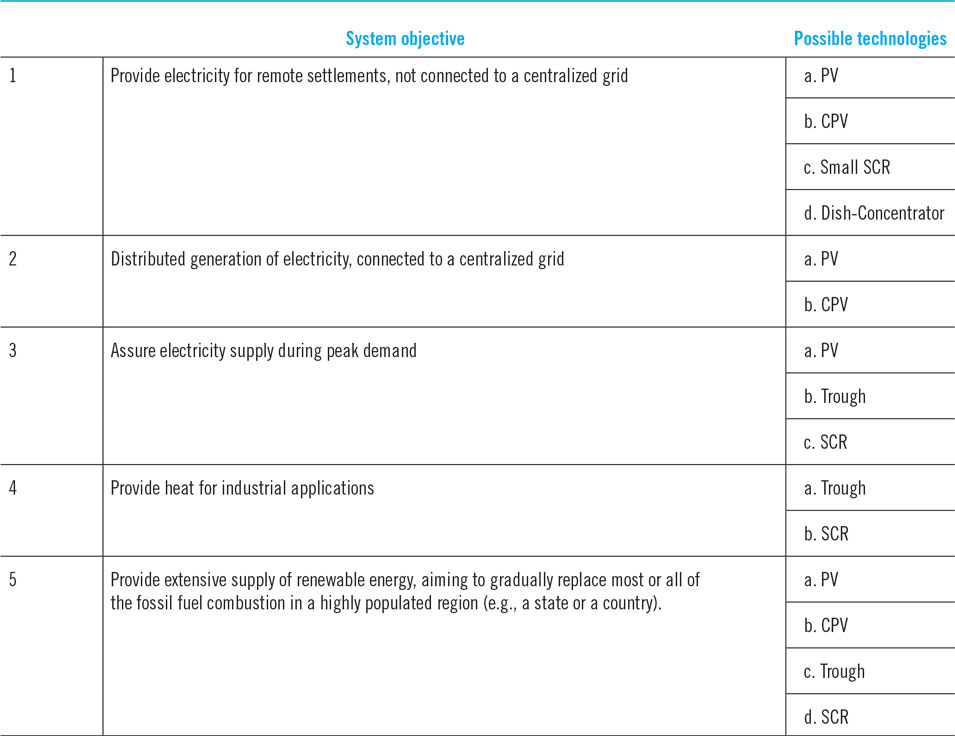
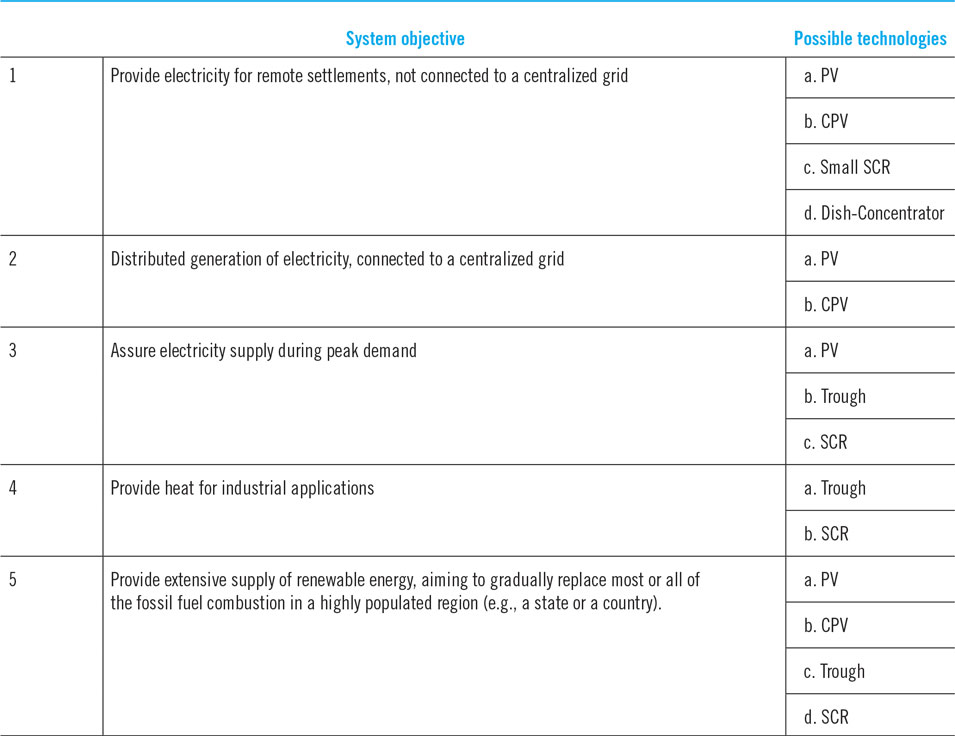
Table 3 provides possible system configurations that might be able to attain the objectives and design requirements of the systems discussed in Section II.2 and Table 2.
Possible general configurations for the systems discussed in Section II.2 and Table 2.
It is now necessary to accumulate data of all the possible systems and their components. These data should contain the information required for evaluating the fundamental system requirements, specific project and site parameters and LEC. For example:
(i) System data:
(a) required capacity
(b) identify possible system configurations
(c) potential site locations
(d) legal, environmental and safety requirements
(e) CapEx, specifically the EPC requirements and potential contractors
(f) operation and maintenance (O&M) over the plant’s lifetime
(g) decommissioning issues
(h) financing options
(i) societal impact (short- and long-term)
(j) environmental ramifications
(k) taxation
(l) safety and security
(m) special customer requirements
(ii) Data on each component of each system configuration:
(a) range of operating conditions and corresponding component efficiency.
(b) list of suppliers including component’s cost, supply time, durability/longevity, and O&M.
(c) effect on cost and operating conditions of other components.
IV.2.2 Boundaries and constraints
The next step is identifying boundaries and constraints, which confine the viable options included in the optimization process. Here are a few examples.
(a) Sufficient annual irradiation
As seen in Eq. (1f), the LEC is inversely proportional to the annual radiation energy. In a location where the annual GHI or DNI (depending on the system’s type) is below a certain level, there is little chance of achieving a sufficiently low LEC and reliable energy supply to be competitive with other energy production options. Our analysis and calculations indicate that at the present state of solar energy technologies, annual irradiation energy of 1800–1900 kWh/m2/year at the plant’s site seems to be a reasonable minimum solar irradiation requirement in most cases. Some PV systems’ providers may claim that they can make profit with less annual irradiation energy. According to our analysis, such claims can only be realistic if one or more of the following exists:
(i) the cost of electricity is generally high (say, ≥$100/MWeh) at the specific plant’s location.
(ii) no storage is required, yet there is a guarantee that all the produced power can always be sold (or credited) over the lifetime of the plant.
(iii) renewable electricity production is subsidized.
(b) other site-specific constraints
There are many site-specific conditions that could affect the performance and LEC of the plant, including latitude of the plant’s site, topographic limitations, restrictions due to environmental and wildlife preservation, distance from customer, grid availability, accessibility of the plant’s site, and climate conditions (e.g., possibility of severe storms, strong wind, dust or sand storms, monsoon season). Some factors affecting the project viability, such as political stability, socioeconomic situation, and cultural tendencies, may be difficult to predict or quantify. Yet, the ramifications of these conditions must be taken into consideration (see, e.g., the discussion of SIF in relation to Eq. (1f), at the bottom of Section III.3). In some cases they may be tolerated, or resolved by altering the system design, but in other situations they may force a change of the plant’s location.
(c) Limits on operating conditions
Example 1: constraints on the maximum operating temperature of solar-thermal systems
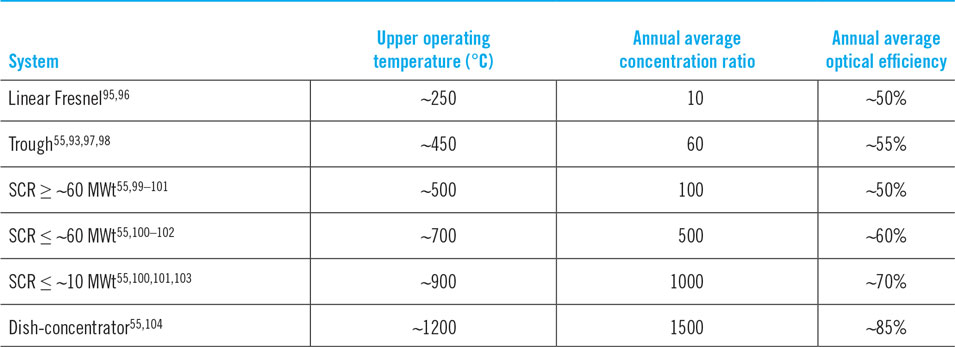
In solar-thermal systems (Figs. 3–5) the desired concentration of the irradiation flux provided by the optical component (collector/reflector) is coupled to the system’s upper operating temperature, i.e., the temperature of the working fluid supplied by the receiver.Reference Karni, Chen, Prasad and Jaduria55,Reference Fletcher and Moen92 It is well known that raising the operating temperature increases the attainable heat-to-work conversion efficiency. But in solar-thermal systems, when the upper operating temperature increases, the concentration ratio must also increase, or, due to reradiation emission and convection losses, the receiver efficiency would sharply decrease, especially at times when the DNI is relatively low (e.g., 600–700 W/m2).Reference Navas, Ollero and Rubio93 However, increasing the concentration ratio leads to reduction of optical efficiency, mostly due to an increase of spillage losses, and/or a larger number of reflections (if a secondary optic is used). It could also increase the cost of the optical component, due to stricter requirements on tracking accuracy, structure rigidity, reflective surface quality (reflectivity, surface waviness) and periodic cleaning. In addition, the increase in complexity may also reduce durability and longevity. Since different kinds of solar-thermal systems use different concentration methods, their respective optimum upper operating temperature, where the best overall system performance can be achieved, is also different. Table 4 lists the various solar-thermal systems, approximation of their highest recommended upper operating temperature, and the corresponding concentration ratio and annual-average efficiency of the optical component.
Recommended upper operating temperature and the corresponding annual-average concentration ratio and annual-average optical efficiency of solar-thermal systems.a
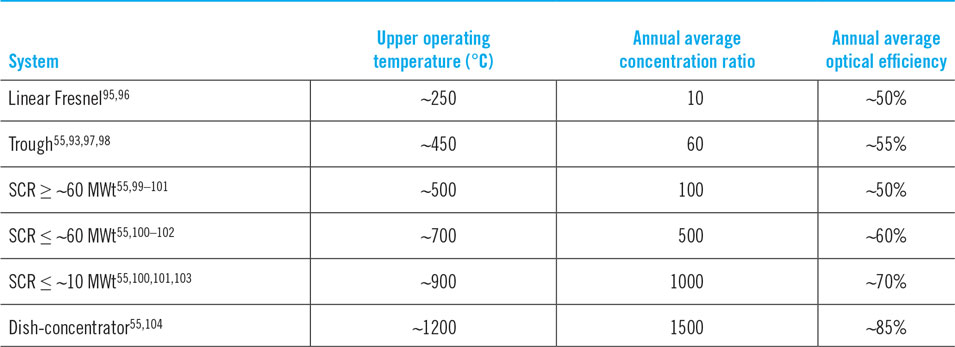
a The numbers in the table are approximations, based on several sources, and may vary due to the specific conditions at a given site.
The concentration ratios listed in Table 4 can be obtained by the optical component of the respective system at a relatively high annual-average optical efficiency. At these concentration ratios, a well-designed receiver component of the respective systems can operate at a relatively high annual average efficiency (>80%). Raising either the concentration ratio, or the upper operating temperature, or both above the values listed in Table 4 may reduce the overall annual-average system efficiency and increase the LEC. These are due to reduction of component efficiencies (namely, of the optical and receiver components) and a cost increase caused by stricter design requirements. For example, the upper operating temperature of trough systems is typically ∼400°C, due to limits of thermal oils used as the heat transfer fluids. However, the ∼450°C recommended upper operating temperature of trough systems, which is listed in Table 4, was attained based on the limitations of optical concentration and receiver efficiency of present troughs, not the heat transfer fluid constraints.Reference Karni, Chen, Prasad and Jaduria55,Reference Fletcher and Moen92,Reference Navas, Ollero and Rubio93 Following a scrutinized analysis of the overall system performance, current research looking to use molten salt to obtain higher trough operating temperature (up to ∼650 °C), is also seeking to increase the aperture diameter of the trough. This would increase the optical concentration, thus enable operation at higher temperature, with a potential for significant improvement of overall system efficiency.Reference Slocum, Campbell, Giglio, Bernasconi, Cardamone and Parow94
Example 2: minimum and maximum size of the collection area per PCU of a solar-thermal system
(i) Solar trough systems
As shown in Fig. 6, Power Conversion Units (PCUs) based on a steam-Rankine cycle are the best match for heat provided at the operating temperatures of trough systems. Commercial steam-Rankine units should be relatively large, typically 100 MWe or larger, to maximize efficiency and lower specific cost. But as the PCU size increases, the corresponding collection area of solar irradiation must also increase, leading to longer heat transmission pipes between the trough collectors and the PCU’s steam generator. So, increasing the PCU size would improve its efficiency and reduce its costs, but it would also decrease the efficiency of the heat-transmission’s piping assembly, and thus, in some cases, may increase the overall system LEC.
Comparison of the annual-average heat-to-electricity efficiency of selected PCU’s.Reference Karni, Chen, Prasad and Jaduria55  ${\eta _{{\rm{CN}}}} = 1 - \sqrt {{{{T_{\rm{L}}}} \over {{T_{\rm{H}}}}}}$ is the Chambadal-Novikov efficiency.Reference Bejan144 Reprinted from Ref. Reference Karni, Chen, Prasad and Jaduria55, page 76, Copyright (2012), with permission from Begell House, Inc., and an addition of the supercritical CO2 curve.

If storage is added, then the collection area is expanded and the PCU operation time increases, but the PCU’s size remains the same as it would be if storage were not added. Hence, in trough systems, adding storage leads to longer, more expensive and less efficient heat transmission component.
Based on the performance characteristic of present steam-Rankine units, the optimum size of a solar trough system with a single PCU is roughly between 50 MWe and 150 MWe, depending on storage size and the value of ξ [Eq. (2a)].
(ii) Solar Central Receiver (SCR)
An SCR unit with a single PCU can be made in different sizes, from less than 1 MWe to over 100 MWe. As shown in Table 4, the optical efficiency and practical concentration ratio of SCR systems significantly increase as the system size decreases.Reference Karni, Chen, Prasad and Jaduria55,Reference Collado and Guallar101,Reference Buck and Friedmann103 Combining the data in Fig. 6 with the recommended temperatures listed in Table 4, it is apparent that a steam-Rankine PCU is the best match for large SCR units (≥∼60 MWt), whereas a supercritical CO2 Brayton cycle (sCO2) appears to be the best choice for smaller SCR systems. sCO2 Brayton PCUs are still in development, entering early commercialization phase.Reference Patel105–107 Presently the attainable upper operating temperature (Turbine Inlet Temperature, TIT) of closed Brayton cycle sCO2 turbines, which can be integrated in solar-thermal systems is a little over 700°C and the smallest PCU size is 1 MWe.Reference Patel105
The optical component, responsible for the collection, reflection & concentration of the irradiance, and the PCU, responsible for the heat-to-power conversion, are the major cost drivers of SCR systems. Also, the possible variations of the annual-average efficiency of these components are large, relative to those of other components. In the early stage of trying to determine the optimum SCR’s unit size and configuration, it is helpful to use an initial estimate based on the combination of optical and PCU components, which provides the lowest ratio of capital costs to combined efficiency. Extending the approximation approach leading to Eq. (5), another “LEC indicator” can be used for a first comparison of alternative systems:
 $${\rm{LEC}} \propto {{{C_{{\rm{invest,Optics}}}} + {C_{{\rm{invest,PCU}}}}} \over {{\eta _{{\rm{Optics,yr &amp;amp;#x2010; avg}}}} \times {\eta _{{\rm{PCU,yr &amp;amp;#x2010; avg}}}}}}.$$
Minimizing this ratio, for example, by changing the size and configuration of a single system’s module, should lead to a lower LEC. Then one can introduce the other system components and parameters required for to the calculations of Eq. (5).
This approach can also be used to identify technological deficiencies and determine R&D focus. For example,
(i) The development of a PCU that can help reduce the ratio in Eq. (6) and therefore also the LEC.
(ii) The development of a receiver that can work efficiently at the optimum system conditions indicated by minimizing Eq. (6).
(iii) The development or selection of a storage method that fits best with the operating conditions dictated by minimizing Eq. (6).
IV.2.3 Revisit the system and components data
Following the process described in Sections IV.1, IV.2.1 and IV.2.2, it is now possible to calculate Eq. (5) for the different systems under consideration and select a small number (say, up to 3 or 4) of alternative system layouts.
Then the system and components data described in Section IV.2.1, should be revisited to improve performance and cost estimates of the selected alternatives, according to the following (and possibly additional) steps:
(i) System data:
(a) Expand and update the design requirement and reexamine the system configurations, taking into consideration the design constraints (Section IV.2.2).
(b) Identify preferred site(s) for building a plant (or plants).
(c) Revisit the legal, environmental and safety requirements and their effect on the project schedule and costs.
(d) Narrow the list of potential EPC contractors and improve the cost and schedule estimates (or quotes).
(e) Revisit the O&M estimates.
(ii) Data on each component:
(a) Specify the component design requirements.
(b) Revisit the required range of operating conditions and corresponding component efficiency, including the effect of other components.
(c) Revisit and firm up the list of suppliers and the details on cost, supply time, durability/longevity, and O&M, including the effect of other components.
IV.2.4 LEC evaluation and comparison between two or more system configurations
At this point the status of the system selection process is as follows:
(i) The objectives and design requirements were defined and the level of their fulfillment by the alternative systems has been rated (see Appendix 1).
(ii) The field has been narrowed to a small number (≤4) of alternative system layouts.
(iii) Detailed system and component data of each of the selected systems have been obtained.
It should now be possible to perform thorough LEC calculations using Eq. (1f) or (1g) and compare between the systems. This can typically be an iterative process where system layouts are adjusted after each iteration until no further improvement can be made. The best overall solution can then be chosen by comparing between the solutions of the different systems, based on fulfillment of the objectives and design requirements and lowest LEC.
V. Solution examples of a specific application
The process described above is demonstrated in this section for the system whose objective is “providing extensive supply of renewable energy, aiming to gradually replace most or all of the fossil fuel combustion in a highly populated region.”
As listed in the last column of Table 2, the fundamental design requirements of this system are as follows:
1. Provide a very large-scale (e.g., country-size) self-sufficient solution (i.e., needing no outside help)
2. Supply energy per demand 24/7, year-round
3. Minimize fuel consumption, and SIF (including environmental and health) effects
4. Transport energy over long distances
5. Competitive cost.
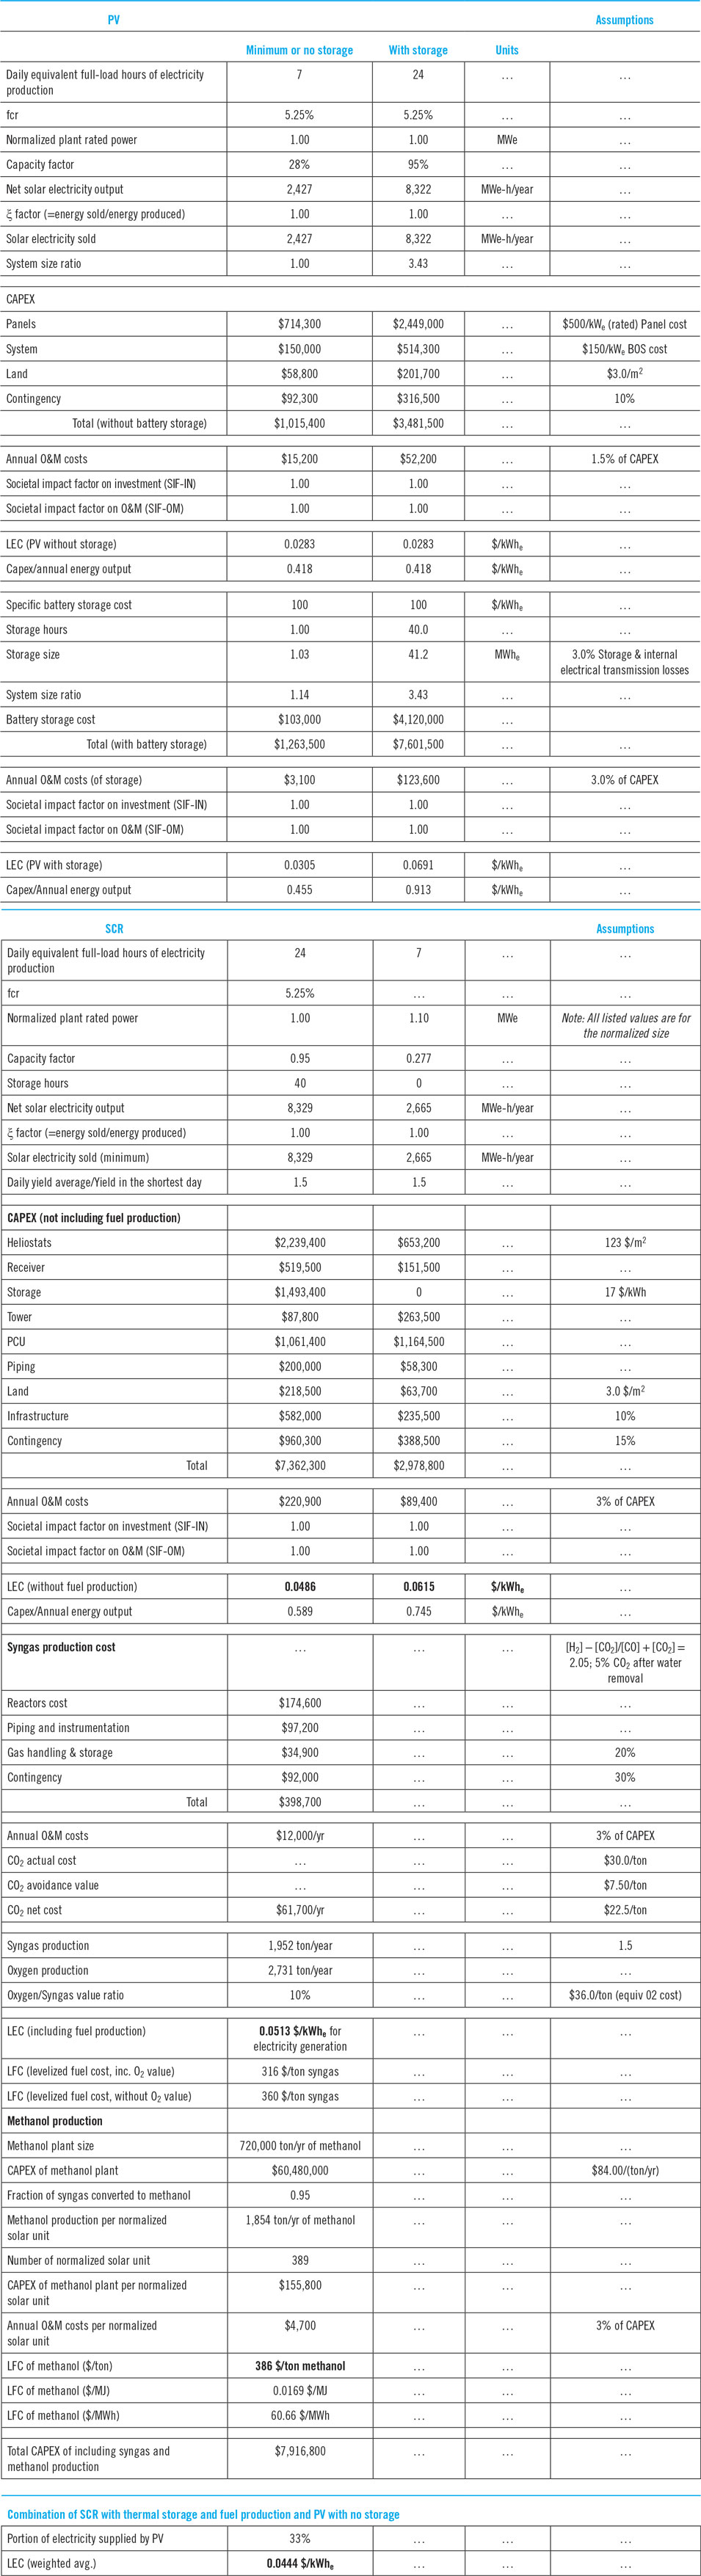
Four different configurations that might be used to accomplish the above objective and design requirements are listed in row 5 of Table 3. Initially we conduct two separate LEC comparisons, between the two photovoltaic options and the two solar-thermal options, respectively, using Eq. (5) and, in the solar-thermal case, also Eq. (6). The calculations can be repeated with different assumptions, for example, at several latitudes and/or annual DNI, different storage options and values of ξ, etc. In the present estimates, these variations affect the separated pairs of competing options very similarly. The initial calculations clearly show that in the case under consideration here (conventional) PV is superior to CPV and SCR is superior to Trough. A detailed system definition is therefore conducted for selected PV and SCR configurations.
A summary of these calculations is provided in Appendix 1, together with the algorithm and flow-chart of the assessment and comparison process. Whenever possible, the cost of components and other items in the calculation example provided in Appendix 1, were based on suppliers’ cost estimates. In the cost estimates of some items, which are still under development (e.g., the cost of battery storage, CO2, etc.), we chose a future-looking approach, relying on cost projections of the technology developers.
V.1 System configuration 1—PV
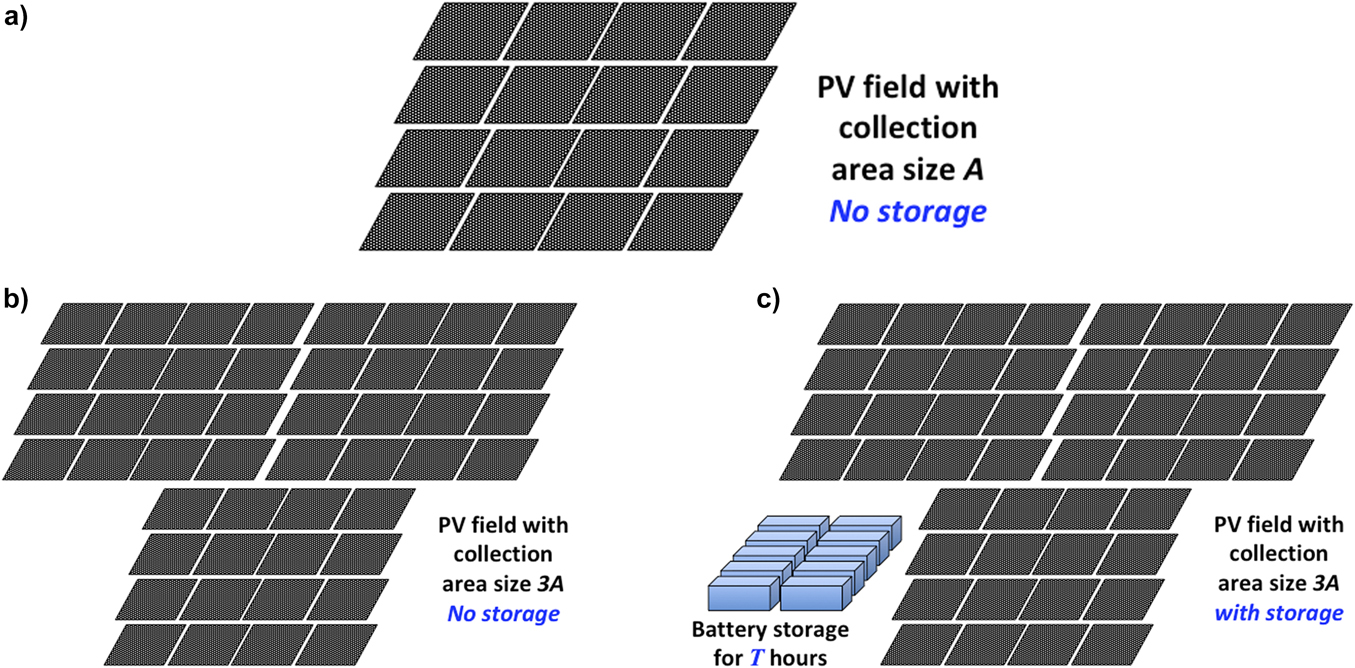
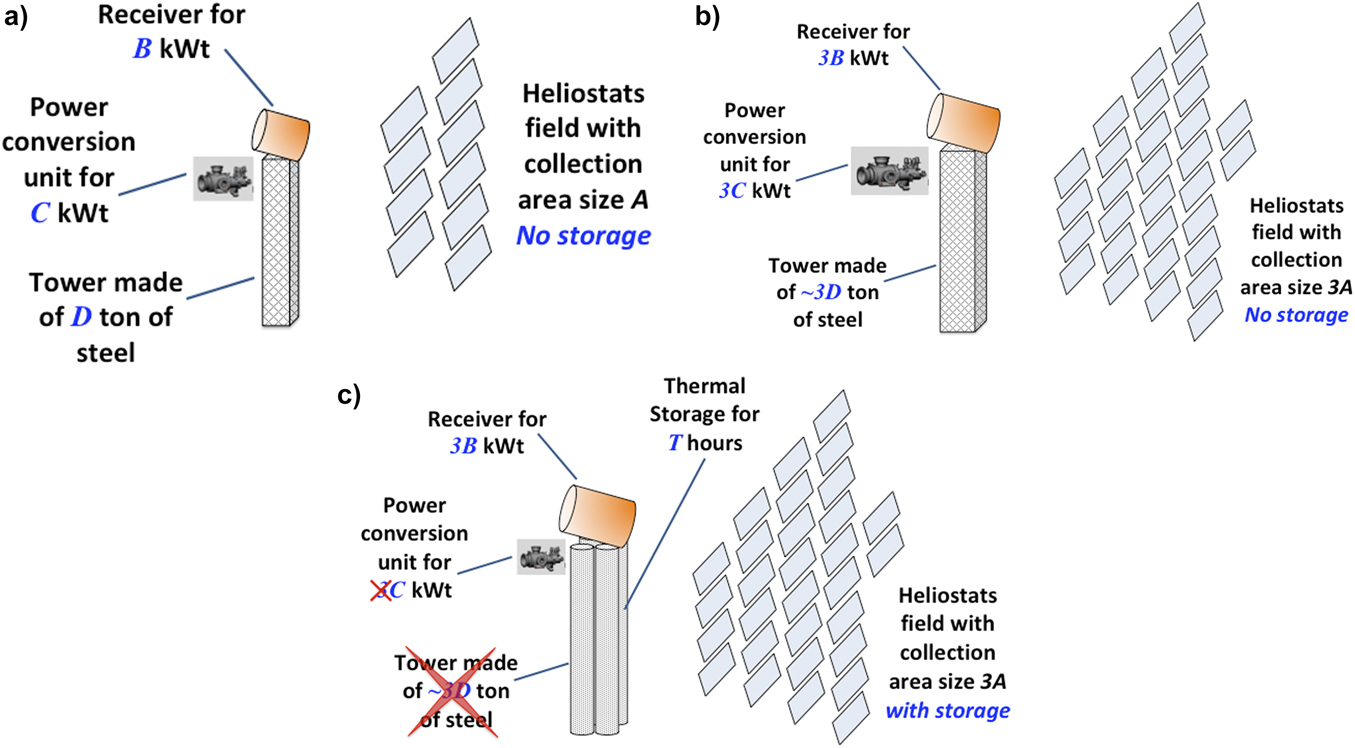
The first two design requirements—self-sufficiency and energy supply around the clock—imply that the system must include storage. Therefore, the two general configurations shown in Fig. 1 could be viable options. Option 1(a) is used when battery storage is used,Reference Li, Yang, Shaohua and Haoshen108,Reference May, Davidson and Monahov109 whereas the storage in option 1(b) may be pumped storage hydro power (PSH),Reference Rehman, Al-Hadhrami and Alam110,Reference Slocum, Haji, Trimble, Ferrara and Ghaemsaidi111 compressed air energy storage (CAES),Reference Wang, Lu, Ma, Wang, Dooner, Miao, Li and Wang112 or thermal-energy storage.Reference Bauer, Steinmann, Laing, Tamme, Chen, Prasad and Jaduria113,Reference Sarbu and Sebarchievici114 Since a very large-scale solution is required, these appear to be the only viable storage options.76,Reference Karni, Kribus, Ostraich and Kochavi77,Reference Rehman, Al-Hadhrami and Alam110 Whereas batteries can be used in most locations, PSH feasibility is related to terrain, CAES is best in certain geological conditions and thermal storage is less feasible with PV than it is in systems having a heat engine.Reference Ibrahim, Ilinca and Perron81,Reference Guney and Tepe82,Reference Slocum, Haji, Trimble, Ferrara and Ghaemsaidi111,Reference Wang, Lu, Ma, Wang, Dooner, Miao, Li and Wang112,Reference Luo, Wang, Dooner and Clarke115 Nevertheless, each one of these storage options might have advantages in some conditions and all of them should be considered. In this example we assume battery storage, but since replacing it with any of the above options should not impose adjustments of other system components, the calculations would not be affected by this change, as long as the storage component efficiency, CapEx and O&M costs are the same. Figures 7(a)–7(c) schematically demonstrate the general characteristics of PV systems without and with energy storage.
(a) A PV plant without storage, generating power in proportion to the size A of its collection area and the solar irradiation input. (b) A PV plant without storage, generating power in proportion to the size 3A of its collection area and the solar irradiation input. (c) A PV plant with storage and collection area 3A, generating the same amount of energy as the system shown in Fig. 7(b), but supplies it per customer demand.

We assume that all the systems shown in these figures are installed in the same general location, by the same contractor, and have the same power supply agreement, enabling them to sell all the electricity they produce. Hence, there are no site specific, or other factors creating preference for one of the systems. Figure 7(a) schematically shows a PV plant without storage, generating power in proportion to the size of its collection area A and the solar radiation input. Figure 7(b) shows a similar plant, with a collection area of 3A and therefore at any given time it produces 3 times the power produced by the first plant. Since the plant’s size and cost increase in direct proportion to the overall energy production, the LEC of the systems shown in Figs. 7(a) and 7(b) should be more or less the same. Indeed, size generally does not have a strong influence on the LEC of PV plants. This is especially true in the case considered here, of a much larger system than that where the quantities of panels and inverters affect their respective price.
The plant shown in Fig. 7(c) has a collection area of 3A and storage. It produces the same amount of energy as the system shown in Fig. 7(b), and supplies it 24/7, per customer demand, regardless of the instantaneous irradiation. But the LEC of the plant in Fig. 7(c) is higher than those of the plants in Figs. 7(a) and 7(b) because it contains an additional component—the storage—without a proportional addition of production. This would also be the case if any of the other storage options discussed above were used. It is clear that when all other parameters are unchanged, the addition of energy storage to a PV system would always increase the LEC of that system. Let’s now see by how much:
Summary of the LEC calculations of the PV system is provided in Table 6, in Appendix 1. Three scenarios are considered:
(i) No storage.
(ii) 1-h storage buffer, as would usually be required for a PV installation of several MWe or larger, to flatten short-term power fluctuations.
(iii) 40-h storage. This size should satisfy the design requirement of 24/7, year-round operation. 40-h storage is roughly enough to keep the system running at full capacity through one day with no solar irradiation.
First the LEC of a PV plant without storage is estimated. The system and components’ data used in the calculations are based on quotes from several suppliers. We assume the GHI = 2100 kWh/m2/year, ξ = 1 and favorable financial conditions, which could be expected in a large-scale facility.
The resulting LEC estimate is ∼$28/MWhe, which is a very low LEC. Among all the presently used power-generation methods, only large-scale (>200 MWe) Combined Cycle of gas and steam turbines can have a lower LEC, if the cost of the natural gas is < $3/MMBtu ($10.24/MWh) and the plant’s CF is ∼80% or higher.
In the scenarios that include storage, we assume battery storage at a cost of $100/kWhe, an equal lifetime to that of the plant (30 years, or ∼11,000 charging cycles), with negligible performance degradation and handling costs (e.g., for battery materials recycling). Consequently, the annual O&M is only 3% of the total system CapEx. These cost and performance assumptions are considerably better than those of any present battery, but might be achievable within the next 7–10 yearsReference Kittner, Lill and Kammen116,Reference Chen, Li, Pei, Li, Liao, Wang, Wan, Liang, Chen, Zhang, Wang and Cui117
When 1-h storage is added, the estimated LEC is ∼$31/MWhe (Table 6 in Appendix 1); this is about 8% increase over the LEC of a PV system without storage. This case is discussed further in Section V.3.
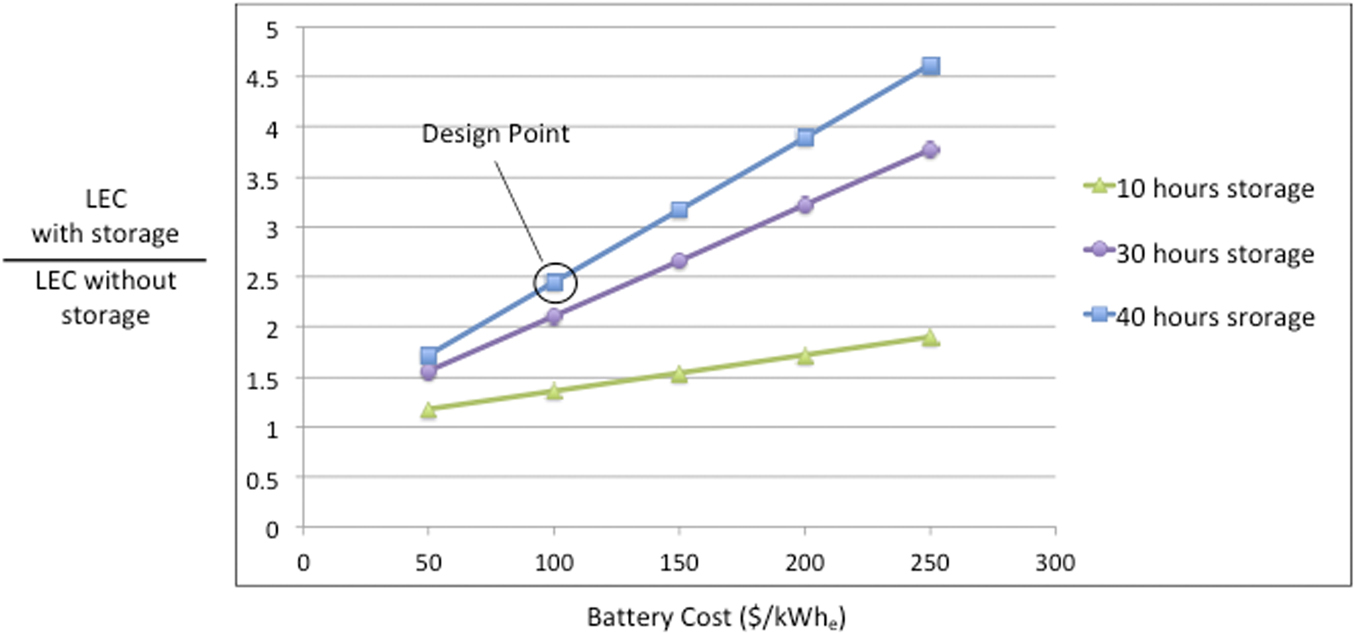
Adding the 40-h storage increases the system’s LEC by a factor of nearly 2.5, relative to the no-storage option, to ∼$69/MWhe. Figure 8 shows how the LEC increases due to the addition of storage at various cost and storage time. Using any other storage option with the same cost and performance would produce the same system LEC.
The ratio between the LEC of a PV system with and without storage, at different battery cost and storage time. Without storage the LEC is ∼$28/MWhe.

PV systems designed for large-scale, self-sufficiency, 24/7 year-round operation have two other significant drawbacks:
(i) Batteries, or the other storage options mentioned above, could be used for alleviating or eliminating dispatchability problems caused by hourly and daily fluctuation of solar irradiance. But they cannot provide an economically viable solution for seasonal variations of daily solar energy input, which grow as the latitude increases. Most of the world’s locations with good solar conditions are in regions where the daily solar energy input in the summer is at least 50% more than that in the winter. This is due to longer daylight hours and more favorable sun inclination angle during the summer. Hence, if the system were designed to supply the required daily energy based on the irradiation conditions of the summer, in most locations it would not be able to generate enough energy during the winter. If it were designed based on the irradiation conditions of the winter, it would have too much energy in the summer, much more than could practically be stored with any of the storage options available for PV systems. If it were designed for the spring or autumn, it could have both problems. Indeed, the issue of seasonal variability of solar energy supply leads large-scale, self-sufficient PV systems to a fundamental supply and demand versus capital cost paradox.
(ii) Periods of two or more days with little or no solar irradiation can be expected, perhaps several times a year, even in regions with good solar conditions. Present PV systems have no cost-effective, self-sufficient solution for power generation during such periods. The two presently available options are, (i) increasing the energy storage size to enable power supply for 2–3 days (i.e., 64–88 h), or (ii) installing a backup of a fuel-driven, standalone PCU, with the same power generation capacity as that of the PV system. Neither one of these solutions can be implemented at a reasonable capital cost.
In summary, there are three main obstacles preventing PV systems from meeting the fundamental design requirements of this particularly important case:
(i) Significant cost increase when adding sufficiently large storage.
(ii) Elusive cost-effective solution for seasonal variations of the daily solar radiation input.
(iii) Elusive cost-effective self-sufficient solution for energy supply during a few consecutive days with little or no sun.
Research and development of these topics are therefore of great importance. Regarding (i), there is an extensive R&D effort to improve batteries and lower their cost.Reference Kittner, Lill and Kammen116–Reference Davis118 Some effort should also be directed at finding methods that may enable cost reductions in other system components when storage is added. There are also studies of fuel production, via photocatalysis, electrolysis and other photoelectrochemical processes, which could be integrated with PV, and might be able to solve (ii).Reference Liu, Colón, Ziesack, Silver and Nocera119–Reference Patra, Bhuskute and Gopinath123 While all of these studies should be encouraged, it is very important that the ability of each one of them to provide solutions to the above obstacles and its potential influence on the system LEC are evaluated as the study progresses.
V.2 System configuration 2—SCR
Schematics of the relevant SCR configurations are shown in Figs. 4 and 5(c). The two examples provided in the discussion of “Limits on operating conditions” (Part c of Section IV.2.2) are helpful in choosing the best SCR configuration. Minimizing the outcome of Eq. (6) based on the data corresponding to Table 4 and Figure 6, leads to the conclusion that a small SCR with design input of no more than about 10 MWt and a sCO2 PCU generating ≥ 1 MWe should yield the lowest LEC. In this case large-scale plants are made of many relatively small modules. Figures 9(a)–9(c) schematically demonstrate the general characteristics of combining thermal energy storage (TES) in such SCR module.
(a) SCR plant without storage, generating power in proportion to the size A of its collection area and the solar irradiation input. (b) SCR plant without storage, generating power in proportion to the size 3A of its collection area and the solar irradiation input. (c) SCR plant with storage and collection area 3A, generating the same amount of energy as the system shown in Fig. 9(b), but supplies it per customer demand.

Similar to Figs. 7(a)–7(c), we assume that all the systems shown in Figs. 9(a)–9(c) are installed and operated under the same conditions, so there are no site-specific, or other bias factors. Figure 9(a) schematically shows a small SCR module without storage, generating power in proportion to the size of its collection area A and the solar irradiation input. Figure 9(b) shows a similar module, with a collection area of 3A. The size of this module should still be small enough (no more than roughly 10 MWt) so the annual-average optical efficiency remains close to that of the module in Fig. 9(a). In addition to the collection area, the size of all the other main components of the module—the receiver, PCU and tower—also increase by a factor of 3. In general, the increase of collection area could lead to a somewhat lower optical efficiency, while the size increase of the other major components may reduce their specific costs. Assuming these factors more or less cancel each other, so the module’s size and cost roughly increase in proportion to the overall energy production, the LEC of the systems shown in Figs. 9(a) and 9(b) should be nearly the same.
The module shown in Fig. 9(c) has the same collection area (3A) as that in Fig. 9(b), and TES. It produces the same amount of energy as the system shown in Fig. 9(b) and supplies it 24/7, per customer demand, regardless of the instantaneous irradiation. Having storage adds to the system’s cost. But in this case the thermal storage is arranged in tubular vessels that replace the tower, so the tower’s cost is reduced and the length of the pipes transmitting the high temperature working fluid from the receiver to the storage is minimized. Also, the PCU is smaller than that in Fig. 9(b) because the system is designed to produce energy 24/7, meaning the storage is charged during the sunlight hours (say 8 full hours a day), whereas the same energy is discharged to the PCU over the entire day (24 h). Hence, the PCU size can be roughly the same as that in Fig. 9(a), or 1/3 of that in Fig. 9(b). According to the available cost data, packed-bed thermal energy storage (PB TES) is relatively cheap (<20 $/kWht).Reference Allen, von Backström, Joubert, Gauché, Rajpaul and Richter124–126 Consequently, the cost saving due to the elimination of the tower and having a smaller PCU more than compensates for the added cost of the storage, assuming a storage time of 40 h. This is reflected in the LEC estimates.
Example of the SCR calculations is shown in Table 6 of Appendix 1. We start with LEC estimates of the SCR module without storage, relying on quotes from several suppliers. DNI = 2000 kWh/m2/year, ξ = 1 and financial conditions which could be expected in a large-scale facility are assumed. Note that this DNI would typically be expected where the GHI = 2100 kWh/m2/year, which is the assumption used in Section V.1 for the PV system.
The resulting LEC estimate for the SCR module without storage is ∼$61/MWhe. This is a relatively low LEC, compared to present SCR systems.Reference Chase127,Reference Dieckmann, Dersch, Giuliano, Puppe, Lüpfert, Hennecke, Pitz-Paal, Taylor, Ralon, Al Obaidli, Calvet and Richter128 As was done with the PV system example, a 40-h storage is now added to the system. Making the appropriate adjustments, including those discussed above in relation to Figs. 9(a)–9(c), the LEC is reduced to ∼$49/MWhe (Table 6 in Appendix 1). As can be seen, using the SCR configuration proposed here, the addition of storage actually leads to a ∼20% reduction of the LEC, due to the lower costs of the tower and reduced PCU cost. The LEC of this SCR (with 40-h storage) is ∼72% higher than the LEC we estimated for PV without storage, ∼59% higher than the LEC of PV with 1-h storage, and ∼30% lower than the LEC of PV with 40-h storage. As shown in Fig. 8, it is similar to that of PV with a 40-h storage, at a cost of $50/kWhe.
Fuel combustion backup to assure the system’s working fluid is heated even when there is little or no solar irradiation over a few days is simple and low cost with this, as well as other SCR configurations. But is there a good way to handle the seasonal variations of the daily solar radiation input?
Configuration (d) in Fig. 5 is a simple schematic of the solution proposed here. The system is designed for 24/7 generation of the required electrical energy during the shortest days of the year, when the daily solar energy input is lowest. As the season changes and the daily input increases, the system can generate more electricity and/or heat. At times when the need for electricity increases, more of it is sold per the demand variations, while all the surplus of heat and electricity is converted to fuel or other useful chemicals. Converting and storing the energy, which is not required for electricity generation, into a long-term storage in the form of chemical potential is used to manage the seasonal variation of available solar radiation, and assure that the ξ ratio [Eq. (2a)] approaches 1.
In the present example it is assumed that the surplus heat and electricity are used to produce syngas (a mixture of CO and H2) and O2 from CO2 and water, by means of high temperature electrolysis; the syngas is then converted to methanol. This method is presently under development.Reference Alioshin, Kohn, Rothschild and Karni129–Reference Zhang, Song, Wang and Bao131
The estimated LEC of electricity production using this system is $51/MWhe (See Table 6 in Appendix 1).
The Estimated Levelized Fuel Cost (LFC) of the syngas is $316/ton, and if methanol is produced from the syngas, its estimated LFC is $386/ton ($1.69/kJ). These LFC estimates include CO2 cost of $30/ton and CO2 avoidance value of $7.5/ton (See Appendix 1). The technology of Direct Air Capture (DAC) of CO2 is progressing and present cost estimate of a precommercial DAC plant is about $100/ton of captured CO2, going down from ≥ $550/ton in 2011.Reference Keith, Holmes, Angelo and Heidel132 Target commercial cost is about $50/ton, which includes substantial heating costs (e.g., using natural gas) at a relatively low temperature (≤300 °C).Reference Keith, Holmes, Angelo and Heidel132,Reference Siegel133 The SCR system has residual heat at this temperature range that can be supplied to the DAC system at a very low cost, so the overall cost of carbon capture could be reduced. The CO2 avoidance value of $7.5/ton is a conservative estimate based on present carbon pricing.134,135
In summary, the proposed SCR configuration could meet the system objectives and comply with all the fundamental design requirements listed at the top of Section V, including solutions to the three main obstacles, noted at the end of Section V.1. It provides:
(i) Lowest LEC attained when adding sufficiently large storage;
(ii) A cost-effective solution for seasonal variations of the daily solar radiation input;
(iii) Simple cost-effective solution for energy supply during a few consecutive days with little or no sun.
In addition, the production of fuel, especially in liquid phase (e.g., methanol) creates another option for long distance energy transportation, besides electrical power lines.
Actually, the particular SCR system discussed in this section has been developed following a detailed analysis based on the approach described in this article; the system is dubbed SolPeD (short for Solar Per Demand). Significant R&D effort is still required to advance this system, mostly by improving performance and reducing costs of the major components—receiver, thermal storage, sCO2 PCU, chemical reactor and CO2 extraction from the atmosphere.
V.3 System configuration 3—combination of PV and SCR
The LEC of PV without storage, or with limited storage hours (up to ∼10 h), is lower than that of any other solar system. It therefore makes sense to try to integrate as much PV as possible into the large-scale solar system whose electricity dispatchability is assured by a system made of many small SCR modules, as described in Section V.2 and shown schematically in Fig. 9(c). A key issue is to assure that the ξ ratio is kept as close as possible to 1.
Figure 10 illustrates how PV and SCR could be combined in a very large-scale energy providing system. The figure displays a fairly typical power demand curve of a very large, self-sufficient system.136–Reference Gaur, Rathour, Agarwal, Baba and Soonee138 The values in this curve, as well as all the other power values in the figure are normalized by a factor, which makes the minimum power demand = 1. To assure electricity supply at all time, the designed power generation capacity of the SCR system must always be larger than the demand; surplus energy is then used for fuel production, so ξ approaches 1. Relatively cheap electricity from PV is generated whenever it is available, enabling the SCR to reduce its electricity generation and increase its fuel production.
Normalized power generation capacity and demand illustrating how the combination of PV and SCR could be used in very large self-sufficient energy systems.

In the example shown in Fig. 10, PV supplies about 33% of the total electricity demand. Since this is a significant share, the “no-storage” option would require a short-term “buffer” storage (for about 1 h) to eliminate power supply fluctuations. In this case the LEC is estimated at ∼$31/MWhe (Table 6 in Appendix 1). As also shown in the figure, the addition of 5-h battery storage at $100/kWhe, which would add ∼27% to the LEC, could support power supply during peak demand. Hence, assuming the previous LEC calculation’s assumptions are valid (see Sections V.1 and V.2), if PV is used as shown in this example, then ∼1/3rd of the electricity could be supplied at LEC of $28–36/MWhe (depending on storage size) instead of $51/MWhe, if all the energy were supplied by the SCR. Assuming a 1-h storage for the PV system (LEC ∼$31/MWhe), the weighted average LEC of the SCR and PV would be about $44/MWhe.
Obviously, the actual ratio of PV to total generation would vary daily, and its annual-average value would depend on fuel demand, energy transportation capabilities, seasonal solar input, demand variations, etc. Nevertheless, this approach could yield a substantial energy cost reduction. It could be especially interesting in a climate where the solar irradiation is sufficiently high ∼9 months of the year, and utterly insufficient during a ∼3-months monsoon season; much of India has these conditions. In this climate, the enhanced fuel production enabled by the combination of PV and SCR can provide enough clean fuel—made of CO2 and water at a relatively low cost—to be combusted and provide electrical energy during the monsoon period.
VI. Use of the method in a wide range of applications
The system selection method described in this article is not limited to solar systems. It can be used for selecting system configurations in many complex and challenging energy conversion applications. A short description of two such systems, where the method could be applied, is given below.
VI.1 Hybrid approach
In high latitudes (e.g., >45°), typically when seasonally there is less sunlight, winds tend to be stronger139 and thus a cost-effective approach to a steady renewable energy supply could be a combination of wind and solar energy. Many regions that may have a good solar resource, however, may not have good Class 4 wind, but this could be alleviated some with next generation tall tower turbines. For example, with 80-m hub height limit, the state of Maine, United States, has about 6 GW of wind energy potential. At 140 m it has about 60 GW of wind energy. Identification of these sorts of opportunities can be a strong catalyst for innovation. In the case of tall towers, for example, this led to creation of a new system for in situ monolithic very large diameter and tall steel towers.Reference Smith and Slocum140 Using our method, it would be possible to determine the optimum combination of wind and solar, at a given location, so renewable energy supply matches the demand, at a minimum LEC.
VI.2 Symbiotic systems
Beyond just searching for better solutions of a particular type, substantial increases in cost effectiveness may be achieved through symbiotic approaches such as combining harvesting of food and minerals along with energy.Reference Slocum141
For example, solar power systems take up large areas of land and require water for periodic cleaning. Added value can be obtained by growing high value crops that do better in the shade in the solar collection field, such as coffee and many types of vegetables. Offshore wind energy structures can also be used to support systems to harvest mineralsReference Haji, Delmy, Gonzalez, Slocum, Chung, Muskulus, Kokkinis and Wang142 or aquaculture.Reference Buck, Krause and Rosenthal143
Defining the LEC of agriculture or mineral products in term of $/ton and employing the approach described in section III.4 and Eq. (1g) for cogeneration of two or more products, the proposed generalized method could be used to optimize the symbiotic systems described above.
VII. Conclusions and implications
We propose a systematic, objective approach for selecting the most suitable solar energy system in a large and diverse range of applications. The main parts of the approach are as follows:
(1) Defining the project objectives and fundamental system design requirements;
(2) Establishing an objective method for determining and comparing energy costs;
(3) Following a well-defined methodology for obtaining a configuration that meets the system objectives and complies with all the design requirements, at a minimum energy cost.
These parts are divided into more steps and presented in detail. The guidelines of the method’s implementation are discussed with emphasis on meeting the project objective and design requirements, and a correct definition of the main comparison metric, the LEC, which factors in the ratio between energy sold and energy production capacity, and includes SIF considerations.
The inclusion of a SIF, which is proposed here, is of great importance, especially if seemingly disparate viewpoints are to be reconciled. It should be applied to the cost of capital, operations and maintenance and fuel (if fuel is used in significant quantity), for both short- and long-term effects. For example, it may make more sense for a utility in the short-term to just build another fossil fuel plant, but society may value a renewable energy plant in a suitable location, and be willing to offer financial assistance. Inclusion of the SIF into the calculation of a plant’s LEC should facilitate rational evaluation of appropriate assistance to be provided on a case-by-case basis.
The solution approach is explained with the aid of some learned lessons from past experience and observations. Finally, the use of the methodology for obtaining the most suitable configuration is demonstrated for the case of a system whose objective is “providing extensive supply of renewable energy, aiming to gradually replace most or all of the fossil fuel combustion in a vast, highly populated region”.
It is shown that the process can serve dual purposes, (i) finding the most suitable solar energy system configuration for a specific objective and (ii) pointing out vital research and development objectives, necessary for meeting the system’s objectives, complying with the design requirement, improving performance and reducing costs. Moreover, the suggested method can also be used for selecting an optimal system configuration in many complex and challenging energy conversion applications, such as hybrid or symbiotic systems.
An important implication of this article is that in each of the scenarios presented above or encountered in the future, it should be remembered that once a reason is deterministically established for why something is too expensive or unrealistic for other reasons, then that should also be considered as a catalyst to innovate and lower system cost for long term potential advancement and gain.
Nomenclature

Acknowledgments
The vision of the late Prof. Israel Dostrovsky, who foresaw the evolution of the world’s energy industry, pointed out the direction that led to this work. We thank Prof. David Cahen for suggesting and encouraging us to write this article.
Appendix 1: Algorithm, flow chart and calculation example for selecting a suitable energy system
Algorithm
1. Define objectives (including short- and long-term, corporate and societal)
2. Define fundamental system design requirements
3. Assemble data related to the specific project
4. Determine the valid comparison expressions of:
(a) objectives and design requirements
(b) specific project parameters (including “qualitative” factors such as SIF, legal, health, environmental and safety requirements)
5. list all applicable technologies and configuration alternatives
6. evaluate and compare the alternatives based on the outcome of expressions derived in 4(a) and 4(b) and select 2 or more leading options
7. determine the valid comparison expression(s) of LEC for the leading options
8. make initial designs of 2 or more possible system layouts of each of the leading options
9. assemble initial component related data of each option
10. identify obstacles (showstoppers)
11. estimate and compare the cost and time-span ramifications of the obstacles on the respective options
12. reevaluate the fulfillment of (a) objectives and design requirements, (b) specific project parameters of the respective options
13. compare specific cost estimates of the options based on the “LEC indicator” equations [Eq. (5) and, when relevant, also Eq. (6)]
14. select 1–2 system layout(s) of each of the leading options based on the results of Steps 11–13
15. assemble detailed component-related data of each of the selected system options
16. calculate the LEC of the selected system layouts
17. compare and analyze the calculation results
18. modify the system layouts selected in Step 8
19. repeat Steps 9–18 until no further improvement can be made
20. choose the preferred system layout based on the lowest LEC and the final evaluation of the expressions derived in 4(a) and 4(b) [Step 12].
Flow chart of the algorithm for system selection.

Example of calculations using the algorithm.

Summary of the cost calculations corresponding to the algorithm in Table 5.