

Introduction
The human thymus is especially sensitive to environmental influences including nutrition, infections and the presence or absence of breastfeeding.Reference Prentice1–Reference Hasselbalch, Engelmann, Ersboll, Jeppesen and Fleischer-Michaelsen3 We have previously shown that the ultrasonically measured body size-adjusted thymic size of infants shows a marked and reproducible variation with seasons in both The GambiaReference Collinson, Moore, Cole and Prentice4 and Bangladesh.Reference Moore, Prentice and Wagatsuma5 Such variation is detectable very soon after birth, suggesting an influence of prenatal factors. Evidence that these early measures of thymic size correlate with function is provided by the observations that: (a) numbers of circulating T cells identified as recent thymic emigrants by the analysis of signal joint T-cell receptor rearrangement excision circles show similar seasonal variationReference Ngom, Collinson and Pido-Lopez6; and (b) thymic size measured in early infancy predicts survival to 1 year of age.Reference Aaby, Marx and Trautner7 We have speculated that seasonally mediated developmental deficits in thymic growth and architecture may explain the observation that season of birth strongly predicts later mortality from infectious diseases in young Gambian adults.Reference Moore, Cole and Poskitt8, Reference Moore, Cole and Collinson9 The association between being small-for-gestational age and impaired vaccine responses observed in Philippino adolescentsReference McDade, Beck, Kuzawa and Adair10 and Pakistani adultsReference Moore, Jalil and Ashraf11 suggests that nutritional restriction of fetal growth may lie on the causal pathway.
The vast majority of the differentiating cell cycles in human development occur before birth.Reference Barker12 Studies of teratogenic effects demonstrate that each organ has a discrete window of sensitivity that correlates with the tempo of cell differentiation.Reference Wilson13 In humans, the thymus first emerges at week 5 of gestation and thymic epithelial cells start secreting hormones by 5–6 weeks.Reference Palmer14 Weeks 7–14 represent the critical period for thymic development.Reference Palmer14
These inferences are derived from anatomical/pathological studies of fetal autopsies and from retrospective studies of accidental exposures to teratogens. Identifying whether, and if so, when, thymic growth and development are sensitive to maternal nutrition would inform the development of possible dietary interventions aimed at optimizing later immune function. In the current study, we used serial fetal ultrasound in poor Bangladeshi women to identify metrics of fetal growth retardation at 14, 19 and 30 weeks of gestation and correlated these with postnatal ultrasound measures of the infant thymic size at birth, 2, 6 and 12 months.
As the exact allosteric relationship between TI and infant size is unknown, it was necessary to fit the relationship empirically. As a consequence, size alone could not serve as an indicator of fetal growth. Instead, our strategy was to explore fetal growth measurements using principle component analysis to seek more subtle patterns of fetal growth predictive of TI controlled for infant size, age and season of measurement. Gratifyingly, the pattern so uncovered turned out to have a simple and rational biological interpretation.
Methods
Subjects
The study was embedded within the Maternal and Infant Nutrition Interventions, Matlab (MINIMat) study (controlled-trials.com identifier: IRCTN16581394), a multi-arm, prenatal, food and multiple micronutrient intervention trial with birth weight as the primary endpoint.Reference Moore, Prentice and Wagatsuma5, Reference Persson, Arifeen and Ekström15 The interventions had no significant impact on birth weight, but early food supplementation combined with multiple micronutrients had a substantial impact on child survival.Reference Persson, Arifeen and Ekström15 Analysis of intervention group was not the major focus of the current study. The 3267 pregnant women included in this analysis were recruited from the Matlab area of rural Bangladesh between November 2001 and October 2003, using active surveillance of women at risk of pregnancy. We included women in the analysis if they had a fetal ultrasound measurement at ∼8 weeks to determine gestational age (GA) and at least one other fetal ultrasound examination during pregnancy, delivered a singleton baby and their infant had at least one postnatal ultrasound determination of TI. Among these, 1637, 1739 and 2073 women had complete ultrasound data at 14, 19 and 30 weeks, respectively. We only took thymus measurement at birth in sub-centre clinics and only on infants who were delivered at these sub-centres.
Each mother was assigned to a socio-economic status (SES) quintile based on an asset questionnaire as described by Saha et al. Reference Saha, Frongillo and Alam16
Calculating GA
We based GA estimates on the ultrasound measurements at ∼8 weeks of gestation using the method recommended by World Health Organization (WHO)17–Reference Joshi19: we based our estimates on crown-rump length (CRL) except for those 10.5% larger fetuses (all in the 12th or 13th week of pregnancy) for whom the CRL could not be measured in a single frame, when we used biparietal diameter (BPD).
Ultrasound fetal biometry
The study used four portable ultrasound machines (SSA 320A Justavision-200, Toshiba, Tokyo, Japan with 3.5 MHz standard convex probe) together with ultrasound thermal printers, one machine in each of four sub-centre clinics, located throughout the Matlab region. We measured BPD, occipito–frontal diameter (OFD), head circumference (HC), femur length (FL), abdominal circumference (AC) and tibia length (TL) at ∼14, 19 and 30 weeks of gestation. We made triplicate measurements of each dimension and used the averages of these in the analysis. The majority of the current analysis was restricted to measurements made after December 2002, as we did not measure TL before that date.
A highly qualified local ultrasound consultant trained nine sonographers (paramedics) and one supervisor (medical doctor). Before beginning field data collection, the team underwent a standardization exercise to document measurement quality to ensure that for all measurements over a broad range of GAs, inter- and intra-observer variability were within the range reported in the published literature for trained medical personnel.Reference Neufeld, Wagatsuma, Hussain, Begum and Frongillo20 To document ongoing quality control, a doctor, who did not have access to the regular results and who did not notify the ultrasonographer who had made them, re-examined 3% of all assessments.
We invited each woman to the sub-centre 1 week before she completed the scheduled numbers of weeks of gestation, on the basis of the first trimester ultrasound GA. If she was not able to attend, we asked her to attend either the week before or the week after or, failing that, to visit the clinic at a convenient time before the next scheduled time. In this manner, while providing maximum opportunity for each woman to attend for her examination, the study provided the repeated longitudinal measurement data with three points per women spreading throughout the gestation weeks.
Fetal dimension z-scores
We used the formulae of Altman and colleaguesReference Altman and Chitty21–Reference Chitty and Altman25 to derive z-scores from our fetal biometry and ultrasound-fixed GAs. The reference populations for these were attendees at antenatal clinics in a London hospital. The formulae are not sex specific. To eliminate any bias associated with the age at which GA was determined, we used an adjusted z-score when analysing the association between fetal dimensions and TI. This was calculated by subtracting from the raw z-score the fitted values obtained by the regression of the raw z-score on a cubic polynomial of the estimated age at which the GA was determined.
Ultrasound measurements yielded a total of 18 variables for each fetus. We used principal component analysis to reduce this to a more manageable number. This analysis, in simplistic terms, distils the information from a large set of variables and represents it as a series of independent variables (the principal components) in the descending order of importance. In this case, we considered only the first two principal components (PC1 and PC2) from the six z-scores derived from measurements at each time point.
Principal components are linear combinations of the original variables, that is, they are calculated by multiplying each variable by its own judiciously chosen coefficient and summing the products. It is sometimes possible to obtain some hint as to what the main components represent by examining the patterns of these coefficients. In this case, the patterns for PC2 suggested that difference between the head and leg dimensions was an important feature of the data. Therefore, we introduced a further related but more readily derived statistic, leg–head difference (LHD) calculated by subtracting the mean z-score for the head measurements (HC, BPD and OFD) from the mean z-score of the leg measurements (TL and FL). LHD14, LHD19 and LHD30 refer to statistics calculated separately for each time point; LHDall calculated the mean leg and head z-scores over all measurements and time points.
Thymus ultrasound
The same sonographers measured thymus size using the same machine as the fetal sonography, but with a PVF-745 V 5.0–7.0 MHz probe (Toshiba Medical Systems, Boundary Court, Gatwick Rd, Crawley, UK). We calculated TI from the mean of three measurements of both the transverse diameter and the saggital plane of the largest lobe using the formula published by Hasselbalch et al.Reference Hasselbalch, Nielsen, Jeppsen, Pedersen and Karkov26
We assessed TI at four time points during infancy, within 24 h of birth (health centre deliveries only) and at 2, 6 and 12 months of age. We scanned the thymus using the trans-sternal approach whilst the infant was lying in the supine position and not crying.
Each infant's weight and length was measured at each postnatal ultrasound time point. These were converted to WHO-referenced z-scores.
Regression models
We assessed the ability of the various fetal measurements and growth scores to predict TI using multiple regression of log(TI), always controlling for infant size (weight and length), age and sex and covariates capturing seasonality. We modelled seasonality using truncated Fourier series,Reference Fulford, Rayco-Solon and Prentice27 that is a Fourier series omitting terms higher than a certain frequency and fitting the Fourier coefficients for the remaining terms as parameters in the linear model. Only the first two pairs of terms were found to be useful (i.e. statistically significant). We applied random effects regression (generalized least squares)Reference Liang and Zeger28 whenever it was necessary to allow for intra-individual correlation, for example, when analysing all postnatal time points simultaneously. As seasonality of TI at birth was known to differ markedly from that at later time points,Reference Moore, Prentice and Wagatsuma5 separate seasonal patterns were retained for birth measurements when all postnatal time points were analysed simultaneously.
We used the correlations between the z-scores of replicate measurements of fetal dimensions to calculate the reliability of the z-scores (and hence of their replicate means) at each time point. At each time point, we also calculated the correlations between the z-scores of all pairs of dimensions.
Analysis strategy
(1) Describe the distribution of fetal and infant anthropometry z-scores in the sample.
(2) Explore the principle components of the fetal z-scores and their physical interpretation.
(3) Investigate predictors of fetal proportions: Do season, sex and SES or intervention predict either of the first two principle components (i.e. fetal size or LHD)?
(4) Multilevel regression analysis of the relationship between TI (all time points analysed simultaneously) and fetal biometry at different time points measured as: (i) z-scores of individual dimensions, (ii) principle components and (iii) LHD. How do these relationships vary with the time points at which the fetal and infant ultrasound measurements were made?
(5) Examination of the correlations between z-scores of fetal biometry (both between measurements of different dimensions and replicate measurements of the same dimension) to determine whether the weaker correlation with TI seen as pregnancy progresses might be explained by poorer measurement precision at the later time points.
All the statistical data were computed using Stata (version 11, http://www.stata.com/).
Results
The number of pregnant women for whom GA was estimated by ultrasound at ∼8 weeks was 3267. Among these, 1706, 1814 and 2187 women had complete fetal ultrasound biometry at the 14-, 19- and 30-week gestation time points, respectively, and 1594 women had complete data at all three time points. (The great majority of the data losses here occurred because TL was not recorded earlier in the study.) Among those with complete fetal biometry at all antenatal time points, 1048, 1293, 1016 and 888 had TI estimates at birth, 2, 6 and 12 months of age, respectively. At enrolment, mothers’ ages ranged from 14 to 50 years (mean 26.5 years and s.d. 5.9 years); their mean weight was 45.3 kg (s.d. 6.9 kg), mean height 149.8 cm (s.d. 5.3 cm) and mean BMI 20.2 kg/m2 (s.d. 2.7 kg/m2).
Z-score descriptive statistics
Figure 1 plots mean unadjusted z-scores for fetal ultrasound biometry against GA and Fig. 2 plots mean anthropometry z-scores against infant age. Although clearly the infants were small relative to the WHO standards, their fetal dimensions even at 30 weeks of gestation appear, if anything, to have been slightly larger than the UK reference population.
Mean fetal ultrasound z-scores of each dimension at each time point.  , week 14;
 , week 19;
 , week 30. Error bars show 95% confidence intervals. These scores were not adjusted the gestational age at which dating was determined. HC = head circumference; BPD = bi-parietal diameter; OFD = occipito-frontal diameter; FL = fibia length; TL = tibia length; AC = abdominal circumference.

Mean infant anthropometry z-scores at each postnatal time point.  , birth;
 , 2mo;
 , 6mo;
 , 12mo. Error bars show 95% confidence intervals. WAZ = weight-for-age Z-score; HAZ = height-for-age Z-score.
Exploring principal components
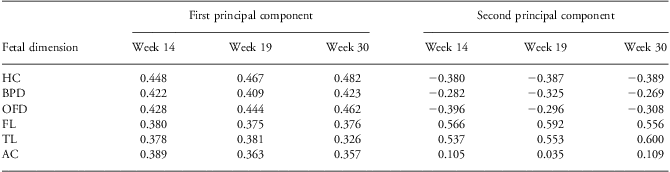
Table 1 shows the coefficients by which each variable was multiplied in the calculation of the first two principal components (i.e. the eigenvectors) of the fetal biometry z-scores. Consistent patterns for both principal components (PC1 and PC2) were apparent across all three time points. Each dimension contributed positively and approximately equally to PC1, indicating that it was measuring the overall size of the fetus. For PC2, the coefficients for leg and head measurements have opposite signs, whereas the AC was relatively unimportant. This suggests that the relative size of head to legs is an important feature of fetal growth. Indeed, the PC2 was, to a close approximation, proportional to the difference between the means of the z-scores for leg and head dimensions: this difference (LHD) correlated with PC2 with an R 2 of 98%, 99% and 96% at the 14-, 19- and 30-week time points, respectively.
Principal component coefficients for fetal ultrasound biometry
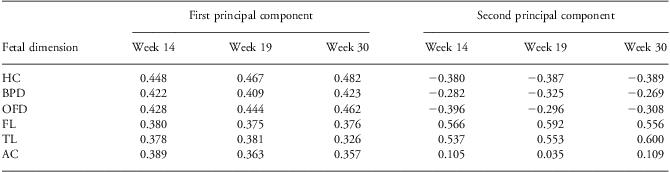
HC, head circumference; BPD, biparietal diameter; OFD, occipito–frontal diameter; FL, femur length; TL, tibia length; AC, abdominal circumference.
For each individual PC1 = ∑j c 1j.zj and PC2 = ∑j c 2j.zj, where zj = z-score for the jth fetal dimension and c 1j and c 2j are the principal component coefficients for the jth fetal dimension for PC1 and PC2, respectively. This table tabulates c 1j and c 2j.
The PC1 explained 63.7% of the overall z-score variation at 14 weeks, falling to 57.7% at 19 weeks and 51.1% at 30 weeks. The PC2 explained 17.6% of the overall z-score variation at 14 weeks, rising to 18.2% at 19 weeks and 22.6% at 30 weeks.
Predictors of fetal proportions
Fetal size, as represented by the PC1, varied significantly with the season of measurement at 14- and 19-week time points, although season explained only a tiny fraction of the variability (adjusted R 2 = 1.2%, 0.5% and 0.2% at the 14-, 19- and 30-week time points, respectively). We detected no seasonality in either the PC2 or the LHD scores.
The z-score formulae of Altman and Chitty do not distinguish between male and female babies. Therefore, it is not surprising that infant's sex correlated strongly with both PC1 and PC2, the correlations increasing with GA in both the cases (PC1: R 2 = 0.6%, 2.6% and 3.5%; PC2: R 2 = 0.0%, 1.1% and 1.1%, respectively, for 14-, 19- and 30-week time points). The pattern for LHD was very similar to (though slightly stronger than) that for PC2.
Intervention was not seen to be significantly associated with either principal component or LHD (R 2<0.5% in every case).
SES quintiles also correlated significantly with PC1, PC2 and LHD but weakly (R 2<1%) and only later in pregnancy. Maternal height and weight both correlated with PC1, again most strongly later in pregnancy (R 2 = 4.4% and 5.6% for height and weight, respectively, at 30 weeks; P < 0.0001 in both cases); neither correlated with PC2 or LHD.
Relationship between TI and fetal proportions
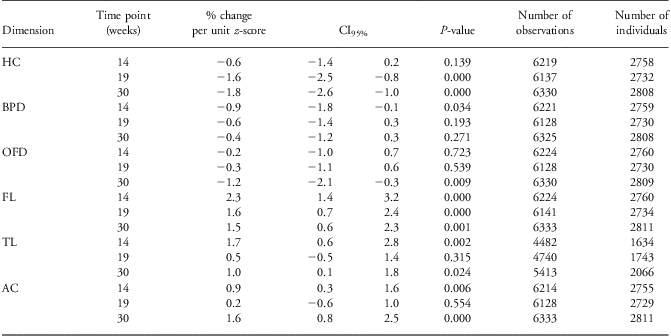
The results of multilevel regression, combining all postnatal time points to give the overall average effect on TI, are given in Tables 2–5. Fitting the z-scores for each dimension at each antenatal time point separately showed each dimension to be significantly associated with TI at least at one time point, although only FL was consistently associated with thymus size (positively) at all three time points (Table 2).
Results of multilevel regression of log(TI) on fetal dimensions z-scores
TI, thymic index; HC, head circumference; BPD, biparietal diameter; OFD, occipito-frontal diameter; FL, femur length; TL, tibia length; AC, abdominal circumference.
Results of separate multilevel (generalized least squares) regression for each fetal dimension at each time point. Models fitted log(TI) at all postnatal time points simultaneously to the z-score of fetal dimension, always controlling for infant sex, age, size (weight and length) and the season of TI measurement. The regression coefficients and their confidence intervals are expressed as the percentage change in TI associated with a one-standard deviation increase in fetal z-score.

Results of multilevel regression of log(TI) on LHD

Results of multilevel regression of log(TI) on LHD.

TI, thymic index; LHD, leg-head difference.
This table gives the results of a single regression, similar to those of Table 4, except that here all three antenatal time points are fitted simultaneously. This model demonstrates that, although fetal measurements at week 14 show the strongest association with TI, measurements at all three time points retain some significance in the presence of the others, indicating that each holds some independent predictive power over and above that of the others.
Clearer patterns emerged when the principal components were fitted. The PC1, a reflection of fetal size, did not correlated with TI at all. This is not surprising as the regression controlled for infant size. PC2 turned out to be more informative; at all three time points, it was significantly associated with TI (Table 3). LHDs yielded very similar results (Table 4). In both cases, the strongest association occurred at 14 weeks and the weakest at 30 weeks of gestation: indeed, the 95% confidence intervals for the effect sizes at weeks 14 and 30 did not overlap. Nevertheless, when LHD14, LHD19 and LHD30 were fitted simultaneously, each maintained a significant partial effect, although the strengths of their individual effects diminished, more so later in pregnancy (Table 5). LHDall was the most powerful predictor of TI: a one-standard deviation change in this score (s.d. = 0.658) was associated with a 4.9% change in TI (CI95% = 4.0–5.9%; 4201 observations on 1529 women).
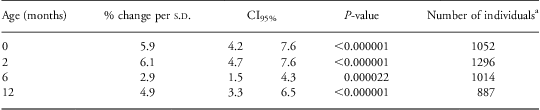
There is some evidence that fetal growth affects TI to a different extent at different ages although no simple pattern emerges. This is most easily illustrated by fitting LHDall, the strongest single predictor of TI. The results of separate regression analyses for each infant age are tabulated in Table 6: the effect size is high at birth, rises further by 2 months and falls markedly at 6 months only to rise again at 1 year. These differences are statistically significant: multilevel models (recombining all the data) show that estimating separate coefficients for LHDall for each infant age gives a better fit than models with a single common coefficient for all ages (χ 2 on 3 df = 16.39, P = 0.0009).
Results of multiple regression of log(TI) at different ages on LHDall
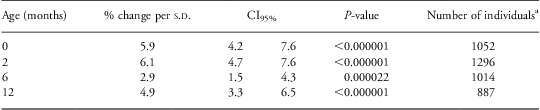
TI, thymic index; LHD, leg-head difference.
Results of (ordinary) multiple regression analyses examining the association between LHDall (the difference between means of leg and head z-scores for all antenatal data combined) and log(TI) separately for each postnatal time point. These models again controlled for infant sex, age, size (weight and length) and the season of TI measurement.
aNo infant was measured more than once at each postnatal age point.
TI did not differ significantly between the intervention groups nor was intervention found to modify the relationships between fetal growth and TI significantly. Similarly, as previously reported,Reference Moore, Prentice and Wagatsuma5 the TI (controlled for infant age) among those infants reported to be exclusively breastfed at the time of measurement differed little from that of those not exclusively breastfed. Controlling for either breastfeeding or intervention group had a negligible effect on the relationships between TI and fetal biometry variables.
Correlations and precision of fetal biometry
Replicate observations indicated that reliabilities of the measurement of individual z-scores were excellent (R 2 > 98% for all measurements at all time points) and were no better at earlier time points. Correlations between z-scores of difference fetal dimensions were consistently weaker later in pregnancy (Fig. 3), although this was much less for within-organ correlations. This implies that much of the divergence between growing fetuses results in greater variation in the relative size of leg and head. This divergence is reflected in a 55% increase in the variance of LHD between 14 weeks and 30 weeks, respectively.
 , week 14;
 , week 19;
 , week 30. Error bars show 95% confidence intervals. HC = head circumference; BP = bi-parietal diameter; OF = occipito-frontal diameter; FL = fibia length; TL = tibia length; AC = abdominal circumference.
Discussion
Faced with a complex picture arising from the associations between TI and the many ultrasound fetal measurements, we used principal component analysis to reduce the dimensionality of the fetal size data to something more manageable. It is perhaps not surprising that the first PC should reflect overall fetal size. This study, however, could not elucidate the association between TI and overall fetal size. Without knowledge of the optimal allosteric relationship between thymic and infant size, it was necessary to control TI for infant size. Fetal size is closely correlated with (confounded by) infant size, and therefore any association between the PC1 and TI could not be disentangled from the relationship between infant size and TI.
The PC2 reveals that the disproportion between head and leg sizes comprises a large part of the variation between individuals in this population at all the three time points in pregnancy. Low values of LHD (and PC2) correspond to a comparatively large head relative to the legs, which suggests ‘brain-sparing’ in a poorly growing fetus.Reference Barker29 LHD (and PC2) always correlated positively with TI, that is intrauterine growth restriction (IUGR) was associated with a small thymus in infancy.
Notably, this association was strongest for LHD at 14 weeks and weakest at 30 weeks. It might be expected that TI would be associated most strongly with those fetal measurements made most recently, that is later in pregnancy. As the opposite turns out to be the case, we must assume that either the ultrasound measurements are a less accurate reflection of growth-restricting deficits later in gestation or that the deficit affecting thymic development occurs earlier. Measurement reliability is very good and similar at all three fetal biometry time points, confirming the results by Neufeld et al.Reference Neufeld, Wagatsuma, Hussain, Begum and Frongillo20 The correlation coefficients plotted in Fig. 3 demonstrate that between-individual variation in the proportions of different fetal dimensions makes a rather more substantial contribution to imprecision than measurement error and this variation does increase as pregnancy progresses. Nevertheless, within organ, this variation is only slightly greater at the later time points and probably insufficient to explain the differences in strength of the association with TI. Thus, the most likely explanation appears to be that some deficit in the first trimester affects thymus development.
IUGR in developing countries is thought to be largely associated with poor maternal nutrition.Reference Kramer30–Reference Bakketeig, Butte and de Onis32 The situation may be more complex. First, even if nutritional deficit is the primary cause, this could be mediated either by a compromised placental supply line, by generalized maternal undernutrition or by certain specific nutrient deficiencies, possibilities that cannot be distinguished here. Alternatively, we may be detecting effects of a toxic insult or a constitutive phenomenon (possibly genetic or possibly immunological, given that placental invasion of the trophoblast is immunologically mediated) that link early anthropometric development with postnatal TI.
Z-scores of the fetal ultrasound measures were surprisingly high, often averaging above zero, indicating that, up to 30 weeks of gestation, these Bangladeshi babies were slightly larger than the UK reference population, although at birth their weights averaged at 2.66 kg, well below the UK average. One possible explanation, that using week 8 ultrasound measurements to fix the date of conception might have overestimated the GA (perhaps due to the use of Japanese reference data for this), can be discounted because the (cruder) z-scores based on the last menstrual period (LMP) recall were equally high. An alternative explanation is that final trimester fetal growth was much slower than for the UK standard either because of uterine constraint imposed by the very small maternal size, or by nutritional restriction at the time of maximal fetal growth. With the exception of FL (which increases from weeks 14 to 19 and then declines to week 30) and TL (which increases progressively), the other measurements decline from week 14 onwards. We note that Neufeld et al.Reference Neufeld, Haas, Grajeda and Martorell33 reported a similar disparity between fetal ultrasounds z-scores and birth anthropometry in a Guatemalan population, again using the UK reference data. Altman and Chitty based their z-score reference data on single measurements, rather than the average of replicate measurements, which leaves measurement error in the variance and hence yields z-scores that are rather smaller (closer to zero) than would be the case, had they been based only on the inter-individual variation. This would not, however, account for the discrepancy between the positive fetal and the negative postnatal z-scores. Uterine constraint on last trimester fetal growth, imposed by the very small maternal size, therefore remains the most likely explanation.
On a technical note, the decision to use ultrasound-based rather than LMP-based determination of GA involved weighing the bias inherent in ultrasound dating against the imprecision of recall of LMP. That the LMP dating is less precise is clear: for every fetal dimension at every time point, the LMP-based z-scores had a higher standard deviation (17% higher at week 14, 16% at week 19 and 12% at week 30) than ultrasound-based z-scores, and rerunning the above analysis using LMP-based z-scores (data not shown) gave less clear patterns and weaker correlations. The effect of the bias associated with ultrasound dating is to underestimate the GA of slower growers and overestimate that of faster growers, thereby reducing the differences between them and yielding more conservative tests of association. Essentially, this method ‘zeros’ everyone at the point of GA determination so that differences in growth before that point will be missed. However, as the main statistic of interest in this study is the difference between leg and head z-scores, this source of bias will largely cancel out. Although we appreciate that these arguments are not rigorous, we note that others have generally found ultrasound to be better than LMP methods in predicting the date of delivery.Reference Rowland and Royston34, Reference Bakketeig35
In conclusion, we present evidence that the difference between fetal leg and head z-scores provides a useful metric of fetal growth. The surprising strength with which the 14-week fetal biometry predicts postnatal TI suggests that thymic development is especially vulnerable to growth limiting (possibly nutritional) deficits during a critical window in the first trimester of pregnancy. This poses special challenges for intervention. In practice, it is difficult to enrol pregnant women into any sort of nutritional intervention in the first trimester of pregnancy, and this places an additional emphasis on the importance of pre-conceptional nutrition.
Acknowledgements
L.Å.P. and S.E.A. conceived and oversaw the original MINIMat trial. L.M.N. and Y.W. designed and implemented the fetal ultrasound component of the MINIMat study. S.E.M., Y.W. and A.M.P. designed and implemented the thymus ultrasound component of the study. A.J.C.F. conceived the current analysis, performed all statistical analysis and wrote the manuscript. All authors read and approved the final manuscript. The authors acknowledge the contribution of the families in Matlab participating in the MINIMat project. The authors are grateful to all the staff from the MINIMat study. The MINIMat project has been financially supported by UNICEF, the Department for International Development (DFID), Swedish International Development Cooperation Agency (SIDA), the United States Agency for International Development (USAID) and the Child Health and Nutrition Research Initiative (CHNRI). The Japanese Society for Promotion of Science (JSPS) provided funding for the ultrasound component; the thymic ultrasound sub-study also received support from the UK Medical Research Council.
Financial support
Financial support was received from UNICEF, DFID, SIDA, USAID, CHNRI, JSPS and MRC.
Conflict of interest
None of the authors have a conflict of interest with respect to this paper.
Ethical Standards
The main MINIMat study and the thymic size addendum were approved by the Research Review and Ethical Review Committees, ICDDR,B, Dhaka, Bangladesh. The thymic size addendum was additionally approved by the Ethics Committee at the London School of Hygiene and Tropical Medicine. Written informed consent was obtained from all participating mothers following an explanation of the study in their own language.