





Introduction
Carolina geranium (Geranium carolinianum L.) occurs in 58% of Florida strawberry [Fragaria × ananassa (Weston) Duchesne ex Rozier (pro sp.) [chiloensis × virginiana]] fields and is considered one of the most problematic weed species (Boyd and Reuss Reference Boyd and Reuss2022). It is a cool-season annual or biennial broadleaf weed that poses significant management challenges (Linex Reference Linex2020; Webster Reference Webster2014). Geranium carolinianum emerges in transplant holes shortly after strawberry transplanting and is also commonly observed in the bare ground between the raised beds (row middles). Row-middle weeds can impact the crop yield (Gilreath and Santos Reference Gilreath and Santos2004), interfere with harvest operations, and increase labor costs. Notably, G. carolinianum is a strong competitor when it emerges on the bed top, with berry yield losses of up to 935 kg ha⁻1 for each additional plant per square meter (Buzanini and Boyd Reference Buzanini and Boyd2024).
Clopyralid is the only herbicide currently registered for postemergence broadleaf weed control in strawberry fields (Sharpe et al. Reference Sharpe, Boyd and Dittmar2016). Growers commonly delay its application until mid-January, as G. carolinianum appears small and hidden in crop canopy due to slow early-season growth, often escaping early detection and timely intervention when it is most susceptible to clopyralid treatment (Sharpe et al. Reference Sharpe, Boyd, Dittmar, MacDonald and Darnell2018a). As strawberry harvest begins at the end of December, growers tend not to use this herbicide due to the 7-d preharvest interval in strawberry. Additionally, berries harvested earlier in the season get higher market prices (Wu et al. Reference Wu, Guan and Whitaker2018), so farmers likely avoid any practices that could interfere with early harvest. Moreover, many farmers remain concerned about possible crop injury of clopyralid, although repeated studies have confirmed its safety (Boyd and Dittmar Reference Boyd and Dittmar2015; Sharpe et al. Reference Sharpe, Boyd, Dittmar, MacDonald and Darnell2018a). These factors highlight the need for predictive emergence models to guide growers to identify the optimal application timing for effective management.
Research on weed seedling emergence patterns in the Florida strawberry production system is limited, and to date, no emergence model has been developed for G. carolinianum. Empirically derived emergence models based on field observations and growing degree days (GDD) have proven to be reliable and have been successfully applied to various weed species (Marschner et al., Reference Marschner, Colucci, Stup, Westbrook and Brunharo2024; Werle et al. Reference Werle, Sandell, Buhler, Hartzler and Lindquist2014). This modeling approach is well-suited for annual and perennial species in temperate regions, where the GDD accumulation begins once the daily temperature exceeds the base temperature (Martinson et al. Reference Martinson, Durgan, Forcella, Wiersma, Spokas and Archer2007; Werle et al. Reference Werle, Sandell, Buhler, Hartzler and Lindquist2014; White et al. Reference White, Boyd and Van Acker2012, Reference White, Boyd and Van Acker2015). However, applying standard GDD-based emergence models in subtropical regions like Florida is challenging, particularly due to inflated GDD accumulation resulting from high temperatures. To address this limitation, incorporating daily GDD restrictions based on key physiological processes such as dormancy, germination, and preemergence growth may enhance model accuracy (Grundy Reference Grundy2003; Vleeshouwers and Kropff Reference Vleeshouwers and Kropff2000). For example, integrating temperature-based criteria to determine when GDD accumulation should be restricted successfully mitigated GDD inflation in germination models for black medick (Medicago lupulina L.) in Florida strawberry production systems (Sharpe and Boyd Reference Sharpe and Boyd2019a).
Freshly matured seeds of G. carolinianum exhibit combinational dormancy, consisting of physical dormancy (PY) and shallow, non-deep physiological dormancy (PD). The PD component is typically lost after a brief (0.5 mo) afterripening period (Baskin and Baskin Reference Baskin and Baskin1974). Therefore, the timing of G. carolinianum germination in the field is primarily due to loss of PY imposed by water-impermeable seed coats. The breaking of PY occurs through two moisture-independent steps that are regulated by temperature (Gama-Arachchige et al. Reference Gama-Arachchige, Baskin, Geneve and Baskin2012). During the first stage, seeds become sensitive to low temperatures when exposed to temperatures ≥20 C, a condition commonly met during Florida’s summer, which is not relevant to dormancy-based modeling for seedling emergence in Florida strawberry production system. In the second stage, these temperature-sensitized seeds become water-permeable when daily temperatures decline to ≤20 C even for a short period of time (Gama-Arachchige et al. Reference Gama-Arachchige, Baskin, Geneve and Baskin2013), typically occurring during the autumn season, which overlaps with the strawberry production season in Florida. These findings provided the basis for developing daily GDD accounting restrictions to model G. carolinianum seed dormancy release.
Few studies have investigated the germination ecology of G. carolinianum. Sharpe and Boyd (Reference Sharpe and Boyd2019b) reported maximum germination at 10 C in darkness and at 20 C under light, with no germination observed at or above 30 C under either condition, suggesting a negative photoblastic response. However, Baskin and Baskin (Reference Baskin and Baskin1974) concluded that this negative photoblastic effect is limited to freshly matured seeds (within 1.5 mo). Liu et al. (Reference Liu, Zong, Li, Zhou and Bai2018) found optimal germination at 20/15 C and 25/20 C (day/night), with germination nearly ceasing at 30/25 C. They also reported no significant effect of photoperiod on germination, indicating that light plays a minimal role in regulating this process. In contrast to dormancy, G. carolinianum germination is highly dependent on moisture availability (Baskin and Baskin Reference Baskin and Baskin1974). A germination study on a Florida population showed minimal G. carolinianum germination at a soil water potential of −0.4 MPa and complete inhibition at or below −0.6 MPa (Sharpe and Boyd Reference Sharpe and Boyd2019b). These findings suggest that germination is regulated by temperature and moisture differently than dormancy, indicating the need to develop daily GDD accounting restrictions for G. carolinianum germination modeling.
Similarly, in preemergence growth modeling, burial depth is a critical factor influencing the emergence rate and timing of germinated seeds (Grundy Reference Grundy2003). Due to its small seed size and limited food reserves, G. carolinianum was initially suspected to exhibit surface-level germination. This was confirmed by Liu et al. (Reference Liu, Zong, Li, Zhou and Bai2018), who reported maximum germination at the soil surface and up to 3-cm depth, with minimal emergence below 3 cm and complete inhibition at or below 7 cm. Given this surface germination, the effect of preemergence growth was assumed to be negligible on emergence modeling.
As noted previously, no emergence model has been developed for G. carolinianum in row middles or in transplant holes on plastic-covered beds. In addition, in plasticulture production systems, moisture availability often differs between bed tops and row middles, potentially influencing both the rate and timing of emergence. Therefore, the objective of this study was to develop a cumulative emergence model for G. carolinianum on bed tops and row middles of Florida strawberry fields using restricted GDD accumulation as the predictive variable.
Materials and Methods
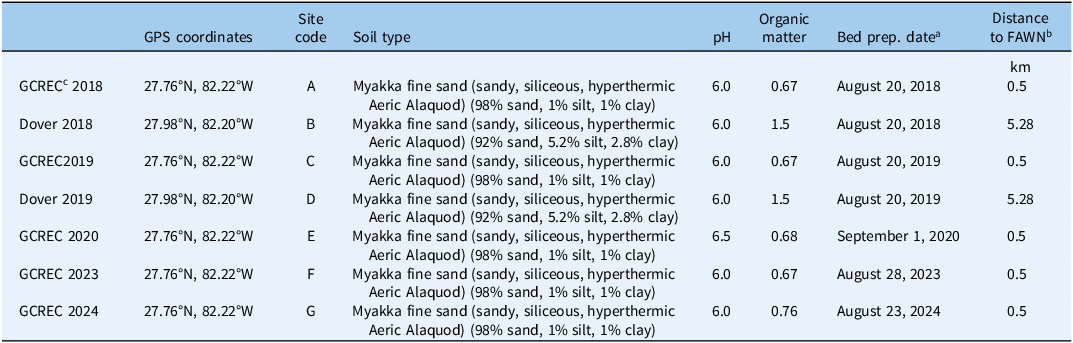
The study was initiated in 2018 at the Gulf Coast Research and Education Center, Balm, FL (27.76°N, 82.22°W) and repeated four times in 2019, 2020, 2023, and 2024. Data were also collected from the Dover research farm at Dover, FL (27.98°N, 82.20°W) in 2018 and 2019, for a total of 7 site-years of data. Sites were selected based on previous history of G. carolinianum infestations (Table 1). At each site, strawberries were grown in the conventional plasticulture system. No herbicides were applied in areas selected for monitoring weed emergence in row middles and under the plastic mulch.
Site specifications for each site-year of the Geranium carolinianum emergence study between 2018 and 2024 in Hillsborough County, FL.

Table 1. Long description
The table presents site specifications for a study on Geranium carolinianum emergence between 2018 and 2024 in Hillsborough County, FL. It includes data on GPS coordinates, site codes, soil types, pH levels, organic matter percentages, bed preparation dates, and distances to FAWN. The table has 7 rows and 7 columns. Column headers are GPS coordinates, Site code, Soil type, pH, Organic matter, Bed prep. date, and Distance to FAWN. Row 1: GCREC 2018, 27.76 N, 82.22 W, A, Myakka fine sand (98 percent sand, 1 percent silt, 1 percent clay), 6.0, 0.67, August 20, 2018, 0.5 kilometers. Row 2: Dover 2018, 27.98 N, 82.20 W, B, Myakka fine sand (92 percent sand, 5.2 percent silt, 2.8 percent clay), 6.0, 1.5, August 20, 2018, 5.28 kilometers. Row 3: GCREC 2019, 27.76 N, 82.22 W, C, Myakka fine sand (98 percent sand, 1 percent silt, 1 percent clay), 6.0, 0.67, August 20, 2019, 0.5 kilometers. Row 4: Dover 2019, 27.98 N, 82.20 W, D, Myakka fine sand (92 percent sand, 5.2 percent silt, 2.8 percent clay), 6.0, 1.5, August 20, 2019, 5.28 kilometers. Row 5: GCREC 2020, 27.76 N, 82.22 W, E, Myakka fine sand (98 percent sand, 1 percent silt, 1 percent clay), 6.5, 0.68, September 1, 2020, 0.5 kilometers. Row 6: GCREC 2023, 27.76 N, 82.22 W, F, Myakka fine sand (98 percent sand, 1 percent silt, 1 percent clay), 6.0, 0.67, August 28, 2023, 0.5 kilometers. Row 7: GCREC 2024, 27.76 N, 82.22 W, G, Myakka fine sand (98 percent sand, 1 percent silt, 1 percent clay), 6.0, 0.76, August 23, 2024, 0.5 kilometers.
a Bed preparation date was assumed as the starting date for GDD accumulation.
b FAWN, Florida Automated Weather Network, University of Florida, Institute of Food and Agriculture Science, https://fawn.ifas.ufl.edu/.
c GCREC, Gulf Coast Research Education Center, University of Florida, Institute of Food and Agriculture Science.
For row-middle data collection, eight 50 by 50 cm quadrats were randomly placed throughout the field, except in 2023 and 2024, when 10 quadrats of same dimensions were randomly distributed in the field. Early-season weed density was counted weekly and every other week when emergence activity declined. All seedlings were clipped at the soil surface when counting and carefully removed to prevent soil disturbance.
Bed-top data collection occurred in 2018 and 2020 at the Gulf Coast Research and Education Center, Balm, FL. Emergence counts occurred in six plots, each adjacent to the randomly distributed quadrats for the row-middle data collection. Each plot occurred on a single bed and contained 20 planting holes plot−1. Each planting hole was monitored throughout the season for the emergence of G. carolinianum seedlings.
For both row middles and bed tops, bed preparation date was considered as the starting date for GDD accumulation across all site-years.
Estimation of Soil Temperature and Moisture
Soil temperature and moisture were estimated using the Soil Temperature and Moisture Model (STM2). This is a user-friendly software tool developed by the USDA-ARS (https://www.ars.usda.gov/research/software/download/?softwareid=209) to predict the soil microclimatic conditions (Spokas and Forcella Reference Spokas and Forcella2009). The STM2 simulates hourly or daily soil temperature and soil water potential using input variables such as daily rainfall, minimum and maximum air temperatures, soil texture, organic matter content, and other basic site information. The STM2 was tested in many global sites (Spokas and Forcella Reference Spokas and Forcella2009) and proved to be useful in weed emergence modeling (Chantre et al. Reference Chantre, Blanco, Lodovichi, Bandoni, Sabbatini, López, Vigna and Gigón2012, Reference Chantre, Blanco, Forcella, Van Acker, Sabbatini and González-Andújar2014, Reference Chantre, Vigna, Renzi and Blanco2018; McGiffen et al. Reference McGiffen, Spokas, Forcella, Archer, Poppe and Figueroa2008; Schutte et al. Reference Schutte, Regnier, Harrison, Schmoll, Spokas and Forcella2008).
Liu et al. (Reference Liu, Zong, Li, Zhou and Bai2018) reported that G. carolinianum emergence primarily occurs in the top 3 cm of the soil profile, with significantly less emergence at depths of 4 to 6 cm (less than 20%) and complete inhibition at depths of 7 cm or greater. Therefore, 2 cm was considered as a representative seed burial depth in strawberry fields for the purpose of estimating soil moisture and temperature.
The model was calibrated using site-specific soil parameters. Daily soil temperature (
 $T_{a}$
) and water potential (ѱ) at the 2-cm burial depths were estimated using the weather data obtained from the Florida Automated Weather Network (FAWN; University of Florida, Institute of Food and Agricultural Science; https://fawn.ifas.ufl.edu/). Two weather stations; one in Dover and another in Balm, were selected due to their proximity to the study sites. The daily temperature (both minimum and maximum) and precipitation data of the corresponding year were used for modeling. For each site, estimated temperature and soil moisture values obtained from the STM2 were used for both row-middle and bed-top emergence modeling.
Overhead irrigation was typically applied for 10 to 14 d following strawberry transplanting. However, moisture contributions from overhead irrigation were not incorporated into the models, because irrigation practices were consistent across all site-years. Additionally, drip tape was installed within the bed top at each site for irrigation throughout the production season. Moisture contributions from drip irrigation were also not included in the modeling framework. The exclusion of irrigation as a moisture source was intended to maintain model consistency and to focus on variability associated with naturally occurring precipitation and atmospheric conditions.
Empirical Approach
The empirical approach considers emergence as a single event. Thermal time and hydro-time were calculated separately using the simulated temperature and soil moisture potential previously described. Geranium carolinianum cumulative emergence was modeled across GDD derived using accumulated thermal time and hydrothermal time. Thermal time was calculated as:
 ${\theta _{\rm{T}}} = \sum\nolimits_{{\rm{i}} = 1}^{\rm{n}} {\left( {T_{a} - T_{b}} \right)} \,i\; = \;1,\;2,\; \ldots \ldots, \;n$
where
 ${{{\theta }}_{\rm{T}}}$
represents the accumulated thermal time, i represents the number of days,
 $T_{{a}}$
represents the average soil temperature at a depth of 2 cm (C),
 $T_{{b}}$
is the base temperature for G. carolinianum emergence (C) below which emergence does not occur, and n denotes the number of days. A base temperature of 0 C was assumed for G. carolinianum. Atabaki et al. (Reference Atabaki, Gherekhloo, Ghaderi-Far, Ansari, Hassanpour-Bourkheili and De Prado2023) reported a base temperature of 0.01 C for cutleaf geranium (Geranium dissectum L.), another winter annual broadleaf weed from the Geraniaceae family. Similarly, Liu et al. (Reference Liu, Zong, Li, Zhou and Bai2018) observed greater than 50% germination of G. carolinianum at night/day temperatures of 5/10 C, supporting the assumption that 0 C is not an unreasonably low estimate for the base temperature.
Similarly, hydrothermal time was calculated as:
 ${{\theta}} _{{\rm{HT}}} = \sum\nolimits_{{\rm{i}} = 1}^{\rm{n}} {\left( {{{{\theta}} _{\rm{T}}}\; \times \;{{{\theta}} _{\rm{H}}}} \right)}\, \;i\; = \;1,\;2,\; \ldots \ldots, \;n$
where
 ${{{\theta }}_{{\rm{HT}}}}$
is accumulated hydrothermal time, and
 ${{{\theta }}_{\rm{T}}}$
and i are defined according to Equation 1, while
 ${{{\theta }}_{\rm{H}}}$
is hydro-time and was estimated as:
 ${{{{\theta}} _H} = 1,\,if\,\,{\rm{\psi}} }\,{ \gt {\,{\rm{\psi}} _b}}$
 ${{0,if\,\,{\rm{\psi}} } { \gt {\,{\rm{\psi}} _{_b}}} }$
where ѱ is soil water potential at 2-cm depth (MPa), ѱb is base water potential for G. carolinianum (MPa) below which emergence does not occur. This study assumed −0.6 MPa as base water potential for G. carolinianum based on a study of germination biology of G. carolinianum populations in Florida (Sharpe and Boyd, Reference Sharpe and Boyd2019b).
Reductionist Approach
This approach partitions the emergence into three different physiological processes: dormancy release, germination, and preemergence growth. As previously mentioned, G. carolinianum primarily emerges at or near the soil surface, so the influence of preemergence growth was assumed to be negligible. Overall, cumulative emergence was modeled as a function of restricted thermal or restricted hydrothermal time for row middles, while only restricted thermal time was used for bed-top emergence.
Dormancy-based Restriction
The second dormancy release stage is pertinent to the strawberry growing season. This is when exposure of G. carolinianum seed to temperatures at or below 20 C makes it permeable to water imbibition (Gama-Arachchige et al. Reference Gama-Arachchige, Baskin, Geneve and Baskin2012). The temperature at 2-cm soil depth was simulated at hourly intervals using the STM2 model, and the lowest temperature within 24-h periods was considered the minimum temperature. A restriction was imposed as follows:
 ${{{\theta}} _{\rm{T}}} = \sum\limits_{{\rm{i}} = 1}^{\rm{n}} {\left( {T_{{a}} - T{_{b}}} \right)}, \;\;{\rm{if}}\;T_{\rm{min}}\; \le \;20\;{\rm{C}},$
 ${{{{{\theta}} }}_{\rm{T}}} = 0, {\rm{otherwise}}$
where
 ${{\theta}}_{\rm{T}},$
 $T_{a}$
,
 $T_{b}$
, and i (1, 2,…, n) are defined in the Equation 1, and
 $T_{\rm{min}}$
is the minimum day temperature,
Germination-based Restriction
Thermal time accumulation was calculated based on Hammer et al. (Reference Hammer, Carberry and Muchow1993) and Chantre et al. (Reference Chantre, Blanco, Lodovichi, Bandoni, Sabbatini, López, Vigna and Gigón2012):
 ${{{\theta}} _{\rm{T}}} = \sum\nolimits_{{\rm{i}} = 1}^{\rm{n}} {\left( {T_{a} - T_{b}} \right)}, \;{\rm{if}}\;T_{b}\; \lt \;T_{{a}}\; \lt \;T_{o}\;$
 ${{{\theta}} _{\rm{T}}} = \sum\nolimits_{{\rm{i}} = 1}^{\rm{n}} {\left( {T_{a} - T_{o}} \right)} \left( {1 - {{T_{a} - T_{o}} \over {T_{m} - T_{o}}}} \right),\;{\rm{if}}\;T_{o}\; \lt \;T_{a}\; \lt \;T_{m}$
 ${{{\theta }}_{\rm{T}}} = 0,\;{\rm{otherwise}}$
Equation 5a and 5b are defined for the suboptimal and supra-optimal thermal ranges, respectively. Here,
 ${{{\theta }}_{_{T}}},{\rm{\;}}T_{a}$
,
 $T_{b}$
, and i (1, 2,…, n) are defined in Equation 1,
 $T{\rm{o}}$
means optimum temperature for G. carolinianum germination, and
 $T_{m}$
means maximum temperature for G. carolinianum germination. The cardinal temperatures were:
 $T_{b}$
= 0 C (Atabaki et al., Reference Atabaki, Gherekhloo, Ghaderi-Far, Ansari, Hassanpour-Bourkheili and De Prado2023),
 $T_{o}$
= 20 C (Atabaki et al., Reference Atabaki, Gherekhloo, Ghaderi-Far, Ansari, Hassanpour-Bourkheili and De Prado2023; Liu et al., Reference Liu, Zong, Li, Zhou and Bai2018; Sharpe and Boyd Reference Sharpe and Boyd2019b), and
 $T_{m}$
= 30 C (Atabaki et al. Reference Atabaki, Gherekhloo, Ghaderi-Far, Ansari, Hassanpour-Bourkheili and De Prado2023; Liu et al. Reference Liu, Zong, Li, Zhou and Bai2018; Sharpe and Boyd Reference Sharpe and Boyd2019b).
Hydro-time was calculated as:
 ${{{\theta}} _{\rm{H}}} = 1,{\mkern 1mu} {\mkern 1mu} if\,{\rm{\psi}} \,{\rm{ \gt }}{\,{\rm{\psi}} _b}$
 $0,if\,{\rm{\,{\rm{\psi}}}} {\rm{\, \gt }}{\,{\rm{\psi}} _b}$
where ѱ is soil water potential at 2-cm depth (MPa), ѱb is base water potential for G. carolinianum (MPa) below which emergence does not occur.
Finally, hydrothermal time was calculated as:
 ${{\theta} _{{\rm{HT}}}} = \sum\nolimits_{{\rm{i}} = 1}^{\rm{n}} {\left( {{{{\theta}} _{\rm{T}}}\; \times \;{{{\theta}} _{\rm{H}}}} \right)}$
where
 ${{{\theta }}_{{\rm{HT}}}}$
,
 ${{{\theta }}_{\rm{T}}}$
,
 ${{{\theta }}_{\rm{H}}}$
, and i (1, 2,…, n) are defined in Equations 1 and 2.
Finally, both dormancy- and germination-based restrictions were jointly imposed (Equation 4a to 6f) regardless of developmental stages of the soil seedbank to develop a single dormancy- and germination-based restriction model as follows:
 ${{{\theta}} _{{\rm{HT}}}} = \sum\nolimits_{{\rm{i}} = 1}^{\rm{n}} {\left( {{{{\theta}} _{\rm{T}}}\; \times \;{{{\theta}} _{\rm{H}}}} \right)}$
where
 ${{{{{\theta}} }}_{\rm{T}}}$
was calculated as in Equations 5a, 5b, and 5c when
 $T_{a}$
≤ 20 C, otherwise
 ${{{\theta }}_{\rm{T}}}$
was considered 0.
 ${{{\theta }}_{\rm{H}}}{\rm{\;}}$
was calculated as in Equations 6d and 6e.
Separate models were developed using empirical and reductionist approaches. In the empirical approach, models were based on standard GDD (thermal or hydrothermal time). In the reductionist approach, three models were developed: first incorporating dormancy-based restrictions, second incorporating germination-based restrictions, and a third combining both dormancy- and germination-based restrictions. In both empirical and reductionist approaches, cumulative emergence was modeled as a function of accumulated GDD (standard or restricted), representing thermal or hydrothermal time, using a logistic function of the form:
 $y = {k \over {1 + \exp \left( { - c\left( {x - b} \right)} \right)}}$
where y represents the percentage cumulative emergence, k is asymptote parameter representing the maximum emergence, c is rate of increase of percentage cumulative emergence, x is accumulated GDD, and b is the inflection point that indicates GDD for half of maximum cumulative emergence.
In all cases, goodness of fit was determined by examining the adjusted coefficient of determination (
 ${\rm{R}}_{{\rm{adj}}}^2$
) and root mean-square error (RMSE) value. The adjusted R2 value was computed using the formula:
 ${\rm{R}}_{{\rm{adj}}}^2\; = \;1 - \;\;{{\left( {n - 1} \right)\left( {1 - {{\rm{R}}^2}} \right)} \over {\left( {n - p - 1} \right)}}$
where n is the number of observations, p is the number of parameters, and R is the coefficient of determination calculated as:
 ${{\rm{R}}^2}\; = \;1 - \;{{\sum {{{\left( {{y_{{\rm{obs}}}} - {y_{{\rm{pred}}}}} \right)}^2}} } \over {\sum {{{\left( {{y_{{\rm{obs}}}} - \bar y} \right)}^2}} }}$
Here, ӯ represents the mean of all observed values,
 ${y_{{\rm{obs}}}}$
denotes the observed values, and
 ${y_{{\rm{pred}}}}$
represents the model’s predicted values.
Similarly, the RMSE value was computed as:
 ${\rm{RMSE}}\; = \sqrt {\left( {{1 \over n}} \right)\sum\nolimits_{i = 1}^n {{{\left( {{y_{{\rm{obs}}}} - {{\rm{y}}_{{\rm{pred}}}}} \right)}^2}} }$
Nonlinear regression was performed using R v. 4.4.2 (R Foundation for Statistical Computing, Vienna, Austria; R Core Team 2024). For row middles, 5 randomly selected site-years of data were used to develop the models and were validated on the remaining 2 site-years. The model’s performance was determined based on validation result. For bed tops, 2 site-years were used to develop the model, while no validation was performed.
Results and Discussion
Geranium carolinianum Emergence in Row Middles
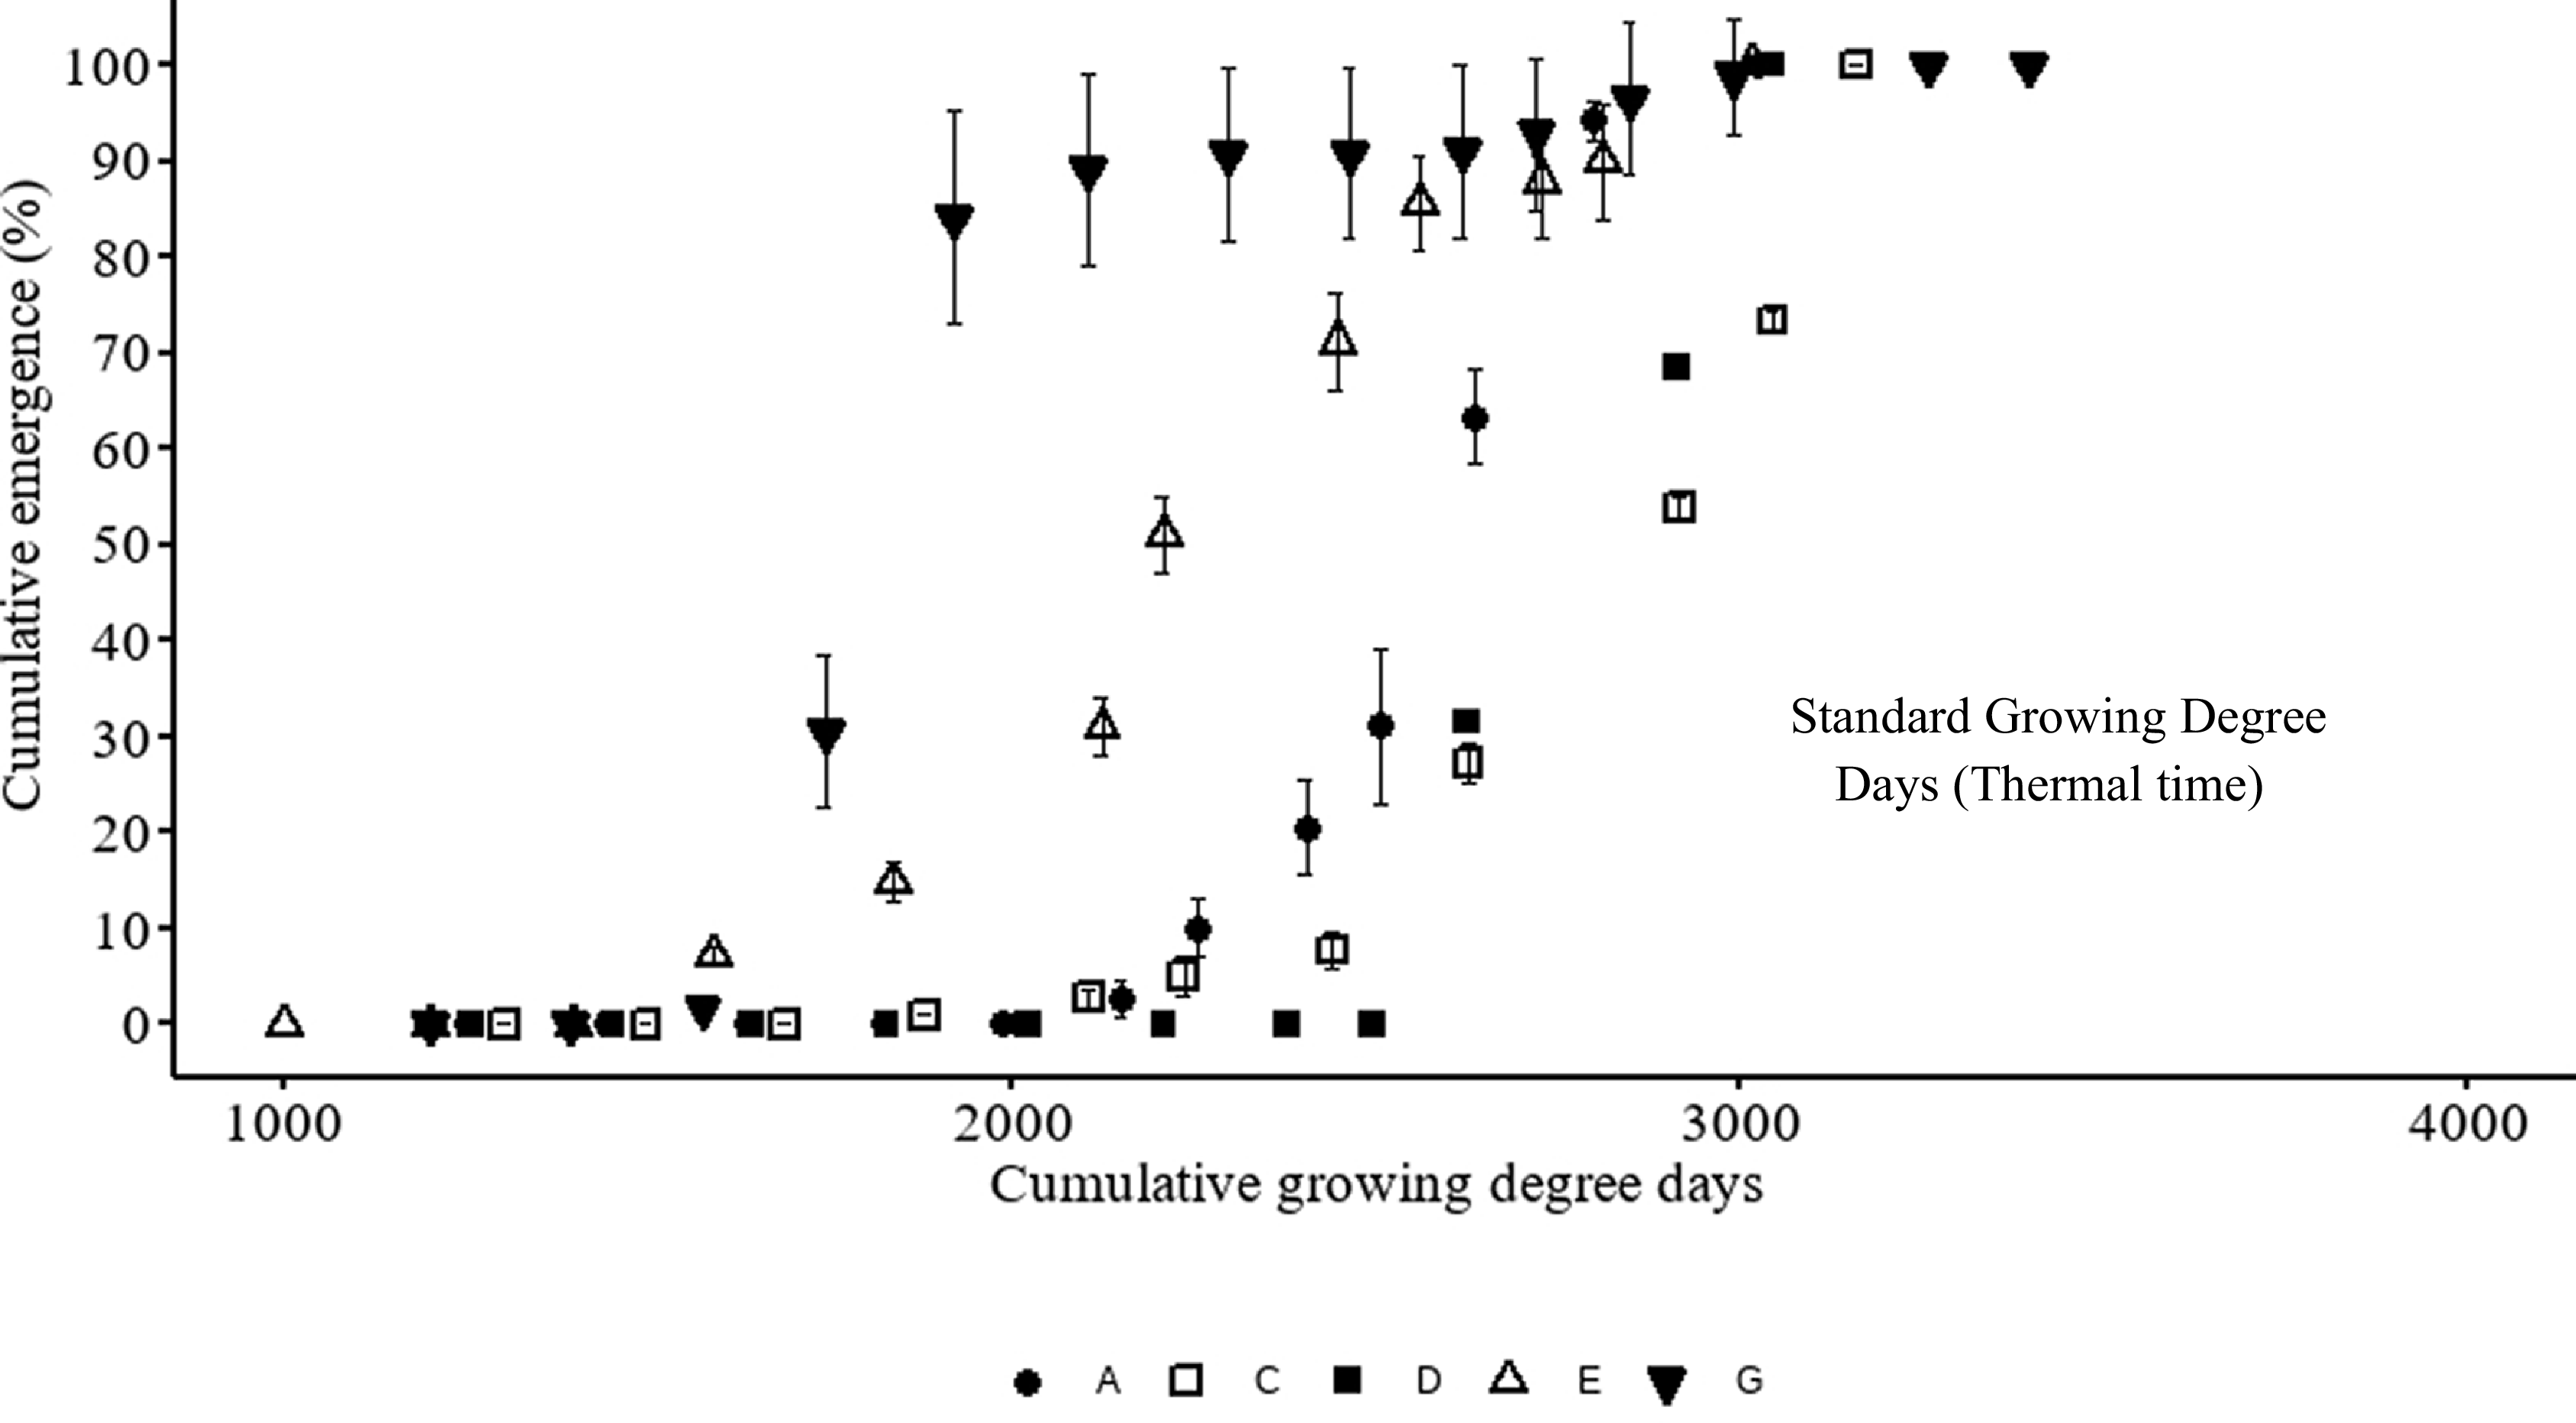
Geranium carolinianum emergence timing varied across years, indicating the influence of environmental variation on emergence dynamics. Initial emergence was typically observed approximately 8 wk post–bed preparation or 1 wk following strawberry transplanting. When cumulative emergence was plotted against standard GDD derived solely from thermal time, no consistent or biologically meaningful pattern emerged, preventing the model development (Figure 1). However, when cumulative emergence was plotted against GDD calculated using hydrothermal time, which accounts for both temperature and moisture, a logistic emergence pattern was observed (Figure 2M1). Despite this improvement, model validation using standard GDD had poor predictive performance (Figure 3M1). This lack of fit can be primarily attributed to inflation of GDD values during periods of suboptimal conditions, where hydrothermal time continued to accumulate despite the absence of emergence, thereby disconnecting modeled predictions from actual emergence.
Distribution of Geranium carolinianum cumulative emergence across standard growing degree days (GDD) derived using thermal time for Florida strawberry row middles for 5 site-years. Symbols represent the mean of replicates at each site. Symbols represented by the letters A, C, D, E, and G indicate site-years Balm 2018, Balm 2019, Dover 2019, Balm 2020, and Balm 2024, respectively. Error bars represent standard error of the mean.

Potential models for Geranium carolinianum emergence in Florida strawberry row middles for 5 site-years. Symbols represent the mean of replicates at each site-year. Symbols represented by the letter A, C, D, E, and G indicate site-years Balm 2018, Balm 2019, Dover 2019, Balm 2020, and Balm 2024, respectively. Error bars represent standard error of the mean. For the standard growing degree-day (GDD) model (M1), GDD were calculated using hydrothermal time as: GDD =
 ${\theta _{{\rm{HT}}}} = \sum\nolimits_{{\rm{i}} = 1}^{\rm{n}} {\left( {{\theta _{\rm{T}}}\;{\rm{x}}\;{\theta _{\rm{H}}}} \right)}$
, here
 ${\theta _{\rm{T}}} = \sum\nolimits_{{\rm{i}} = 1}^{\rm{n}} {\left( {T_{a} - T_{b}} \right)} \;$
and
 ${{\rm{\theta }}_{\rm{H}}}$
= 1, if ѱ > ѱb and 0, if ѱ > ѱb. For the dormancy-based restriction model (M2), restrictions include: if
 $T_{\rm{min}}$
≤ 20 C, then GDD =
 ${\theta _{\rm{T}}} = \sum\nolimits_{{\rm{i}} = 1}^{\rm{n}} {\left( {T_{a} - T_{b}} \right)}$
; otherwise GDD = 0. For the germination-based restriction model (M3), GDD =
 ${\theta _{{\rm{HT}}}} = \sum\nolimits_{{\rm{i}} = 1}^{\rm{n}} {\left( {{\theta _{\rm{T}}}\; \times \;{\theta _{\rm{H}}}} \right)}$
, three restrictions were imposed for thermal time: (1) if
 $T_{b}$
<
 $T_{a}$
<
 $T_{o}$
, then
 ${\theta _{\rm{T}}} = \sum\nolimits_{{\rm{i}} = 1}^{\rm{n}} {\left( {T_{a} - T_{b}} \right)}$
; (2) if
 $T_{o}$
<
 $T_{a}$
<
 $T_{m}$
, then
 ${\theta _{\rm{T}}} = \sum\nolimits_{{\rm{i}} = 1}^{\rm{n}} {\left( {T_{a} - T_{b}} \right)} \left( {1 - {{{{T_a}} - {{T_b}}} \over {{{T_m}} - {{T_o}}}}} \right)$
; and (3)
 ${{\rm{\theta }}_{\rm{T}}}$
= 0 otherwise, for hydro-time
 ${{\rm{\theta }}_{\rm{H}}}$
= 1, if ѱ > ѱb and 0, if ѱ > ѱb. For dormancy- and germination-based restriction model (M4), both physiological process-based restrictions were imposed first dormancy (as in model M2) then germination restrictions (as in model M3). Temperature and moisture data were simulated using STM2 model. For calculation, 0 C, 20 C, and 30 C were used as base, optimum, and maximum temperatures, respectively. Accumulated GDD were fit with a logistic equation.

Validation models for Geranium carolinianum emergence in Florida strawberry row middles for 5 site-years. Symbols represent the mean of replicates at each site-year. Symbols represented by the letters B and F indicate site-years Dover 2018 and Balm 2023, respectively. Error bars represent standard error of the mean. For the standard growing degree-day (GDD) model (M1), GDD were calculated using hydrothermal time as: GDD =
 ${\theta _{{\rm{HT}}}} = \sum\nolimits_{{\rm{i}} = 1}^{\rm{n}} {\left( {{\theta _{\rm{T}}}\; \times \;{\theta _{\rm{H}}}} \right)}$
, here
 ${\theta _{\rm{T}}} = \sum\nolimits_{{\rm{i}} = 1}^{\rm{n}} {\left( {T_{a} - T_{b}} \right)}, \;$
and
 ${{\rm{\theta }}_{\rm{H}}}$
= 1, if ѱ > ѱb and 0, if ѱ > ѱb. For the dormancy-based restriction model (M2), restrictions include: if
 $T{\rm{min}}$
≤ 20 C, then GDD =
 ${\theta _{\rm{T}}} = \sum\nolimits_{{\rm{i}} = 1}^{\rm{n}} {\left( {T_{a} - T_{b}} \right)}$
; otherwise GDD = 0. For the germination-based restriction model (M3), GDD =
 ${\theta _{{\rm{HT}}}} = \sum\nolimits_{{\rm{i}} = 1}^{\rm{n}} {\left( {{\theta _{\rm{T}}}\; \times \;{\theta _{\rm{H}}}} \right)}$
, for thermal time, three restrictions were imposed: (1) if
 $T_{{b}}$
<
 $T_{a}$
<
 $T_{o}$
, then
 ${\theta _{\rm{T}}} = \sum\nolimits_{{\rm{i}} = 1}^{\rm{n}} {\left( {T_{a} - T_{b}} \right)}$
; (2) if
 ${{T_o}}$
<
 $T_{a}$
<
 $T_{m},$
then
 ${\theta _{\rm{T}}} = \sum\nolimits_{{\rm{i}} = 1}^{\rm{n}} {\left( {T_{{a}} - T_{{b}}} \right)} \left( {1 - {{{{T_{a}}} - {{T_{b}}}} \over {{{T_{m}}} - {{T_{o}}}}}} \right)\;$
; and (3)
 ${{\rm{\theta }}_{\rm{T}}}$
= 0 otherwise, for hydro-time
 ${{\rm{\theta }}_{\rm{H}}}$
= 1, if ѱ > ѱb and 0, if ѱ > ѱb. For the dormancy- and germination-based restriction model (M4), both physiological process-based restrictions were imposed; first dormancy (as in model M2), then germination restrictions (as in model M3). Temperature and moisture data were simulated using the STM2 model. For calculation, 0 C, 20 C, and 30 C were used as base, optimum, and maximum temperatures, respectively. Accumulated GDD were fit with a logistic equation.

Figure 3. Long description
Panel M1: A line graph titled ‘Standard Growing Degree Days (Hydrothermal time) Model’ shows cumulative emergence percent on the vertical axis and cumulative growing degree days on the horizontal axis. The graph includes data points with error bars and a fitted logistic curve. The adjusted R-squared value is -0.10, and the RMSE is 37.13. Panel M2: A line graph titled ‘Dormancy-Based Restriction Model’ displays cumulative emergence percent on the vertical axis and cumulative growing degree days on the horizontal axis. Data points with error bars and a fitted logistic curve are present. The adjusted R-squared value is 0.81, and the RMSE is 15.62. Panel M3: A line graph titled ‘Germination-Based Restriction Model’ shows cumulative emergence percent on the vertical axis and cumulative growing degree days on the horizontal axis. Data points with error bars and a fitted logistic curve are included. The adjusted R-squared value is 0.82, and the RMSE is 15.25. Panel M4: A line graph titled ‘Dormancy- and Germination-Based Restriction Model’ displays cumulative emergence percent on the vertical axis and cumulative growing degree days on the horizontal axis. Data points with error bars and a fitted logistic curve are present. The adjusted R-squared value is 0.90, and the RMSE is 11.46.
Incorporating daily GDD restrictions improved model performance across years for all models except the dormancy-based restriction model (Figure 2M1–M4). Validation performance was consistently better across all three restricted models, with lower RMSE and higher coefficient of determination (
 ${\rm{R}}_{{\rm{adj}}}^2$
) (Figure 3M2–M4) compared with the standard GDD model, indicating improved predictive accuracy. Notably, the combined dormancy- and germination-based restriction model substantially reduced GDD overestimation and enhanced model fit across site-years resulting in the lowest RMSE (11.46) and highest
 ${\rm{R}}_{{\rm{adj}}}^2$
(0.90) among the validation results (Figure 3M4). The germination-based and combined dormancy- and germination-based restriction models had lower
 ${\rm{R}}_{{\rm{adj}}}^2$
and higher RMSE values for validation models compared to calibration models but the opposite trend was observed for the dormancy-based restriction model, where higher
 ${\rm{R}}_{{\rm{adj}}}^2$
and lower RMSE values were observed for the validation model. Nevertheless, observed data closely followed the predicted trend lines in all three models (Figure 3M2–M4).
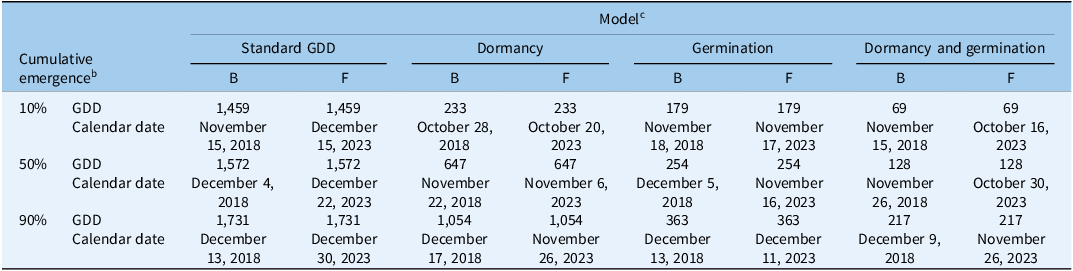
Applying restrictions to daily GDD accumulation led to more accurate prediction of G. carolinianum emergence (Table 2). For the dormancy-based restriction model, accumulation starts from mid to late September when minimum daily temperature dropped below 20 C, while for the germination-based restriction model, it began earlier in September but at a slower rate due to more constrained temperature thresholds (minimum, maximum, and optimum). As a result, the dormancy-based restriction model accumulated GDD more rapidly, potentially inflating values of cumulative percentage emergence early in season which led to unusually earlier prediction in Dover 2018 (site-year B). The combined dormancy- and germination-based restriction model accumulated GDD more slowly due to compounded restrictions. This more restrictive approach helped reduce GDD overestimation, resulting in more meaningful GDD estimates and more accurate emergence predictions.
Predicted Geranium carolinianum emergence timing in row middles for four emergence models using various growing degree-day (GDD) accounting restrictions a

Table 2. Long description
A table comparing predicted Geranium carolinianum emergence timing in row middles for four emergence models using various growing degree-day (GDD) accounting restrictions. The table has 10 rows and 12 columns. Column headers include Cumulative emergence, GDD, Calendar date, Standard GDD B, Standard GDD F, Dormancy B, Dormancy F, Germination B, Germination F, Dormancy and germination B, and Dormancy and germination F. Row labels include 10 percent, 50 percent, and 90 percent. Each row provides specific values for GDD and calendar dates for each model and restriction type. The table captures the predicted emergence timing based on different GDD accumulation models and restrictions.
a Among four emergence models, standard GDD is the empirical model, wherein hydrothermal time was used as GDD, and the other three (dormancy, germination, and dormancy and germination) are physiological process-based/reductionist models in which dormancy-based, germination-based, and both dormancy- and germination-based restrictions are imposed, respectively. These models used Florida data from Table 1.
b Here, percentage emergence benchmarks (10%, 50%, and 90%) were determined from fitted models.
c Here, B and F are site-year code representing Dover 2018 and Balm 2023, respectively.
Based on the combined dormancy- and germination-based restriction model, G. carolinianum began emerging in mid-November (November 15) in Dover 2018 (site-year B), reached 50% cumulative emergence by late November (November 26), and peaked (90%) by early December (December 9). In contrast, in Balm 2023 (site-year F), emergence began in mid-October (October 16), reached 50% by late October (October 30), and peaked by late November (November 26) (Table 2). Such variation in emergence timing is likely influenced by temperature and soil moisture. While temperature differences between years were minimal, notable differences in soil moisture were observed. Overhead irrigation is applied immediately following strawberry transplanting, and it typically lasts for 10 to 14 d, leading to high soil moisture for a limited time period (Hochmuth et al. Reference Hochmuth, Locascio, Kostewicz and Martin1993). Thereafter, rainfall becomes the primary source of moisture in the row middles, though there may be limited movement from the drip irrigation system contained within the bed. As previously reported, moisture plays a critical role in seed germination and emergence in G. carolinianum, with reduced moisture significantly limiting germination (Baskin and Baskin Reference Baskin and Baskin1974; Sharpe and Boyd Reference Sharpe and Boyd2019b).
Row Middle versus Bed Top
In contrast to row middles, cumulative emergence was accurately modeled using thermal time on bed tops, which suggests that moisture is not a limiting factor for G. carolinianum emergence on the raised beds (Figure 4M1). In Florida’s strawberry production system, beds are covered with plastic mulch and irrigated multiple times daily via drip tape to ensure moisture is never lacking throughout the growing season. This explains why hydrothermal time may not be necessary to model emergence on the bed tops in contrast with row middles, where moisture is not applied after crop establishment. Applying dormancy and germination restrictions reduced daily GDD accumulation but did not improve model performance (Figure 4M2–M4). Therefore, standard GDD models may be adequate to estimate bed-top emergence, but there was no loss of accuracy using the more complex (combined dormancy- and germination-based restriction) model to sustain methodological consistency.
Calibrations of potential models for Geranium carolinianum emergence in Florida strawberry bed tops for 2 site-years. Symbols represent the mean of replicates at each site-year. Symbols represented by the letters A and E indicate site-years Balm 2018 and Balm 2020, respectively. Error bars represent standard error of the mean. For the standard growing degree-day (GDD) model (M1), GDD were calculated by: GDD =
 ${{\rm{\theta }}_{\rm{T}}} = \mathop \sum \nolimits_{{\rm{i}} = 1}^{\rm{n}} \left( {T_{{a}} - T{_{b}}} \right)$
. For the dormancy-based restriction model (M2), restrictions include: if
 $T_{\rm{min}}$
≤ 20 C, then GDD =
 ${{\rm{\theta }}_{\rm{T}}} = \mathop \sum \nolimits_{{\rm{i}} = 1}^{\rm{n}} \left( {T{_{a}} - T{_{b}}} \right)$
; otherwise GDD = 0. For the germination-based restriction model (M3), GDD =
 ${{\rm{\theta }}_{\rm{T}}}$
, three restrictions were imposed: (1) if
 $T_{{b}}$
<
 $T_{{a}}$
<
 $T_{o}$
then
 ${{\rm{\theta }}_{\rm{T}}} = \mathop \sum \nolimits_{{\rm{i}} = 1}^{\rm{n}} \left( {T_{{a}} - T_{{b}}} \right);$
(2) if
 $T_{{o}}$
<
 $T_{{a}}$
<
 $T_{{m}}$
then
 ${\theta _{\rm{T}}} = \sum\nolimits_{{\rm{i}} = 1}^{\rm{n}} {\left( {T_{{a}} - T_{{b}}} \right)} \left( {1 - {{{{T_{a}}} - {{T_{b}}}} \over {{{T_{m}}} - {{T_{o}}}}}} \right)$
; and (3)
 ${{\rm{\theta }}_{\rm{T}}}$
= 0 otherwise. For the dormancy- and germination-based restriction model (M4), both physiological process-based restrictions were imposed; first dormancy (as in model M2), then germination restrictions (as in model M3). Temperature at 2-cm soil depth was simulated using the STM2 model. For calculation, 0 C, 20 C, and 30 C were used as base, optimum, and maximum temperatures, respectively. Accumulated GDD were fit with a logistic equation.

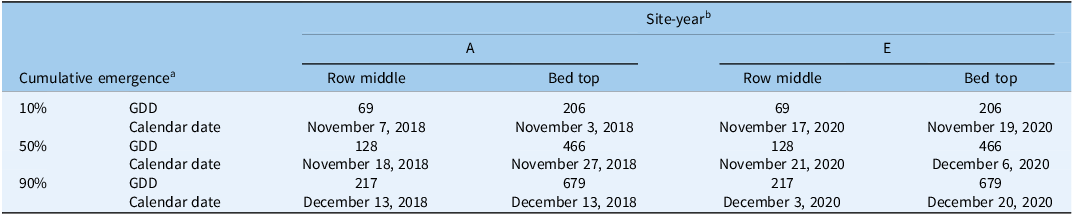
Geranium carolinianum began emerging around the same period on bed tops and row middles, typically early to mid-November (Table 3). In Balm 2018 (site-year A), cumulative emergence reached 50% approximately a week later on the bed top compared with the row middle, though both reached 90% emergence simultaneously. In contrast, in Balm 2020 (site-year E), bed-top cumulative emergence reached 50% and 90% at 2 wk later than in the row middle. While moisture is likely not a limiting factor on bed tops due to drip irrigation and plastic mulch, the interactive effect of the elevated temperature and light interception by the crop canopy may contribute to the delayed emergence. Sharpe and Boyd (Reference Sharpe and Boyd2019b) reported a negative photoblastic effect in G. carolinianum seeds from Florida even after they had been stored for extended periods. They reported maximum germination at 10 C under a dark condition, and germination declined above that temperature. This delayed emergence in bed tops is consistent with field observations, where G. carolinianum tends to appear earlier in row middles.
Geranium carolinianum emergence timing in row middles and bed tops using combined dormancy- and germination-based restriction model for 2 site-years.

Table 3. Long description
A table comparing Geranium carolinianum emergence timing in row middles and bed tops for two site-years. The table has 4 rows and 6 columns. The columns are labeled as follows: Cumulative emergence, Site-year, Row middle GDD, Row middle Calendar date, Bed top GDD, and Bed top Calendar date. The rows are labeled as follows: 10 percent, 50 percent, and 90 percent. Row 1: 10 percent, GDD, 69, November 7, 2018, 206, November 3, 2018. Row 2: 50 percent, GDD, 128, November 18, 2018, 466, November 27, 2018. Row 3: 90 percent, GDD, 217, December 13, 2018, 679, December 13, 2018. Row 4: 10 percent, GDD, 69, November 17, 2020, 206, November 19, 2020. Row 5: 50 percent, GDD, 128, November 21, 2020, 466, December 6, 2020. Row 6: 90 percent, GDD, 217, December 3, 2020, 679, December 20, 2020.
a Here percentage emergence benchmarks (10%, 50%, and 90%) were determined from fitted models.
b Here A and E are site-year code representing the Balm 2018 and Balm 2020, respectively.
No fixed calendar date can be assigned to G. carolinianum emergence, especially in row middles, where the influence of environmental factors is greater. However, emergence typically occurred between mid-October to mid-December (Tables 2 and 3). When adequate moisture was present, emergence tended to occur earlier within this period, whereas under intermittent moisture, emergence was often delayed toward the latter part of this period. Although a fluctuation in soil moisture created a broader emergence window, 50% to 90% cumulative emergence occurred by November, which is crucial from a weed management perspective, given that this facilitates clopyralid applications before the harvest period begins. This emergence period aligns with the posttransplant establishment phase of strawberry. Some preemergence herbicides applied under the plastic mulch retain activity up to this period (Boyd et al. Reference Boyd, Sharpe and Kanissery2021), but the efficacy on G. carolinianum tends to be low and the efficacy of many products declines or is inconsistent at this stage (Reed et al. Reference Reed, Boyd, Wilson, Dittmar and Sharpe2018). The emergence timing also closely aligns with that of M. lupulina, another common broadleaf weed in Florida strawberry fields (Sharpe and Boyd Reference Sharpe and Boyd2019a), allowing for timely postemergence clopyralid application targeting multiple weed species with minimal risk of violating the 7-d preharvest interval. However, crop canopy shielding could be a challenge at this stage, as weed seedlings often remain concealed within the crop canopy, potentially requiring increased spray volumes or modified nozzle orientation to achieve adequate penetration and effective control (Sharpe et al. Reference Sharpe, Boyd, Dittmar, MacDonald, Darnell and Ferrell2018b).
In summary, an emergence model for G. carolinianum was successfully developed for the subtropical conditions of Florida. Incorporating dormancy- and germination-based restrictions into daily GDD accumulation effectively reduced GDD inflation and improved model performance in row middles. However, further validation is needed for bed tops. Temperature and moisture were key environmental drivers and influenced year-to-year variation in emergence timing, which typically spans from mid-October to mid-December. This represents an optimal period for implementing postemergence control measures such as clopyralid application or hand weeding. Integrating these models into platforms such as the strawberry advisory system (https://agroclimate.org/tools/sas/dashboard/disease) could provide timely alerts to growers, offering a more systematic and practical approach to decision-making. The current model does not consider the role of light, which could influence G. carolinianum germination and may affect emergence on bed tops (Sharpe and Boyd Reference Sharpe and Boyd2019b). Also, this model does not account for the developmental stages of seeds in the soil seedbank while applying physiological process-based restrictions. Additionally, other factors relevant to Florida strawberry systems such as irrigation water temperature, effect of fumigants, and fertilizers remain unstudied and warrant further investigation.
Acknowledgments
The authors would like to acknowledge Laura Reuss and Emily Witt for their assistance with field setup and data collection.
Funding statement
This research was funded by a USDA-NIFA AFRI grant (AWD14430).
Competing interests
The authors declare no competing interests.

 θHT=∑i=1n(θTxθH)
 θT=∑i=1n(Ta−Tb)
 θH
 Tmin
 θT=∑i=1n(Ta−Tb)
 θHT=∑i=1n(θT×θH)
 Tb
 Ta
 To
 θT=∑i=1n(Ta−Tb)
 To
 Ta
 Tm
 θT=∑i=1n(Ta−Tb)(1−Ta−TbTm−To)
 θT
 θH

 θHT=∑i=1n(θT×θH)
 θT=∑i=1n(Ta−Tb),
 θH
 Tmin
 θT=∑i=1n(Ta−Tb)
 θHT=∑i=1n(θT×θH)
 Tb
 Ta
 To
 θT=∑i=1n(Ta−Tb)
 To
 Ta
 Tm,
 θT=∑i=1n(Ta−Tb)(1−Ta−TbTm−To)
 θT
 θH

 θT=∑i=1n(Ta−Tb)
 Tmin
 θT=∑i=1n(Ta−Tb)
 θT
 Tb
 Ta
 To
 θT=∑i=1n(Ta−Tb);
 To
 Ta
 Tm
 θT=∑i=1n(Ta−Tb)(1−Ta−TbTm−To)
 θT

 Open access

