Introduction
Fluid catalytic cracking (FCC) is an important petroleum refining process, which produces most of the world's gasoline and a diesel precursor fraction. The catalyst used in the process consists of microspheres 40–100 μm in diameter, generally based on an ultrastable zeolite Y and one or more components in the functional matrix (silica, alumina or amorphous silica-alumina), kaolin and a binder (Woltermann et al., Reference Woltermann, Magee, Griffith, Magee and Mitchell1993). The industrial manufacture of the FCC catalyst can be carried out by incorporation or in situ routes (Woltermann et al., Reference Woltermann, Magee, Griffith, Magee and Mitchell1993; Clough et al., Reference Clough, Pope, Tan, Lin, Komvokis, Pan and Yilmaz2017). The in situ route offers greater benefits than incorporation because the zeolite grows directly on the pre-formed matrix microspheres, avoiding the use of a binder during the preparation of the catalyst and, moreover, improving zeolite dispersion. This favours the contact of reactants with the zeolite surface.
Traditionally, improvements in the performance of the FCC catalyst have focused on zeolites, but the properties of both the zeolite and the matrix should be combined to ensure efficient performance during catalytic cracking. In particular, the zeolite should be stabilized by the FCC matrix because this matrix is an attrition-resistant material, with high tolerance of metals and which improves the cracking of bottoms or bulky molecules such as those found in heavy vacuum gas oils (Magee & Mitchell, Reference Magee and Mitchell1993). The in situ production of the FCC catalyst requires the formation of matrix composites prior to zeolite synthesis; consequently, kaolin clay has been used as a raw material to prepare microspherical composites due to its low cost and ready availability (Liu et al., Reference Liu, Zhao, Gao and Ma2007; Zhang & Xiong, Reference Zhang and Xiong2012a; Li et al., Reference Li, Li, Liu, Yue and Bao2017).
Kaolin is a clay rich in kaolinite, with minor impurities such as quartz, feldspars or micas. Kaolinite is a 1:1 layered aluminosilicate with a tetrahedral Si-sheet bonded to an octahedral aluminium (AlVI) sheet (Massiot, Reference Massiot1995; Han et al., Reference Han, Liu and Chen2016). Considering that kaolinite is the main component of kaolin, structural changes in this component will control zeolite crystallization. Depending on the thermal structural transformation of kaolin, the reactivity of this material can be modified by thermal treatment that may lead to more reactive SiO2 or tetrahedral aluminium (AlIV) species (Lee et al., Reference Lee, Kim and Moon1999; Wang et al., Reference Wang, Li and Peng2011; Liu et al., Reference Liu, Liu and Hu2015). Specifically, between 450°C and 900°C, the formation of the metakaolin phase is driven by dehydroxylation which distorts the crystalline structure by the migration of Al atoms to vacant sites in the interlayer, resulting in a change of the Al coordination from octahedral to tetrahedral (Sperinck et al., Reference Sperinck, Raiteri, Marks and Wright2011; Li et al., Reference Li, Li, Liu, Yue and Bao2017). Also, during calcination at the temperature of the exothermic reaction at ~980°C, the kaolin is transformed into an Al-Si spinel or gamma-alumina with reactive SiO2 species (Chakravorty et al., Reference Chakravorty, Ghosh and Kundu1986).
Furthermore, during thermal transformation over 500°C, the tetrahedral sheets are also disrupted, increasing the amount of soluble silica, which in solution may form polymeric species and nuclei of aluminosilicate (Madani et al., Reference Madani, Aznar, Sanz and Serratosa1990). Specifically, at temperatures of 600–800°C, the metakaolin is vulnerable to alkali attack, releasing Al(OH)4 and SiO44- species in solution (Madani et al., Reference Madani, Aznar, Sanz and Serratosa1990; Johnson & Arshad, Reference Johnson and Arshad2014). Therefore, the formation of metakaolin from kaolinite is an activation process, where the structure reaches a metastable amorphous and highly reactive phase that may transform to zeolite (Feng et al., Reference Feng, Li and Shan2009).
Thus, kaolin activation temperatures are important to determine the optimal conditions for crystallization of zeolite Y. It is also challenging to obtain the correct formulation of a thermally pre-treated kaolin mixture to be used as a microspherical matrix to manufacture of FCC catalysts in situ. This matrix should be reactive and sufficiently strong to maintain its morphology before and after the synthesis of zeolite Y.
In the 1960s, zeolite Y was implemented in the FCC process; since then, several modifications to the catalyst have been developed to improve its performance (Sadeghbeigi, Reference Sadeghbeigi2012). These improvements were based on alumina-rich matrices for nickel passivation (Salagre et al., Reference Salagre, Fierro, Medina and Sueiras1996; Feng et al., Reference Feng, Bai, Liu, Zhang, Liu, Yan, Zhang and Gao2014), vanadium traps (Lin et al., Reference Lin, Chao, Ling, Hwang and Hou1997), ion-exchange of the zeolite with rare earth metals to improve its stabilization and conversion (Sousa-Aguiar et al., Reference Sousa-Aguiar, Trigueiro and Zotin2013) and the use of additives for specific purposes (Andersson et al., Reference Andersson, Pirjamali, Järås and Boutonnet-Kizling1999; Degnan et al., Reference Degnan, Chitnis and Schipper2000). Since the 1980s, FCC processing of the resid feed has boomed, leading efforts towards improving the porosity of the FCC catalyst for the conversion of these feedstocks. This purpose has been achieved by using the ultrastable zeolite Y; however, regarding the matrix, Engelhard corporation (now acquired by BASF) introduced DMS (Distributed Matrix Structures) technology with high acceptance in refineries around the world. (Pan et al., Reference Pan, Lin, Komvokis, Spann, Clough, Yilmaz, Louise and Bashir2015; Clough et al., Reference Clough, Pope, Tan, Lin, Komvokis, Pan and Yilmaz2017). The pore architecture of matrix-DMS contains a substantial void volume and macroporous surface area designed to facilitate the diffusion of reagents and products, reduce over-cracking (short contact times) and coke selectivity.
Despite the fact that FCC is a mature process, the oil industry continuously requires specific advances and improvements for additives and catalysts according to their daily challenges in the FCC-units. Therefore, in this work, a commercial kaolin was investigated as a matrix for obtaining FCC catalysts. With this purpose, the kaolin was thermally treated at temperatures of 750, 865, 950, 980, 1000, 1030, 1050 and 1100°C. In addition, the calcined samples were reacted with a caustic solution at 97°C for 24 h to increase their specific surface areas by modifying their crystal order and structures, mediated by leaching Si and Al from kaolin to the alkaline solution. Thus, by combining thermal and chemical treatment of kaolin, materials with better textural properties and greater porosities may be obtained that can be used to produce more efficient and selective FCC catalysts with improved diffusion properties for larger hydrocarbon molecules.
Experimental
Kaolin
The kaolin (K) was obtained from Caolines de Vimianzo, Italy; its mineralogical composition is kaolinite (88.0 mass%), muscovite 2MM 1 (8.6 mass%) and quartz (3.4 mass%). The kaolinite had a low Hinckley index (0.52) determined by X-ray powder diffraction (XRD).
Calcination of kaolin
The kaolin was calcined in a Nabertherm oven at 750, 865, 980, 1000, 1030, 1050 and 1100°C for 1 h with a heating rate of 5°C/min. These samples were denoted as K-T, where T refers to the calcination temperature.
Alkaline treatment
Sodium hydroxide (NaOH, Merck) was used as alkaline reagent to prepare the K-TA samples (where A indicates alkaline treatment). The reactivity and leaching (Si, Al) of the K-T samples were measured with a 3.5 M aqueous NaOH solution (5 g per gram of calcined kaolin) refluxed at 97°C for 24 h.
Matrix preparation
An aqueous kaolin slurry, 40 mass% and a mass ratio 1:1.5:0.16 of kaolin:water:sodium silicate solution, was prepared. 8 g of sodium silicate solution (28.5 mass% SiO2, 8.5 mass% Na2O; Merck) and 75 g of deionized water were mixed with an ULTRA-TURRAX T 50 Pilot Scale disperser/homogenizer at 4000 rpm, for 5 min. Then, 50 g of the kaolin powder (25 g of raw, 7.5 g calcined and 17.5 g of alkaline treated kaolin) were added and mixed for 15 min. Matrix microspheres were obtained by spray drying with a flow of 3 mL/min and adjusting the inlet temperature to 135–140°C at an air pressure 0.59 MPa, atomization air flow of 8–10 L/min and dried air flow of 70 L/min. The microspheres obtained were sieved between 40 and 90 µm and calcined in a muffle oven at 750°C for 3 h.
In situ synthesis of NaY
In situ growth of the zeolite NaY on the matrix was carried out by hydrothermal synthesis. The reaction gel was prepared with sodium silicate solution, microspheres and seeds with a molar ratio of 1.9Na2O : 5.1SiO2 : Al2O3 : 74.1H2O. A seed solution was prepared according to the stereochemistry reported by Qiang et al. (Reference Qiang, Ying, Zhijun, Wei and Lishan2010) and was aged at 22°C for 6 h. Hydrothermal crystallization was carried out in Teflon reactors with a stainless-steel cover at 100°C for 24 h. The solid product was separated by filtration, washed thoroughly with deionized water, and dried for 12 h at 90°C.
The H-form of the sample was obtained by ion exchange using an aqueous solution at 15 mass% of NH4NO3 (≤100%; Merck) at 85°C for 1 h under stirring at 50 rpm. After the exchange step, the sample was washed and dried. The NH4-Y sample on the matrix was calcined at 600°C.
Characterization techniques
Differential scanning calorimetry and thermogravimetric (TG-DSC) analysis was conducted on a Mettler Toledo TGA/DSC 3+ instrument. The sample was placed in a platinum crucible and heated at a rate of 5°C/min from room temperature to 1100°C using N2 as a carrier gas. The mineralogy of the end products was determined by X-ray diffraction (XRD). The XRD traces were collected in a RIGAKU Smartlab SE Advance powder diffractometer, using Cu-Kα radiation operating at 50 kV and 40 mA. The kaolin samples and NaY/matrix were collected with scanning step at 0.2°2θ (5.0°2θ/min) and 0.015°2θ (1.2°2θ/min), respectively.
The textural properties of calcined and alkaline treated kaolins were determined by nitrogen adsorption at −196°C in a Micromeritics ASAP 2020 automated analyzer, after sample degassing at 350°C under vacuum. The acidity of the samples was determined by temperature-programmed desorption of ammonia (NH3-TPD) using a Micromeritics AutoChem II apparatus equipped with a thermal conductivity detector. Approximately 0.5 g of the sample was charged in the quartz tube and heated at 10°C/min to 550°C for 1 h under a He flow, before saturation with NH3 at 100°C for 30 min. The NH3-TPD profile was recorded from 100 to 550°C. The raw kaolin alone was heated to 350°C for degassing and the TPD test.
The samples were digested in a microwave oven for determination of bulk elemental composition. The solutions obtained were analyzed by inductively coupled plasma atomic emission spectroscopy (ICP-OES) using an Optima 8300 system and external standardization. The morphological analysis of the NaY/Matrix was analyzed with a QUANTA 450 a LEO 1450 VP electron microscopes equipped with OXFORD scattered energy X-ray systems operated in the high vacuum and low vacuum modes. The images were obtained using a backscattered electron detector (BSE).
Solid State Nuclear Magnetic Resonance (ssNMR) spectra of kaolin powders were collected in a Bruker Avance wide bore spectrometer operating at 9.4 T. Samples were packed in 4 mm zirconia rotors and measured by spinning at 10 kHz under Magic Angle Spinning (MAS) condition at 298 K. The 27Al-ssNMR experiments were carried out using 104.24 MHz as the resonance frequency and a modified zgig pulse program to obtain a flip angle of π/12, spectral window of 52.6 kHz (500 ppm), time domain 2626 points, acquisition time of 24.9 ms, proton decoupling during acquisition, 4096 scans and 1.0 of recovery time. For 29Si-ssNMR experiments the resonance frequency was 79.48 MHz and a zgig pulse program was used with a flip angle of π/6, spectral window of 23.8 kHz (299.6 ppm), time domain 4096 points, acquisition time 86.0 ms, proton decoupling during acquisition, 1024 scans, and 50s of recovery time.
Results and discussion
Calcined kaolin
The calcination temperatures of kaolin were chosen according to the result of TG-DSC analysis (Fig. 1). The formation of metakaolin is associated with a mass loss of 12.1 mass% between 350 and 800°C in TGA, and the endothermic band of the DSC signal centered at 507°C corresponds to the dehydroxylation of kaolinite layers (Kumar et al., Reference Kumar, Panda and Singh2013; Ptáček et al., Reference Ptáček, Frajkorová, Šoukal and Opravil2014). The transformation to Al-Si spinel or gamma-alumina phase is confirmed by the exothermic peak at 983°C for this kaolin sample (Lee et al., Reference Lee, Kim and Moon1999; Wang et al., Reference Wang, Li and Peng2011). The structural changes of kaolin after calcination were analyzed according to the XRD traces (Fig. 2). The original sample (K) exhibits a characteristic diffraction profile of poorly crystalline kaolinite (IH = 0.52) and minor quantities of muscovite and quartz (Plançon et al., Reference Plançon, Giese and Snyder1988; Du et al., Reference Du, Morris, Pushkarova and Smart2010). The broad hump observed between 15 and 35°2θ on the XRD traces indicate the loss of crystalline ordering after dehydroxylation by heating at 750°C. This hump shifts towards lower angles with increasing calcination temperature, which is due to bonds breaking between the tetrahedral sheet and octahedral sheet producing amorphous silica (Lee et al., Reference Lee, Kim and Moon1999). The Si-Al spinel phase, also referred to as γ-alumina, is formed near the exothermic event of kaolinite and appears in the XRD trace of K-980 and persists in sample K-1100 (Leonard, Reference Leonard1977; Chakravorty et al., Reference Chakravorty, Ghosh and Kundu1986; Low & McPherson, Reference Low and McPherson1988). After calcination at ~1050°C, the spinel begins its structural transformation to the inert mullite phase that provides attrition resistance to the catalyst. Mullite was detected in the XRD trace of sample K-1100 (Zheng et al., Reference Zheng, Sun, Zhang, Gao and Xu2005a; Zhang & Xiong, Reference Zhang and Xiong2012a).
TG-DSC curves of kaolin.

XRD traces of the original kaolin and the kaolin calcined at 750, 980, 1000, 1030, 1050 and 1100°C. Kln: Kaolinite, Qz: Quartz, Ms: Muscovite, T: Titanium dioxide, A: γ-Alumina or Al-Si spinel, Mu: Mullite.

The 29Si-MAS NMR spectrum of raw kaolin exhibited a resonance of 29Si at δ = −91.5 ppm, assigned as a Q3 site in silicate sheets, where each SiO4 tetrahedron shares three apices with another SiO4 unit (Fig. 3) (Mägi et al., Reference Mägi, Lippmaa, Samoson, Engelhardt and Grimmer1984). After calcination, the endothermic loss of OH groups causes a complex amorphous structure with formula Al2Si2O7 consisting of a random mixture of amorphous SiO2 and Al2O3 units that still retains a low degree of crystalline order in hexagonal sheets (Zhang & Xiong, Reference Zhang and Xiong2012a). Therefore, the 29Si-MAS NMR spectra of the calcined samples were not smoothed because of the different chemical environments of silicon as Q4 [(SiO) 4Si], Q3 [(SiO)3SiOH] species. Finally, Q2 [(SiO)2Si(OH)2] and Q1 [(SiO)Si(OH)3] sites characteristic of silicates, include Q4 units in Si (nAl) with tetrahedral aluminium (AlIV) in the second coordination sphere, where n = 0–4 (Table 1) (Man et al., Reference Man, Peltre and Barthomeuf1990; Mackenzie & Smith, Reference Mackenzie and Smith2013). Moreover, as the calcination temperature increased, an up-field shift of the maximum of 29Si NMR signal occurred, specifically with Q4 (1Al) and Q3 (2Al) species at 750°C and Q4 (0Al) at 1000°C, which is related to the formation of amorphous SiO2 as was revealed in the XRD trace of sample K-1000 (Rocha & Klinowski, Reference Rocha and Klinowski1990).
29Si-MAS NMR spectra of K and calcined kaolin at 750, 865 and 1000°C.

Signal assignment of 29Si NMR in calcined kaolin.

The 27Al-MAS NMR spectrum of the hydrated kaolin shows a resonance of 27Al at δ = 0 ppm corresponding to octahedral aluminium (AlVI) in the gibbsite-like sheets of the kaolinite and muscovite phases (Fig. 4) (Massiot, Reference Massiot1995; Mackenzie & Smith, Reference Mackenzie and Smith2013). Besides, the structural changes in the calcined kaolins were also observed in the 27Al-MAS NMR spectra (Fig. 4). In the metakaolin phase, an increase in 4- and 5-coordinated Al species was observed, where K-750 shows more AlIV compared with K-865, which might be active in the synthesis of zeolite Y. In contrast, sample K-1000 in the Al-Si spinel phase increases the proportion of AlVI.
27Al-MAS NMR spectra of K and calcined kaolin at 750, 865 and 1000°C.

Alkaline reaction
During the alkaline reaction of the samples under hydrothermal conditions, leaching of the soluble Si species and changes in the textural properties with respect to the calcined kaolins without alkaline treatment occur (Table 2). The raw kaolin did not present any significant change in textural properties after the alkaline reaction (Fig. 5). However, samples calcined at temperatures >980°C reacted with NaOH(ac) formed a mixture of amorphous SiO2-Al2O3-species with a new external surface area and a larger pore size and total pore volume (Table 2). Also, the starting kaolin had a type III isotherm characteristic of non-porous materials, which was transformed after alkaline treatment into a type VI isotherm with steps, indicating multiple pore sizes (Rouquerol et al., Reference Rouquerol, Rouquerol and S1998; Condon, Reference Condon2006). The kaolins calcined at >980°C and treated with alkali kaolins showed a substantial increase in mesopores of ~5 nm diameter (Fig. 5), which would facilitate the diffusion of bulky molecules in the FCC matrix prepared with them.
Textural properties and NH3-TPD of kaolin samples.

a V p at P/P 0 ≈ 1.0.
Nitrogen adsorption/desorption isotherms and differential pore-size distributions for the thermal (black) and alkali treatment (grey) samples.

In contrast, the metakaolin samples calcined at 750 and 865°C were reactive under alkaline reaction conditions, resulting in the successful formation of zeolite NaA (Fig. 6), Na12(Al12Si12O48)⋅nH2O, with Si/Al = 1, like kaolinite. This was also confirmed by the type I isotherm characteristic of microporous materials (Fig. 5) and the high acidity value determined by NH3-TPD (Table 2). The ammonia desorption thermograms allow identification of the distribution of the acid sites strength of the material analysed. In this manner, although the calcined kaolins have a small number of acid sites accessible to ammonia (Table 2), these sites also have very weak acidity because their maximum desorption appears at ~130°C for all samples (Fig. 7). Nevertheless, samples subjected to alkaline treatment did not show an increase in total acidity. In particular, samples K-750A and K-865A show two maxima on the TPD graph. However, although K-865A has lower total acidity, it has stronger acidic sites compared to K-750A.
XRD traces of zeolite A crystallized during alkaline treatment of K-750 and K-865.

Ammonia-TPD plots of calcined kaolins (upper) and with alkaline treatment (lower).

The kaolin serves as a support for the zeolite Y during in situ synthesis. However, being an alumino-silicate material itself, it also provides the sources required for crystallization, avoiding the use of binders for the zeolite and the matrix. Specifically, the fully calcined kaolin (≥1000°C) acts as a source of Si. The formation of the Si-Al spinel phase in kaolin K is marked by the exothermic signal at 983°C and is usually referred to as γ-Al2O3, due to its similar structure (Figs 1–2). The γ-Al2O3 phase has tetragonal symmetry with a = 0.7906 nm and c/a = 0.985, while the Si-Al spinel obtained has cubic symmetry with a = 0.7886 nm, because of the smaller ionic radius of Si4+ occupying positions of Al3+ (Sonuparlak et al., Reference Sonuparlak, Sarikaya and Aksay1987; Low & McPherson, Reference Low and McPherson1988). Due to its poor crystal order, it was difficult to determine an exact structure of the Si-Al spinel in K-1000 (Fig. 2). However, it was observed in the 29Si-NMR spectra that this sample is also rich in Q4 (0Al) silicon environments (Fig. 3), which indicates a secondary amorphous SiO2 phase after the thermal treatment of kaolin (Lee et al., Reference Lee, Kim and Moon1999). This amorphous SiO2 had been referred to as active silica for the synthesis of zeolites, but its presence in K samples calcined at temperatures above 980°C may also be associated with the hump between 20 and 25°2θ (Fig. 2). A matrix highly enriched in spinel was used by Guo et al. (Reference Guo, Yu, Chen and Chen2011) to obtain the zeolite L, because this matrix exhibits significant tolerance to heavy-metals, improving the catalyst life.
The amount of the amorphous SiO2 in calcined kaolins may be expressed by alkaline solubility using a NaOH solution (Okada et al., Reference Okada, ŌTsuka and Ossaka1986; Sonuparlak et al., Reference Sonuparlak, Sarikaya and Aksay1987; Zheng et al., Reference Zheng, Sun, Wang, Gao and Xu2005b). However, in the present study, the extraction of Si species from fully calcined samples favours the increase in the external surface area and the pore volume. This leads to a matrix rich in Al2O3, which in turn shows greater acidity (Fig. 5, Table 2). The normalized mass desorption of ammonia showed a change in the distribution of the acid strength of chemically treated kaolins (Fig. 7). For instance, the K-980A, K-1000A, K-1030A, and K-1050A samples exhibited two desorption maxima close to 170 and 270°C, indicating a 10-fold increase in weak acid sites compared to the kaolins with only thermal treatment. By contrast, the K-1100A sample showed an increase and shift of the second TPD-peak towards 340°C, indicating the presence of sites of medium acidity. These weak to medium acid sites are characteristic of amorphous SiO2-Al2O3 species, where the strongest sites are related more to a small amount of substituted aluminium in the silica network forming Brønsted acid sites, while the weakest are usually provided by Al2O3 agglomerates associated with Lewis sites or their interaction with silanol or aluminol groups (Hensen et al., Reference Hensen, Poduval, Degirmenci, Ligthart, Chen, Rigutto and Veen2012).
On the other hand, metakaolin is produced after decomposition of the kaolinite structure by a dehydroxylation reaction, which starts at ~400°C and is characterized by an amorphous structure but retains the tetrahedral sheets up to 920°C (Lee et al., Reference Lee, Kim and Moon1999). The loss of OH-groups produces a partially-disordered structure accompanied by a mass loss and vanishing reflections of kaolinite in the XRD traces (Fig. 1–2). This mainly affects the octahedral sheet, as was observed in the 27Al-NMR spectra (Fig. 4) (Massiot, Reference Massiot1995; Zheng et al., Reference Zheng, Sun, Wang, Gao and Xu2005b). After calcination, 47% of the octahedral Al was converted to AlIV in sample K-750, while, in K-865, only 25% of AlIV was obtained. Thus, K-750 was used as an Al source for the synthesis of zeolite Y because it contained most AlIV. Unlike kaolin calcined at temperatures ≥980°C, the metakaolin samples reacted to form type A zeolite when treated with alkali solution (Fig. 6). This crystallization of Linde type A zeolite from metakaolin was reported in previous studies (Heller-Kallai & Lapides, Reference Heller-Kallai and Lapides2007; Ayele et al., Reference Ayele, Pérez-Pariente, Chebude and Díaz2016; Pereira et al., Reference Pereira, Ferreira, Oliveira, Nassar, Ciuffi, Vicente, Trujillano, Rives, Gil, Korili and de Faria2018). The formation of zeolite A occurs as a product of the re-precipitation of H2SiO42- and Al(OH)4- species dissolved from the metakaolin in contact with the alkaline solution (Peng et al., Reference Peng, Vaughan and Vogrin2018). Likewise, the prominent increase in the acidity of samples K-750A and K-865A is related to the low Si/Al ratio in zeolite A; the large amounts of structural Al increases the density of acid sites in the region between 200 and 300°C in those samples, as shown in the TPD graph (Fig. 7).
In situ crystallization of NaY
The in situ synthesis of zeolite Y from kaolin has been reported using a mixture of metakaolin microspheres calcined at 700°C and/or kaolin microspheres calcined at 1000°C (Xu et al., Reference Xu, Cheng and Bao2000; Patrylak et al., Reference Patrylak, Likhnyovskyi, Vypyraylenko, Leboda and Skubiszewska-zi2001; Wei et al., Reference Wei, Liu, Li, Cao, Fan and Bao2010; Zhang & Xiong, Reference Zhang and Xiong2012a; Zheng et al., Reference Zheng, He, Ren, Yu and Zhu2015). In this work, instead of making a mixture of calcined microspheres, homogeneous particles were prepared using proportions based on the analysis of thermally and chemically treated kaolin. Thus, matrix microspheres were obtained with an aqueous slurry composed of a 50:35:15 mass percentage mixture of K, K-1000A and K-1100 samples. After spray drying, the particles were calcined to transform the hydrated kaolin fraction into metakaolin. As mentioned previously, 750°C was chosen as the calcination temperature due to greater contents of AlIV (Fig. 4), which could provide sites for the formation of zeolite Y. Even though sample K-1050A shows a greater surface area and total pore volume (Table 2), it is known that at this temperature the spinel phase begins its transformation to inert components, such as mullite and cristobalite, which would not have reactive amorphous SiO2 during in situ crystallization (Rocha & Klinowski, Reference Rocha and Klinowski1990; Zhang & Xiong, Reference Zhang and Xiong2012b; Liu et al., Reference Liu, Liu and Hu2015). Meanwhile, K-1100 was added to the matrix to provide mechanical resistance to the particle (Zheng et al., Reference Zheng, Sun, Zhang, Gao and Xu2005a).
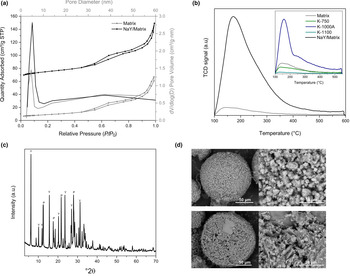
The matrix displayed a BET specific surface area of 31 m2/g and 52.2 μmolNH3/g (Table 3), although a greater specific surface area and acidity was anticipated. This might be attributed to the sodium silicate added to the slurry as a dispersant forming another dense phase with the components during spray drying. Nevertheless, during in situ hydrothermal crystallization, the active species of Si and Al present in the matrix were dissolved in alkaline pH forming a supersaturated solution on the surface of the microspheres to favor the growth of zeolite Y (Liu et al., Reference Liu, Yan, Wang and Luo2003). In this process of dissolution of the active species from the matrix, the volume of mesopores between 3 and 10 nm (Fig. 8a) increased by ~30% after synthesis of NaY (Table 3). Likewise, the NaY/matrix exhibited a type IV nitrogen adsorption-desorption isotherm with a higher hysteresis loop compared to the matrix, indicating a higher content of mesopores produced by alkaline leaching. Furthermore, the NH3-TPD curve showed the strength distribution of the acid sites on the catalyst NaY/matrix (Fig. 8b). The samples were previously ion-exchanged with NH4NO3. After in situ synthesis, the maximum desorption was shifted towards higher temperatures, ~180°C, and a shoulder at >250°C was also observed, indicating that zeolite HY had a large number of mildly acidic sites.
Textural properties of matrix and NaY/matrix.

a V p at P/P0 ≈ 1.0.
b BJH Adsorption cumulative volume of pores.
c ICP-OES.
d After ion-exchange with NH4NO3.
(a) Nitrogen adsorption/desorption isotherms and differential pore-size distributions, (b) Ammonia-TPD plot of matrix (grey) and NaY/matrix (black), (c) XRD trace and (d) SEM imagens of NaY/matrix.

The synthesis of the zeolite NaY on the matrix was confirmed by the XRD trace (Fig. 8c). Zeolite crystallinity in the samples was determined according to Zheng et al. (Reference Zheng, Sun, Wang, Gao and Xu2005b) using as 100% a reference sample prepared with kaolin microspheres calcined at 750°C (metakaolin) following the same synthesis procedure as described above. The calculated relative crystallinity for the NaY zeolite/matrix was 98.6% (Zheng et al., Reference Zheng, Sun, Wang, Gao and Xu2005b). Zeolite P was also identified as a secondary and undesired phase during in situ synthesis, which can be attributed to the fact that pure reagents and structure-directing agents are not used in this mode of synthesis (Lutz, Reference Lutz2014; Garcia et al., Reference Garcia, Cabrera, Hedlund and Mouzon2018). According to the quantitative analysis of the X-ray diffraction profile of NaY/matrix, 69.0% of zeolite Y (PDF: 01-084-9686) and 21.3% of zeolite P (PDF: 01-080-0699) were obtained. In addition, SEM images of NaY/matrix support the XRD results (Fig. 8d). In these micrographs, pseudo-cubic zeolite crystallites are completely dispersed over and inside the surface of the matrix microspheres; interparticle voids between 120 nm to 3 μm were also observed. The arrangement of the zeolite, porosity properties and voids provide an improved performance for the catalyst as these morphological properties would reduce the occlusion of active sites and would favour the diffusivity of reagents and products.
Conclusions
The calcination of kaolin at 750°C provides a better active source of AlIV for the growth of zeolite Y than does metakaolin obtained at 865°C. Kaolin calcined at temperatures above the exothermic point and treated with alkali increase the mesoporosity to sizes of 3–10 nm. The mixture of these properties of the calcined and modified kaolins was used to manufacture an active FCC matrix, and a well-crystallized zeolite NaY was synthesized.
This methodology for the preparation of cracking catalysts should be implemented to improve the diffusion of heavy feedstocks due to the system of mesopores and cavities with pore openings from 120 nm to 3 μm. In addition, a good dispersion of the zeolite on the surface of microspheres was obtained, which would favour the accessibility of the reactant molecules to active sites.
Financial support
The authors are grateful to Vicerrectoria de Investigación of Universidad Industrial de Santander (Colombia) and for the financial support of Colciencias-Ecopetrol Contract number 403-2013, Mining and Energy Program.