


1. Introduction
Biologists have long debated whether the history of life exhibits any general tendency toward increasing complexity (Lynch, Reference Lynch2007; McShea & Brandon, Reference McShea and Brandon2010; Niklas et al., Reference Niklas, Owens and Wayne2025; Veit et al., Reference Veit, Gascoigne and Salguero-Gómez2025) because the coexistence of elaboration and simplification across lineages makes it difficult to determine whether evolution is directionless, constrained, or biased (Gould, Reference Gould1996; Maynard Smith & Szathmary, Reference Maynard Smith and Szathmary1997). The difficulty emerges because of two major obstacles. The first is how complexity is measured (e.g., genome size or morphological differentiation) because each method captures only a portion of the phenomenon (Adami et al., Reference Adami, Ofria and Collier2000; Bell & Mooers, Reference Bell and Mooers1997; Kauffman, Reference Kauffman1993; Zitnik et al., Reference Zitnik, Li, Wells, Glass, Gyse, Krishnan, Murali, Radivojac and Roy2024). Consequently, disagreements become inevitable (Lynch, Reference Lynch2007; McShea, Reference McShea1991). The second obstacle involves causality. Natural selection does not generate heritable novelties (Futuyma, Reference Futuyma2013; Gabora & Steel, Reference Gabora and Steel2021; Mayr, Reference Mayr1963). Rather, selection winnows among existing possibilities. If selection is conservative and mutation opportunistic, why should complexity display any historical trend?
One approach to dealing with these difficulties is focusing on the concept of organized complexity (Simon, Reference Simon1962; Weaver, Reference Weaver1948), wherein functionality arises from the interconnectivity among system parts. Once incorporated into a functional network, new parts or new interconnectivities become more interdependent with pre-existing parts and interconnections, and the loss of any previous part or connection becomes increasingly more difficult because it disrupts historically deeper functional interconnectivities. Using results of a seminal study of in silico simulated evolution, Liard et al. (Reference Liard, Parsons, Rouzaud-Cornabas and Beslon2020) described a related phenomenon called the ‘complexity ratchet’, in which complexity accrues and resists reversal. Herein we explore the perspective of a reversible ratchet acting on the interconnections among a system’s parts using data drawn from extant and fossil plants and animals to explore whether complexity – defined by the interconnectivities established among parts – has a propensity to ratchet uphill, but not without exception.
By defining complexity based on a system’s interconnectivity, a system may gain or lose parts yet experience an increase in the indispensability of interactions among them (Koonin, Reference Koonin2011; Wilkins, Reference Wilkins2011). Although a ratchet is inherently directional, its directionality is not fixed. The direction that the ratchet is locked into is set by the prevailing regime of functional demand, such that the asymmetry acquiring entrenched gains can be reversed when the regime changes. Simplification or reallocation of function may occur at the multicellular or intracellular level when conditions provide for previous dependencies (e.g., the regressive evolution of Sacculina in the crustacean subclass Cirripedia and the apicoplast in Plasmodium falciparum, respectively), or when an organism’s phenotypic plasticity tolerates reduction (Bennett et al., Reference Bennett, Kwak and Maynard2024; Lalejini et al., Reference Lalejini, Ferguson, Grant and Ofria2021). This last case – plasticity as an alternative to strict genetic maintenance of function – will receive attention later because it identifies an additional upstream mechanism by which the ratchet’s asymmetry can be established (Müller & Newman, Reference Müller, Newman, Bock and Cardew1999; Palmer, Reference Palmer2004; West-Eberhard, Reference West-Eberhard2003).
If the ratchet perspective is valid, several predictions logically follow: (1) descendants should exhibit deeper interconnectivities compared to their ancestors, (2) previously evolved traits should resist elimination because their functions have been integrated across multiple levels, (3) reductions will appear in environments that relax or externalize prior functional demands, and (4) increases in complexity require the successful integration of novelty. These predictions resonate with well-reasoned debates about historical contingency, developmental constraint, and evolutionary ‘tinkering’ (e.g., Gould & Lewontin, Reference Gould and Lewontin1979; Jacob, Reference Jacob1977; Kirschner & Gerhart, Reference Kirschner and Gerhart2005). What has been lacking is a framework linking definition, mechanism, and macroevolutionary expectation in an explicitly falsifiable structure. The following attempts to provide that framework.
2. What is organized complexity?
Complexity has accumulated a spectrum of meanings across disciplines (e.g., Anderson, Reference Anderson1972; Lloyd, Reference Lloyd2001; Newman, Reference Newman and Hooker2011; Wolf et al., Reference Wolf, Katsnelson and Koonin2018). In biology, it has been equated with genome size, morphological differentiation, number of cell types, or information content (Bell & Mooers, Reference Bell and Mooers1997; Kauffman, Reference Kauffman1993; Koonin, Reference Koonin2011), yet always in terms of organized complexity (Weaver, Reference Weaver1948). Contrasted with disorganized complexity, wherein the interactions among a system’s parts are effectively random, and the system properties depend on the number and characteristics of the parts (e.g., an ideal gas), organized complexity arises when non-random interactions among different parts generate system-level properties that are more directly related to the connections and interdependencies among parts than to the number of parts.
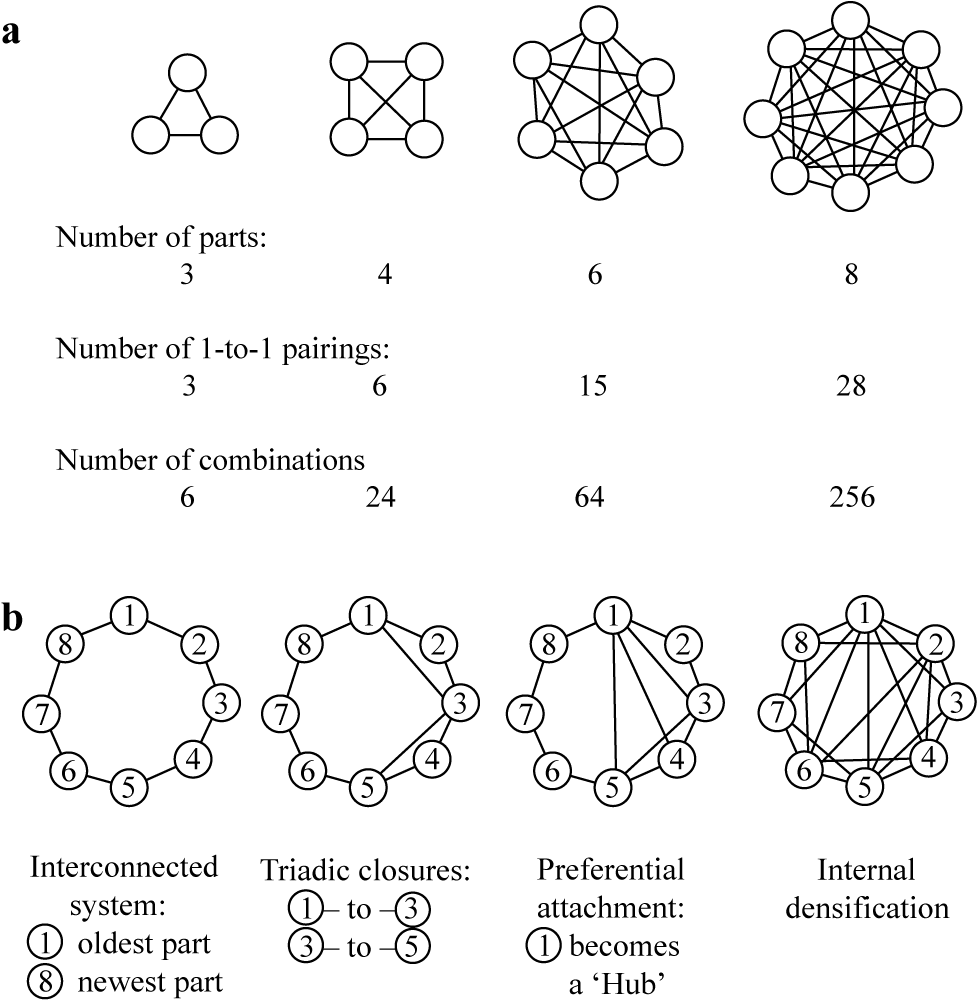
Three aspects of organized complexity are central: (1) systems differ in the number of their different parts, such that diversity of parts increases the potential repertoire of interactions (Anderson, Reference Anderson1972; Barabási & Albert, Reference Barabási and Albert1999), (2) systems differ in the number of the interconnections among parts even if the systems have the same number of parts, and (3) the number of potential combinations increases dramatically as part number increases (Figure 1a). In the biological hierarchy, interconnections include regulatory feedback, signalling, mechanical and metabolic couplings, and regulatory checkpoints (Barabási & Oltvai, Reference Barabási and Oltvai2004; Davidson, Reference Davidson2006).
(a) Schematic illustrating the interrelationships among the number of parts (shown as circles), the number of possible one-to-one parings (shown as lines), and the number of combinations that are possible in a system (i.e., combinations are used in this example because signal-transduction systems are order-specific). Although not all pairings or combinations may be achievable or functional in a particular system, the opportunity of achieving either increases dramatically as a new part is added. (b) Schematic illustrating how a system consisting of a fixed number of parts (n = 8) differing in the order of their addition to a system (e.g., 1 = oldest part, 8 = newest part) can achieve increased interconnectivity by virtue of (from left-to-right) triadic closure (i.e., a connection between second nearest neighbours), and preferential attachment (i.e., new connections preferentially added to oldest parts), obtaining ‘system densification’ in a fixed-number network.

Figure 1. Long description
Panel A consists of four network diagrams increasing in size from left to right.
* The first network has 3 parts, 3 one-to-one pairings, and 6 combinations.
* The second has 4 parts, 6 pairings, and 24 combinations.
* The third has 6 parts, 15 pairings, and 64 combinations.
* The fourth has 8 parts, 28 pairings, and 256 combinations.
Panel B illustrates a fixed-number network of 8 parts arranged in a circle, numbered 1 through 8, where 1 is the oldest part and 8 is the newest.
* The first diagram, Interconnected system, shows a simple ring connection between adjacent numbers.
* The second diagram, Triadic closures, adds internal lines connecting 1 to 3 and 3 to 5.
* The third diagram, Preferential attachment, shows part 1 becoming a hub with multiple lines radiating to parts 3, 4, and 5.
* The fourth diagram, Internal densification, shows a highly complex web of internal connections between almost all numbered parts within the fixed circular boundary.
Mathematical models show that the degree of interconnectivity can increase in networks without the addition of new parts (a phenomenon called ‘system densification’). In the foundational Barabási and Albert (Reference Barabási and Albert1999) model, system densification can occur by means of triadic closure wherein new connections are established between nearest neighbouring parts (i.e., ‘the friend of my friend is my friend’ phenomenology), or the preferential addition of new connections to the oldest parts of a system (i.e., ‘the rich get richer’ phenomenology) (Figure 1b). These mechanisms have biological analogues, e.g., preferential attachment in protein network evolution can explain how some proteins gain interactions over time, leading to ‘multi-interface hub’ proteins (see Sun & Kim, Reference Sun and Kim2011).
Likewise, by definition, interconnectivity is immediately reduced by the removal of a part. However, the long-term effect of part reduction depends on how the remaining system responds straightaway and over time. Genetic, structural, or metabolic pathway redundancy can provide distributed robustness mechanisms and immediate homeostatic resilience against the loss of parts or connections. They also have the potential to evoke novelties as a ‘side-effect’ (see Müller & Newman, Reference Müller, Newman, Bock and Cardew1999) such that reduction may inspire significant, potentially adaptive, phenotypic changes over the course of evolutionary history. Consequently, a continuum of responses to part reduction exists. Parasitism is an example. Some taxa exhibit specialized behaviours that enhance their ability to exploit different hosts. Others have simplified life cycles, reducing their ability to fit into specific ecological niches. Another example is floral evolution. In ancient lineages, the ancestral condition involves numerous floral parts, whereas in some later divergent members of the same lineage, part reduction occurs and is associated with specialization (and pollinator specificity). Importantly, architectural ‘streamlining’ can increase functional interdependence. Consequently, a physically reduced system (e.g., a parasite or orchid) can evolve additional interconnections with its environment (e.g., a host, or pollinator) provided it offers required resources, a phenomenon we call ‘environmental buffering’. In summary, part reduction is not evidence for the absence of increased interconnective complexity (e.g., genome reduction in prokaryotes promotes protein multifunctionality; see Kelkar & Ochman, Reference Kelkar and Ochman2013).
A key feature of interconnectivity is emergent behavior, which becomes understandable only when all interactions among constituent parts are considered collectively (Anderson, Reference Anderson1972). Emergence does not imply unfathomable mystery but rather the insufficiency of extreme reductionism, i.e., complexity must be understood in terms of the functional topology of a system’s parts (Gabora & Steel, Reference Gabora and Steel2021). An important distinction herein exists between repetition and redundancy (Barabási & Albert, Reference Barabási and Albert1999). Repetition, defined as ‘multiple identical parts functioning simultaneously’, adds to part number without necessarily increasing complexity as defined here. Redundancy, defined as ‘reserve connectivity’ (Ayyub, Reference Ayyub2021; Edelman & Gally, Reference Edelman and Gally2001; Tononi et al., Reference Tononi, Sporns and Edelman1999) holds function in abeyance, creating an additional layer of dependency that is itself subject to the ratchet (Edelman & Gally, Reference Edelman and Gally2001; Wagner, Reference Wagner2005). Repetitive and redundant components can take on new functions (e.g., functional divergence of duplicated genes, invertebrate metamers, and tracheophyte phytomers), thereby converting reserve into indispensable connectivity, moving the ratchet forward.
This formulation emphasizes that complexity is a historical but reversible construct. New parts or interconnections enter pre-existing networks, modify them, and are themselves modified in turn. Over time, interdependencies become more functionally distributed such that any redistribution is potentially hazardous. Perturbations propagate, removal becomes increasingly costly in proportion to ‘historical depth’, and reversibility becomes globally constrained, albeit not impossible.
3. The origin of novelty, the role of selection, and the ratchet’s neutrality
As defined here, an increase in complexity requires two conceptually distinct operations: (1) the production of novelty (Carscadden et al., Reference Carscadden, Emery, Batstone and Hauser2023; Erwin, Reference Erwin2026; Müller & Wagner, Reference Müller and Wagner1991), and (2) the differential retention of variants inheriting it (Nei, Reference Nei2013). Novelty originates through heritable change, whereas its retention depends on selection. If most mutations are neutral or deleterious and only a minority prove advantageous (Kimura, Reference Kimura1983; Lynch, Reference Lynch2007), selection is inherently conservative and rewards performance only relative to prevailing conditions.
Consequently, the reversible ratchet’s mechanism must be articulated with care because of potential confusion. Any claim that selection is dispensable as the ratchet’s driver is correct but only in a limited sense. Random genetic drift alone can accumulate interconnections when neutral additional connections occur more readily than losses of historically deeper integrated connections. However, a more general biologically important version explicitly evokes selection because two distinct, complementary pathways generate the asymmetry. The first is purely neutral. However, the appearance of neutrality is not evidence for the lack of selection. When a novelty becomes embedded in a network of interactions, the mutational target for its loss expands while the fitness consequence of complete loss may now be deleterious rather than neutral. Random genetic drift can therefore accumulate interconnections because what was once a neutral gain has become a non-neutral loss, favouring the accumulation of gains. This pathway is closest in spirit to constructive neutral evolution (Stoltzfus, Reference Stoltzfus1999) and operates even in the absence of any directional selection. The second pathway is explicitly selective. As a connection participates in more downstream processes, the average fitness cost of its removal grows because more functions are simultaneously disrupted, i.e., selection against loss strengthens with integration depth. Both pathways predict the same asymmetry – tolerated gains, resisted losses – and the relative contribution of each is expected to depend on effective population size and on the depth of integration achieved (Koonin, Reference Koonin2011; Lynch, Reference Lynch2007). This framing is consistent with Liard et al. (Reference Liard, Parsons, Rouzaud-Cornabas and Beslon2020) who report that selection is not the adaptive driver of their ratchet yet remains necessary for its operation, thereby clarifying why selection is an important amplifier in real populations of organisms.
As a novelty becomes systemically integrated, the probability that its loss will be tolerated by selection declines not because of any inherent directionality in selection, but because the number of processes dependent upon it has increased. The ratchet therefore operates primarily through an asymmetry, i.e., the toleration of gains exceeds the tolerance of losses, and this difference widens as integration deepens over time. This is a central claim – selection increasingly resists a decrease in complexity once a connection is achieved and becomes subsequently strengthened as more connections are made. The claim evokes a specific, falsifiable prediction, i.e., the probability of losing a connection should correlate with its historical appearance in a network, not merely with its current functional importance taken in isolation.
The path from the origin of a novelty to its incorporation into a larger network is not necessarily direct. New features typically pass through periods of partial functionality, redundancy, or co-option (Futuyma, Reference Futuyma2013; Mayr, Reference Mayr1963). What may begin as optional may become obligatory, accumulating historical contingencies. Because new features may participate in numerous adaptive dependencies, their elimination can carry substantial cost. As the integration of something new deepens, the probability that its loss will be tolerated declines, provided a change in the environment does not favour the loss.
This pathway to integration also provides a window of reversibility. Immediately after acquisition, a new connection has few downstream dependencies, so its cost of loss is low, and its loss incurs little penalty – the ratchet has not yet ‘clicked’. Directionality is therefore not a property of a connection at its origin but an emergent consequence of the integration depth it subsequently attains. The prediction that follows is specific: the probability that a feature is lost should decline as a function of its accumulated connectance, so that recently acquired, weakly embedded features are lost far more readily than ancient, deeply embedded ones. The ratchet will stop when new parts are no longer added, and all system connections become saturated.
4. Integration, dependency, and the cost of reversal
The successful addition of a new part or connection requires only that it function sufficiently well within a pre-existing architecture, thereby avoiding immediate rejection. In contrast, the removal of a part and its integrated connectivity may degrade multiple aspects of performance simultaneously. Even if the original function is no longer essential, higher-order roles may have evolved. Reduction therefore demands not merely subtraction but compensation. Networks can be remodelled incrementally, but large-scale removal without reorganization is expected to be rare, and simplification is typically indirect, involving the reorganization of tasks before loss can occur (Frank, Reference Frank1994; Koonin, Reference Koonin2011).
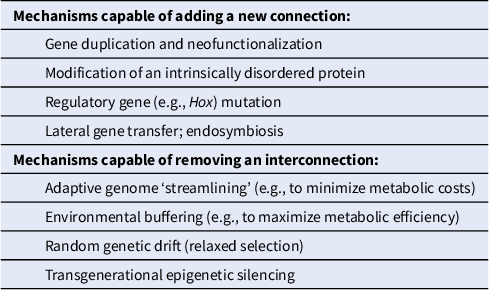
This perspective can explain why evolutionary reductions are often associated with environmental buffering (Erwin, Reference Erwin2026; Wagner & Zhang, Reference Wagner and Zhang2011), although a variety of other mechanisms are capable of removing as well as adding new connections (Table 1). When external conditions reliably replace functional obligations – as in the dependency of a parasite on its host – the costs of maintaining formerly essential components are relaxed, and those components may be shed. The persistence of apparently vestigial features long after their initial advantages have faded (Doolittle, Reference Doolittle1999; Gould, Reference Gould2002) reflects entanglement within a system whose coherence depends on them. What appears vestigial in isolation may remain necessary in context, albeit indirectly.
Examples of mechanisms capable of adding or deleting interconnections

Table 1. Long description
The table is divided into two sections.
Mechanisms capable of adding a new connection:
* Gene duplication and neofunctionalization.
* Modification of an intrinsically disordered protein.
* Regulatory gene, for example H o x, mutation.
* Lateral gene transfer or endosymbiosis.
Mechanisms capable of removing an interconnection:
* Adaptive genome streamlining, for example to minimize metabolic costs.
* Environmental buffering, for example to maximize metabolic efficiency.
* Random genetic drift, or relaxed selection.
* Transgenerational epigenetic silencing.
5. The ratchet’s relation to five other conceptual frameworks
Interconnectivity’s reversible ratchet shares intellectual territory with five influential prior accounts, and a clear accounting of its similarities and differences is necessary.
First, McShea and Brandon’s (Reference McShea and Brandon2010) Zero Force Evolutionary Law (ZFEL) proposes that, in the absence of selection and other forces, both diversity and complexity will tend to increase spontaneously, i.e., heritable variation accumulates, and differentiation will drift upward in the absence of homogenizing forces. The ZFEL is a valuable null model establishing what should be expected without directional selection. Our framework differs from the ZFEL in three important respects. First, the ZFEL treats increases in complexity as a passive tendency arising from variation accumulation in the absence of constraint. The ratchet framework identifies an active asymmetry, i.e., gains require only toleration, whereas losses must overcome the inertia of accumulated dependency. Second, the ZFEL applies equally to differentiation among parts and among individuals in a population. The ratchet framework is specifically concerned with the integration of parts within individual organisms and the historical deepening of those integrations. Third, the ZFEL does not generate predictions about the topology of interdependency or about when simplification should occur. The ratchet framework does. The two accounts are therefore complementary. The ZFEL describes a baseline tendency. The ratchet explains why integration, once achieved, becomes stabilized.
Second, the major transitions framework (Maynard Smith & Szathmary, Reference Maynard Smith and Szathmary1997) identifies pivotal events in which selection shifted to a higher level of organization. Each transition involves a previously independent unit becoming obligately integrated into a higher level of individuality. Each major transition, as interpreted by Maynard Smith and Szathmary, is an especially dramatic ratcheting event in which formerly independent entities became so deeply interconnected that reversion to independence is effectively foreclosed. However, the major transitions framework focuses on discrete historical events, whereas the ratchet framework identifies a process operating at all scales across evolution’s indivisible timeline. By grounding the ratchet in measurable properties – connectance, proteome size, interactome topology – the framework extends beyond landmark transitions to the quantification of integration depth.
Third, Stoltzfus (Reference Stoltzfus1999); see also Muñoz-Gómez et al., Reference Muñoz-Gómez, Bilolikar, Wideman and Geiler-Samerotte2021; Brunet, Reference Brunet2022) introduced the concept of constructive neutral evolution (CNE), which explains how biological complexity can increase through drift rather than adaptive selection. CNE’s key mechanism is ‘presuppression, i.e., a pre-existing, initially neutral interaction or capacity conferring no immediate fitness benefit can mask the effects of a subsequent deleterious mutation. Because the presuppressor already exists, the potentially deleterious mutation can drift to fixation instead of being eliminated by selection. The system now depends on the presuppressor to function, creating a new structural or functional relationship that can increase complexity subsequently; i.e., presuppression acts as a safety net that exists before it is needed, giving a genome time to either purge or integrate new mutations, some of which expand complexity by locking in dependencies that were originally incidental. Interconnectivity’s ratchet differs from CNE because gains and losses do not require presuppression. It is also important to say that CNE can be conflated with the concept of exaptation (Gould & Vrba, Reference Gould and Vrba1982) in which an old trait is recruited for a new function. However, presuppression differs from exaptation because it requires an ante factum mechanism, whereas exaptation employs a post factum logic.
Fourth, Wimsatt’s (Reference Wimsatt and Bechtel1986, Reference Wimsatt2007) concept of generative entrenchment is a close philosophical antecedent to the ratchet framework. Generative entrenchment holds that features acquired earlier in development, or earlier in a network’s history, accrue more downstream dependents and therefore become increasingly difficult to modify or replace without disrupting later-acting processes. The ratchet framework is consistent with this core intuition but differs in two respects. First, generative entrenchment is most often articulated as a developmental phenomenon, whereas interconnectivity’s ratchet is explicitly hierarchical, applying equally to molecular interactomes, cell-type networks, organismic anatomy, and ecological associations. Second, Wimsatt’s account emphasizes the temporal asymmetry of developmental cascades, whereas the ratchet emphasizes the topological asymmetry of network connectance, regardless of when in development a feature acts. Generative entrenchment can be read as a special case of the ratchet operating on the developmental subset of biological networks.
Fifth, the ratchet’s framework is also confluent with the phenotype-first tradition (Müller & Newman, Reference Müller, Newman, Bock and Cardew1999; Palmer, Reference Palmer2004; West-Eberhard, Reference West-Eberhard2003), i.e., phenotypic novelties can arise as plastic or epigenetic responses to environmental or developmental perturbation and only subsequently become genetically assimilated when selection favours their reliable reproduction. According to this tradition, the initial causal event in a novel character’s history is a phenotypic expression whose genetic underpinning is variable or absent. The character’s transition from an opportunistic plastic response to a fixed genetic propensity is the historically important step, rather than the appearance of the character itself. This perspective resonates with the ratchet framework because it identifies an upstream mechanism, distinct from the drift and selection mechanisms discussed above, by which a new component can enter a functional network. A component that is initially plastic and only later genetically assimilated will not leave the same signature in the molecular record as a component that arose by mutation and drifted to fixation, and the two will differ in the tempo of their integration into the surrounding network. The ratchet framework accommodates both. What the ratchet requires for its operation is that the new part or connection, however it arrived, stabilizes in the individuals whose functional dependencies deepen around it. Whether the novelty arrived as a mutation that spread by drift, as a selected response to a functional demand, or as a plastic phenotype that was subsequently genetically assimilated is upstream of the interconnectivity dynamics the ratchet concerns. The phenotype-first tradition and the ratchet framework are therefore complementary. The former specifies a class of upstream mechanisms by which components enter networks; the latter specifies the network-level consequences of their entry. One notable prediction that follows from combining them is that plastic-then-assimilated components should show a characteristic signature of decreasing developmental variance across a phylogenetic sequence, and this signature should be detectable in comparative developmental data even where the fossil record does not preserve it.
Clearly, the ratchet framework intersects with a substantial body of work on modularity, robustness, and the evolution of evolvability (Wagner, Reference Wagner2005; Wagner, Reference Wagner2014; Wagner & Altenberg, Reference Wagner and Altenberg1996). For example, Wagner and Altenberg (Reference Wagner and Altenberg1996) argue that modular genotype–phenotype maps facilitate the accumulation of complex adaptations because changes in one module are partially insulated from others. Modularity and interconnectivity are sometimes treated as opposing tendencies, but in our framework, they are complementary aspects of organized complexity. Modularity describes how connections cluster; interconnectivity’s ratchet describes how clustered connections become entrenched. Wagner’s (Reference Wagner2005) analysis of robustness through redundant network architecture is similarly compatible, i.e., redundancy provides the ‘reserve connectivity’ that the ratchet can subsequently lock into place once duplicates diverge in function (Edelman & Gally, Reference Edelman and Gally2001). The ratchet framework therefore does not displace modularity (or robustness-based accounts) but rather identifies an historical mechanism by which their products accumulate.
In summary, interconnectivity’s ratchet (1) accepts the ZFEL’s baseline passive tendency, (2) identifies the mechanism by which integration creates a selective asymmetry that amplifies this tendency, (3) generalizes the major transitions’ insight about obligate integration into a continuous measurable process, (4) extends CNE’s presuppression mechanism from the molecular to all hierarchical levels, and (5) avoids the adaptation post factum logic required by exaptation, (6) generalizes Wimsatt’s generative entrenchment from developmental cascades to networks at all hierarchical levels, (7) accommodates the phenotype-first tradition’s identification of plasticity and genetic assimilation as an upstream mechanism through which components enter networks, and (8) reinterprets modularity and robustness as the structural substrates upon which the ratchet operates.
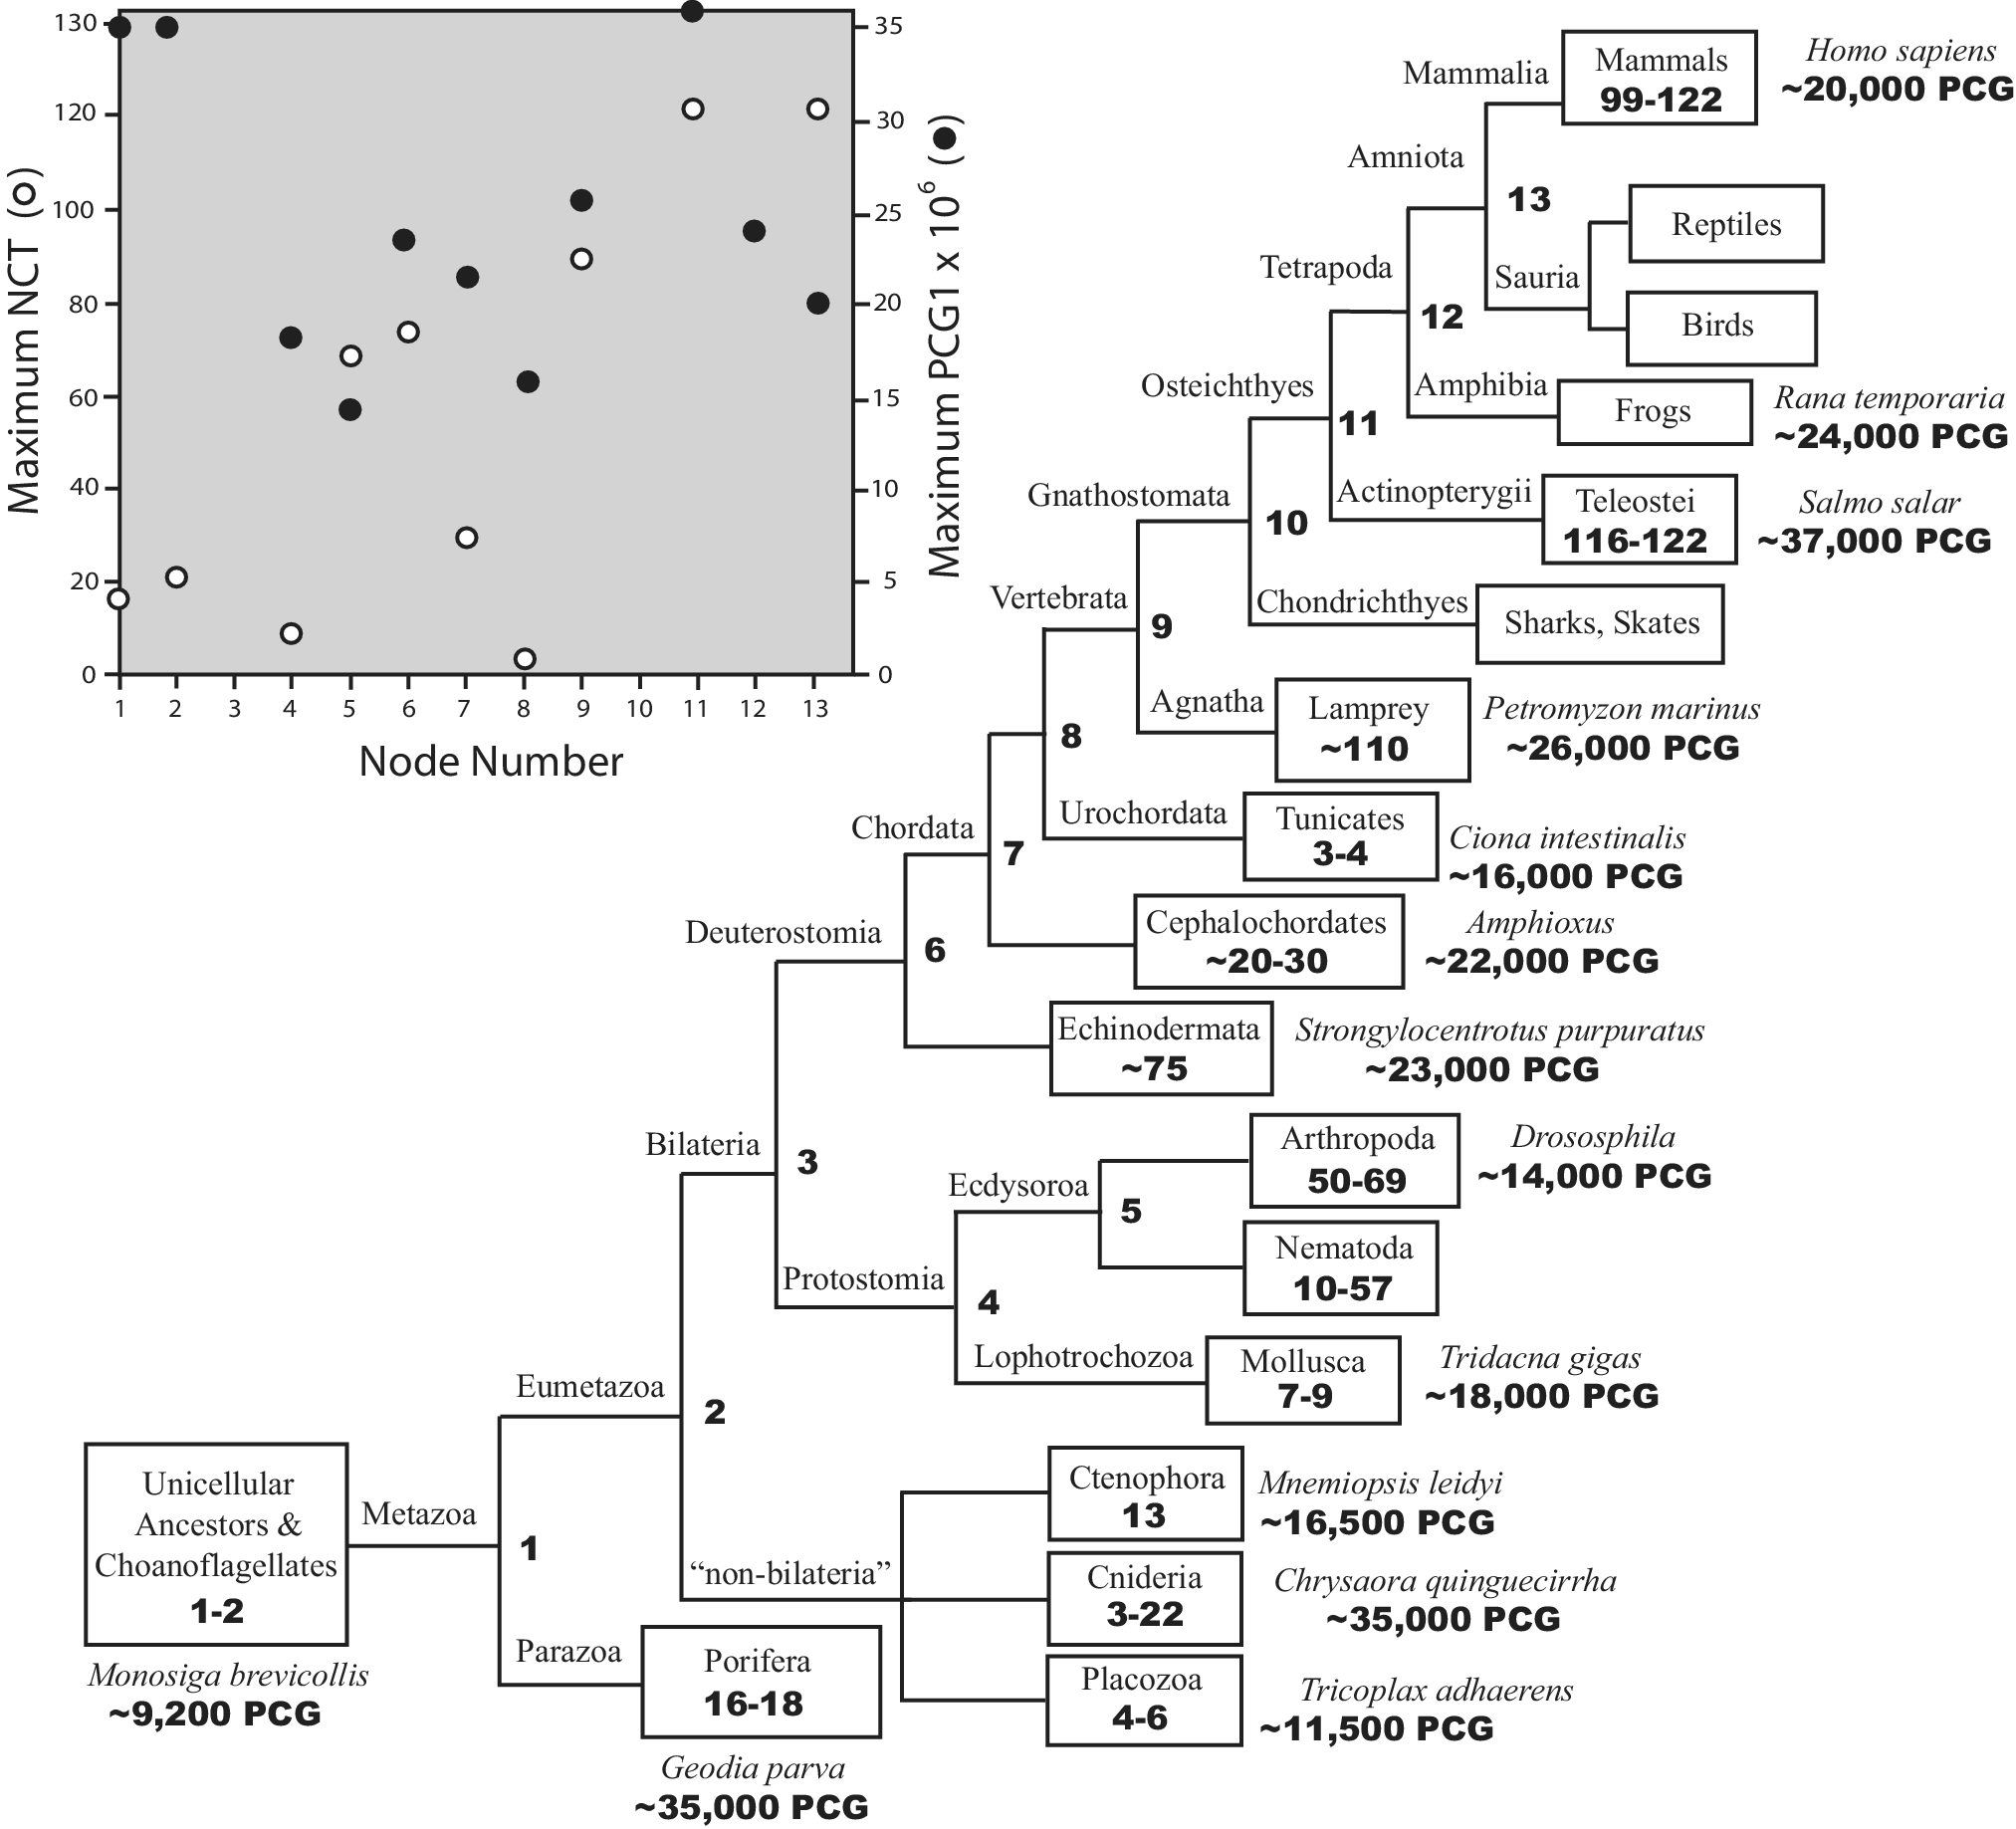
Estimates of the number of different cell types (NCT, shown in boxes) and the number of protein-coding genes (PCG) reported for representative species of different lineages plotted on a redacted phylogeny of the Metazoa. The NCT and PCG of some lineages are not shown because the data are either unavailable or contentious. For convenience of inspection, the insert (upper left) plots maximal NCT and PCG values as a function of the node number in the cladogram (node 1 = oldest). Maximal values are used for unresolved polytomies. Data for NCT from Bell and Mooers (Reference Bell and Mooers1997) and the authors’ assessments of the primary literature; data and references for PCG provided in Supplementary Table S1.

Figure 2. Long description
The inset scatter plot in the upper left features a horizontal X-axis labeled Node Number (1 to 13). The left Y-axis is Maximum N C T (open circles) ranging from 0 to 130. The right Y-axis is Maximum P C G 1 times 10 super 6 (solid circles) ranging from 0 to 35. Data points show a general upward trend for both variables as node number increases.
The main phylogenetic tree begins at the bottom-left with Node 1 (Metazoa), branching from Unicellular Ancestors and Choanoflagellates (N C T 1-2, Monosiga brevicollis ~9,200 P C G).
Moving right, the tree splits into Parazoa (Porifera, N C T 16-18, Geodia parva ~35,000 P C G) and Eumetazoa (Node 2).
Eumetazoa splits into non-bilateria and Bilateria (Node 3). Non-bilateria includes Placozoa (N C T 4-6, ~11,500 P C G), Cnidaria (N C T 3-22, ~35,000 P C G), and Ctenophora (N C T 13, ~16,500 P C G).
Bilateria branches into Protostomia (Node 4) and Deuterostomia (Node 6). Protostomia includes Lophotrochozoa (Mollusca, N C T 7-9, ~18,000 P C G) and Ecdysozoa (Node 5), which contains Nematoda (N C T 10-57) and Arthropoda (N C T 50-69, Drosophila ~14,000 P C G).
Deuterostomia (Node 6) leads to Echinodermata (N C T ~75, ~23,000 P C G) and Chordata (Node 7). Chordata branches through Urochordata (Tunicates, N C T 3-4, ~16,000 P C G) and Cephalochordates (N C T ~20-30, ~22,000 P C G) to Vertebrata (Node 9).
Vertebrata branches through Agnatha (Lamprey, N C T ~110, ~26,000 P C G) to Gnathostomata (Node 10). This lineage continues through Osteichthyes (Node 11), splitting into Actinopterygii (Teleostei, N C T 116-122, ~37,000 P C G) and Tetrapoda (Node 12).
Tetrapoda branches into Amphibia (Frogs, ~24,000 P C G) and Amniota (Node 13). Amniota splits into Sauria (Reptiles and Birds) and Mammalia (Mammals, N C T 99-122, Homo sapiens ~20,000 P C G).
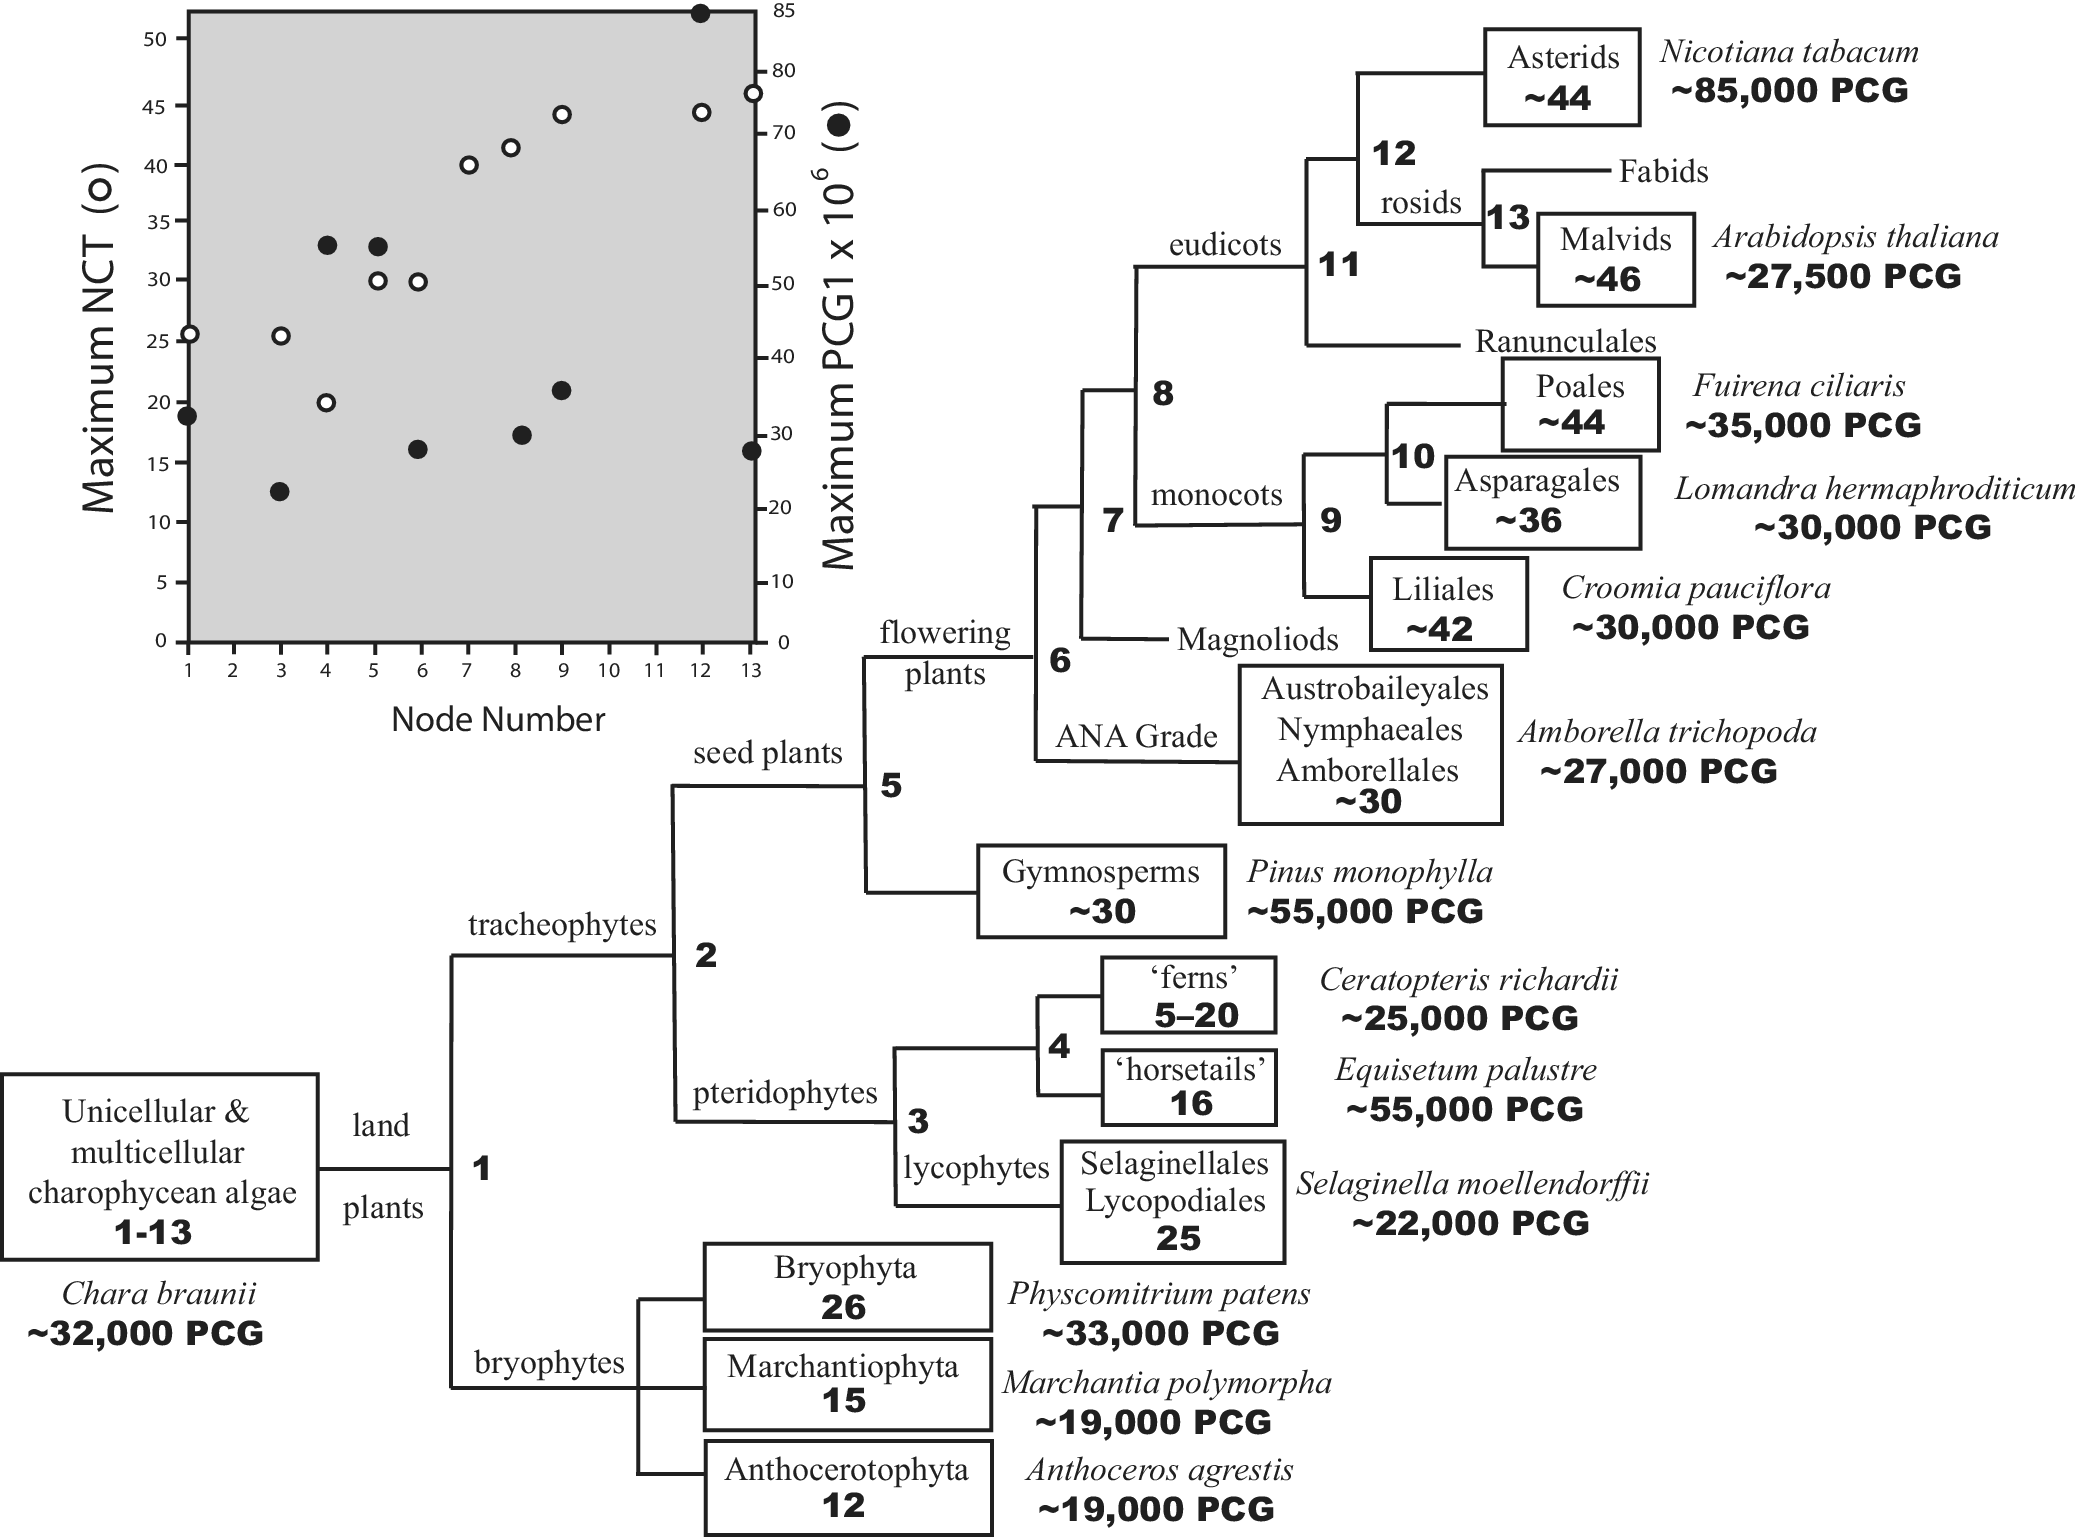
Estimates of the number of different cell types (NCT, shown in boxes) and the number of protein-coding genes (PCG) reported for representative species of different lineages plotted on a redacted phylogeny of the land plants. For convenience of inspection, the insert (upper left) plots maximal NCT and PCG values as a function of the node number in the cladogram (node 1 = oldest). Maximal values are used for unresolved polytomies. NCT data from Bell and Mooers (Reference Bell and Mooers1997); data and references for PCG provided in Supplementary Table S1.

Figure 3. Long description
The image consists of two main components.
1. Inset Scatter Plot (Top-Left):
This plot has a horizontal X-axis labeled Node Number ranging from 1 to 13. The left Y-axis is Maximum N C T (open circles) ranging from 0 to 50. The right Y-axis is Maximum P C G 1 times 10 super 6 (solid circles) ranging from 0 to 85. Open circles representing N C T show a general upward trend as node number increases. Solid circles representing P C G show a more scattered distribution with a peak near node 13.
2. Phylogenetic Tree (Main Image):
The tree originates at Node 1 (land plants) branching from charophycean algae (1 to 13 N C T, 32,000 P C G).
- Lower branch: Bryophytes, including Anthocerotophyta (12 N C T, 19,000 P C G), Marchantiophyta (15 N C T, 19,000 P C G), and Bryophyta (26 N C T, 33,000 P C G).
- Upper branch: Tracheophytes (Node 2), which splits into Pteridophytes (Node 3) and Seed Plants (Node 5).
- Pteridophyte branch: Includes Lycophytes (Node 3, 25 N C T, 22,000 P C G), Horsetails (Node 4, 16 N C T, 55,000 P C G), and Ferns (Node 4, 5 to 20 N C T, 25,000 P C G).
- Seed Plant branch: Splits into Gymnosperms (Node 5, approximately 30 N C T, 55,000 P C G) and Flowering Plants (Node 6).
- Flowering Plants: Branches through A N A Grade (approximately 30 N C T, 27,000 P C G), Magnoliids (Node 6), Monocots (Node 7), and Eudicots (Node 8).
- Monocots: Include Liliales (Node 9, approximately 42 N C T, 30,000 P C G), Asparagales (Node 10, approximately 36 N C T, 30,000 P C G), and Poales (Node 10, approximately 44 N C T, 35,000 P C G).
- Eudicots: Include Ranunculales, Rosids (Node 11), and Asterids (Node 12, approximately 44 N C T, 85,000 P C G). Rosids further split into Fabids and Malvids (Node 13, approximately 46 N C T, 27,500 P C G).
6. Interconnectivity’s metrics and their empirical exploration
Because even unicellular organisms are hierarchically organized, a meaningful assessment of complexity requires approximations at multiple system levels. Three metrics can be used for this purpose: (1) enumeration of parts (e.g., types of cells, or protein domain diversity), (2) enumeration of connectance and versatility (e.g., number of protein-protein interactions, or number of intrinsically ordered protein domains), and (3) globalization (e.g., reliance on bulk-flow transport systems for nutrient transport). Each is predicted to scale as a function of a system’s complexity, and each expectation can in principle be challenged by comparative evidence. The ratchet framework is therefore falsifiable.
Before exploring these three metrics, it is important to consider that the distinction between ‘a part’ and ‘a connection’ is not always clear-cut because a cell-type, gene, or protein domain is a physical entity, and yet reflects one or more physiological or developmental connections. Consequently, ‘a part’ such as a cell-type or gene serves as a proxy for one or more connections. And because connection combinations are large but finite (see Figure 1a), part enumeration can provide a convenient proxy for interconnectedness, albeit differing in the size frequency distributions of the number of connections per part (see Barabási & Albert, Reference Barabási and Albert1999), e.g., random connectedness results in a ‘flat’ connection size frequency distribution (Erdös & Rényi, Reference Erdös and Rényi1959).
Although the following four examples are meant to show how metrics can be used, they are presented less to validate the framework and more to show the limitations and reliability of the currently available data (see Supplementary Tables S1 and S2).
6.1. Example 1: Enumeration of cell-types and protein-coding genes
Across metazoan lineages, the number of different cell-types per organism (NCT) and the number of protein-coding genes (PCG) tend, on average, to increase, e.g., from a maximum of NCT = 18 in some sponge species to NCT = 122 among many vertebrates (and as many as 200–400 in humans) (Figure 2). This trend, however, is not monotonic. For example, the PCG estimated for some sponge and cnidarian species significantly exceeds that reported for some vertebrates, which may be attributed to the effects of whole genome duplication events (i.e., Figure 2; nodes 1, 2 and 11). Likewise, reductions are evident – most strikingly in sea squirts, which have lost the notochord and most myomeric segmentation (i.e., Figure 2; node 8). A corresponding survey across land plant lineages (Figure 3) shows NCT increasing from a maximum of 26 across bryophytes to 44 in late-divergent angiosperms, whereas PCG increases inconsistently with notable spikes possibly reflecting whole-genome duplications (e.g., Figure 3; nodes 4, 5, and 12).
These datasets are consistent with, but do not confirm, the ratchet’s framework because of four limitations using NCT and PCG as interconnectivity proxies: (1) every phylogeny is subject to repeated revision, (2) anatomical studies may reveal additional cell types (e.g., see Jiang et al., Reference Jiang, Qiheng, Zhu, Zong, Shang, Jin, Zhang, Chen, Wu, Chu, Zhang, Luo, Jing, Zou, Bao, Xiao and Zhang2023; Rood et al., Reference Rood, Wynne, Robson, Hupalowska, Randell, Teichmann and Regev2025), (3) assessments of PCG are confounded by the effects of polyploidy, and (4) the selection of ‘representative’ taxa, all of which are extant, affects perceived trends.
The first caveat must be re-emphasized because the ratchet operates on the topology of interconnectivity rather than on part counts. Two organisms with the same NCT can exhibit very different degrees of interdependency among cell-types, and the familiar comparison between annelids and vertebrates – which are comparable in gross NCT but presumably not in the depth of integration among cell-types – illustrates why part enumeration cannot by itself distinguish levels of organized complexity. NCT is nevertheless included as an accessible first-order metric that is often correlated with the interconnectivity metrics developed in the following examples. However, the ratchet’s grip on the system is exerted through the connectance and integration measures of Examples 2–4 rather than through raw cell-type counts. In lineages where NCT and connectance covary, part enumeration serves as a reasonable proxy for the underlying interconnectivity dynamics. In lineages where they do not, the connectance measures are the ones the framework relies on.
6.2. Example 2: Proteome size and versatility
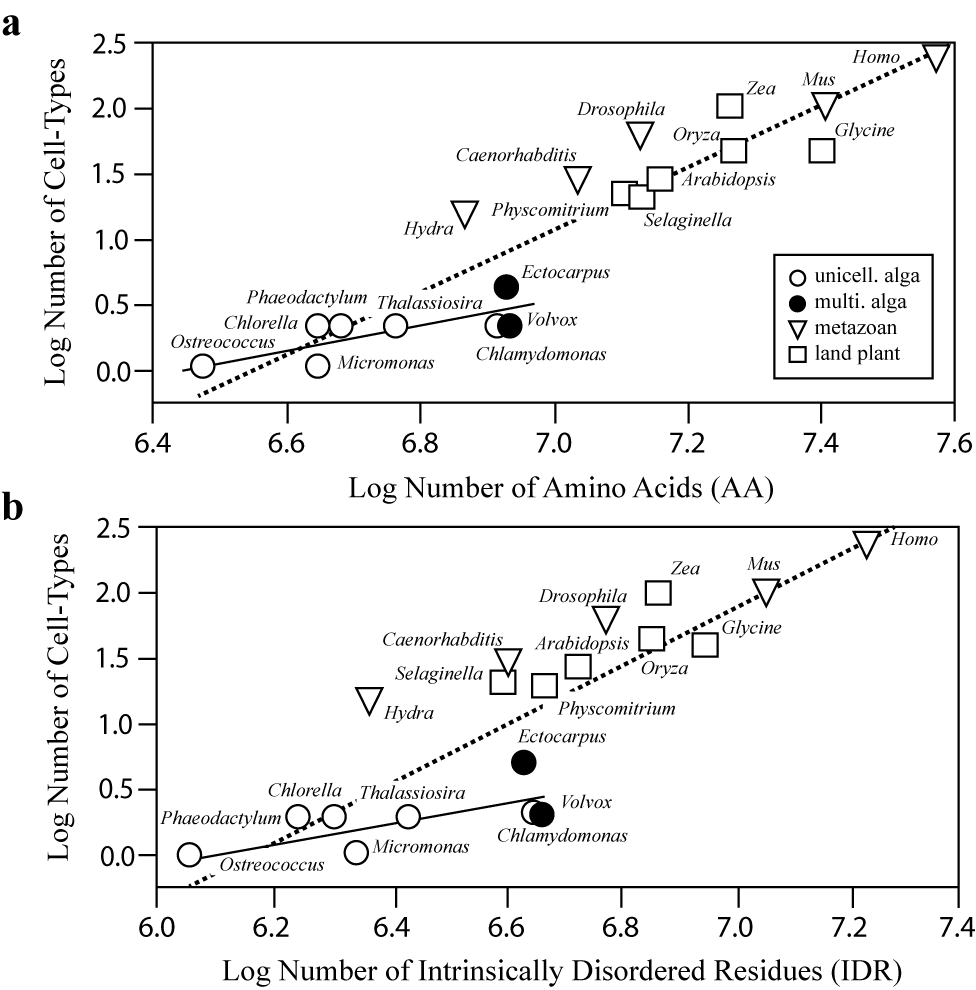
Combining part enumeration with more direct metrics of connectance addresses some of the aforementioned concerns. Figure 4 plots NCT against the number of amino acids per proteome (AA, used as a proxy for proteome size) and the number of intrinsically disordered residues per proteome (IDR, used as a proxy for proteome versatility). Across all six unicellular algae, two simple multicellular algae, five metazoans, and six land plants, NCT increases disproportionately with either AA or IDR, i.e., cell-type diversity rises faster than proteome size. Importantly, Figure 4 shows that the informative quantity is not any single ‘part count’ but rather the scaling relationship among counts – a signature of interconnectivity rather than of part enumeration. As proteome interconnectivity grows, cell-type diversity increases, reflecting the compounding of new interconnection opportunities upon existing ones.
Log-log bivariate plots of the number of cell types (NCT) per organism versus the number of amino acids (AA) per proteome (a) and the number of intrinsically disordered residues (IDR) per proteome per organism (original AA and IDR units: 1 × 10⁶) (b). AA and IDR are taken as proxies for systemic connectivity. Data sets span polyphyletic unicellular and multicellular algae, nonvascular and vascular plants, and metazoans (see legend in a). Data for NCT from Bell and Mooers (Reference Bell and Mooers1997); data for AA and IDR from Oates et al. (Reference Oates, Romero, Ishida, Ghalwash, Mizianty, Uversky, Xue, Dosztányi, Obradovic, Kurgan, Dunker and Gough2013), Peng et al. (Reference Peng, Radivojac, Vucetic, Dunker and Obradovic2006), and Peng and Kurgan (Reference Peng and Kurgan2012). Regression lines are ordinary least-squares regression curves (Y and X are the dependent and independent variables, respectively). Regression of NCT vs. AA: r 2 = 0.89, slope = 2.36. Regression of NCT vs. IDR: r 2 = 0.71, slope = 2.18. Both slopes exceed unity. Regression of unicellular and simple multicellular algae (solid line) yields r 2 < 0.25, with slopes not significantly different from unity. Adapted from Niklas et al. (Reference Niklas, Dunker and Yruela2018).

Figure 4. Long description
Two vertically stacked log-log bivariate plots, labeled A and B.
Panel A: Log Number of Cell-Types (N C T) on the Y-axis (0.0 to 2.5) versus Log Number of Amino Acids (A A) on the X-axis (6.4 to 7.6).
* A legend identifies four groups: open circles for unicellular algae, solid black circles for multicellular algae, inverted triangles for metazoans, and open squares for land plants.
* Data points for unicellular algae (e.g., Ostreococcus, Chlorella, Micromonas) cluster at the bottom left (X 6.4 to 6.8, Y 0.0 to 0.5).
* Multicellular algae (Ectocarpus, Volvox) are positioned slightly higher and further right.
* Metazoans (Hydra, Caenorhabditis, Drosophila, Mus, Homo) and land plants (Physcomitrium, Selaginella, Arabidopsis, Oryza, Zea, Glycine) follow a steep upward trend toward the top right.
* Two regression lines are present: a solid line through the algae data points with a shallow slope, and a dashed line through the entire dataset with a steep slope (2.36).
Panel B: Log Number of Cell-Types (N C T) on the Y-axis (0.0 to 2.5) versus Log Number of Intrinsically Disordered Residues (I D R) on the X-axis (6.0 to 7.4).
* The distribution of data points mirrors Panel A, with unicellular algae at the bottom left and metazoans/land plants at the top right.
* A solid regression line for algae shows a slope near unity.
* A dashed regression line for the full dataset shows a steep positive slope (2.18), indicating that N C T increases significantly faster than I D R.
6.3. Example 3: Interactome protein–protein interactions
Arguably, a more direct proxy for interconnectivity is interactome size and the interactivities of hub proteins. Unfortunately, complete and experimentally based datasets for these features are rare. Nevertheless, research indicates that (1) hub proteins in more derived species serve as increasingly critical anchors for connectivity, providing a more robust buffer against network failures compared to early divergent species (Zitnik et al., Reference Zitnik, Sosič, Feldman and Leskovec2019), (2) intrinsically disordered domains are particularly prevalent in hub proteins, enhancing their ‘versatility’ (Gao et al., Reference Gao, Ma, Wang, Zhong, Zang, Zhong, He and Yang2021), and (3) ancient proteins (i.e., those found across the tree of life) occupy more central positions in interactome networks (Chen et al., Reference Chen, Ho, Huang, Juan and Huang2014).
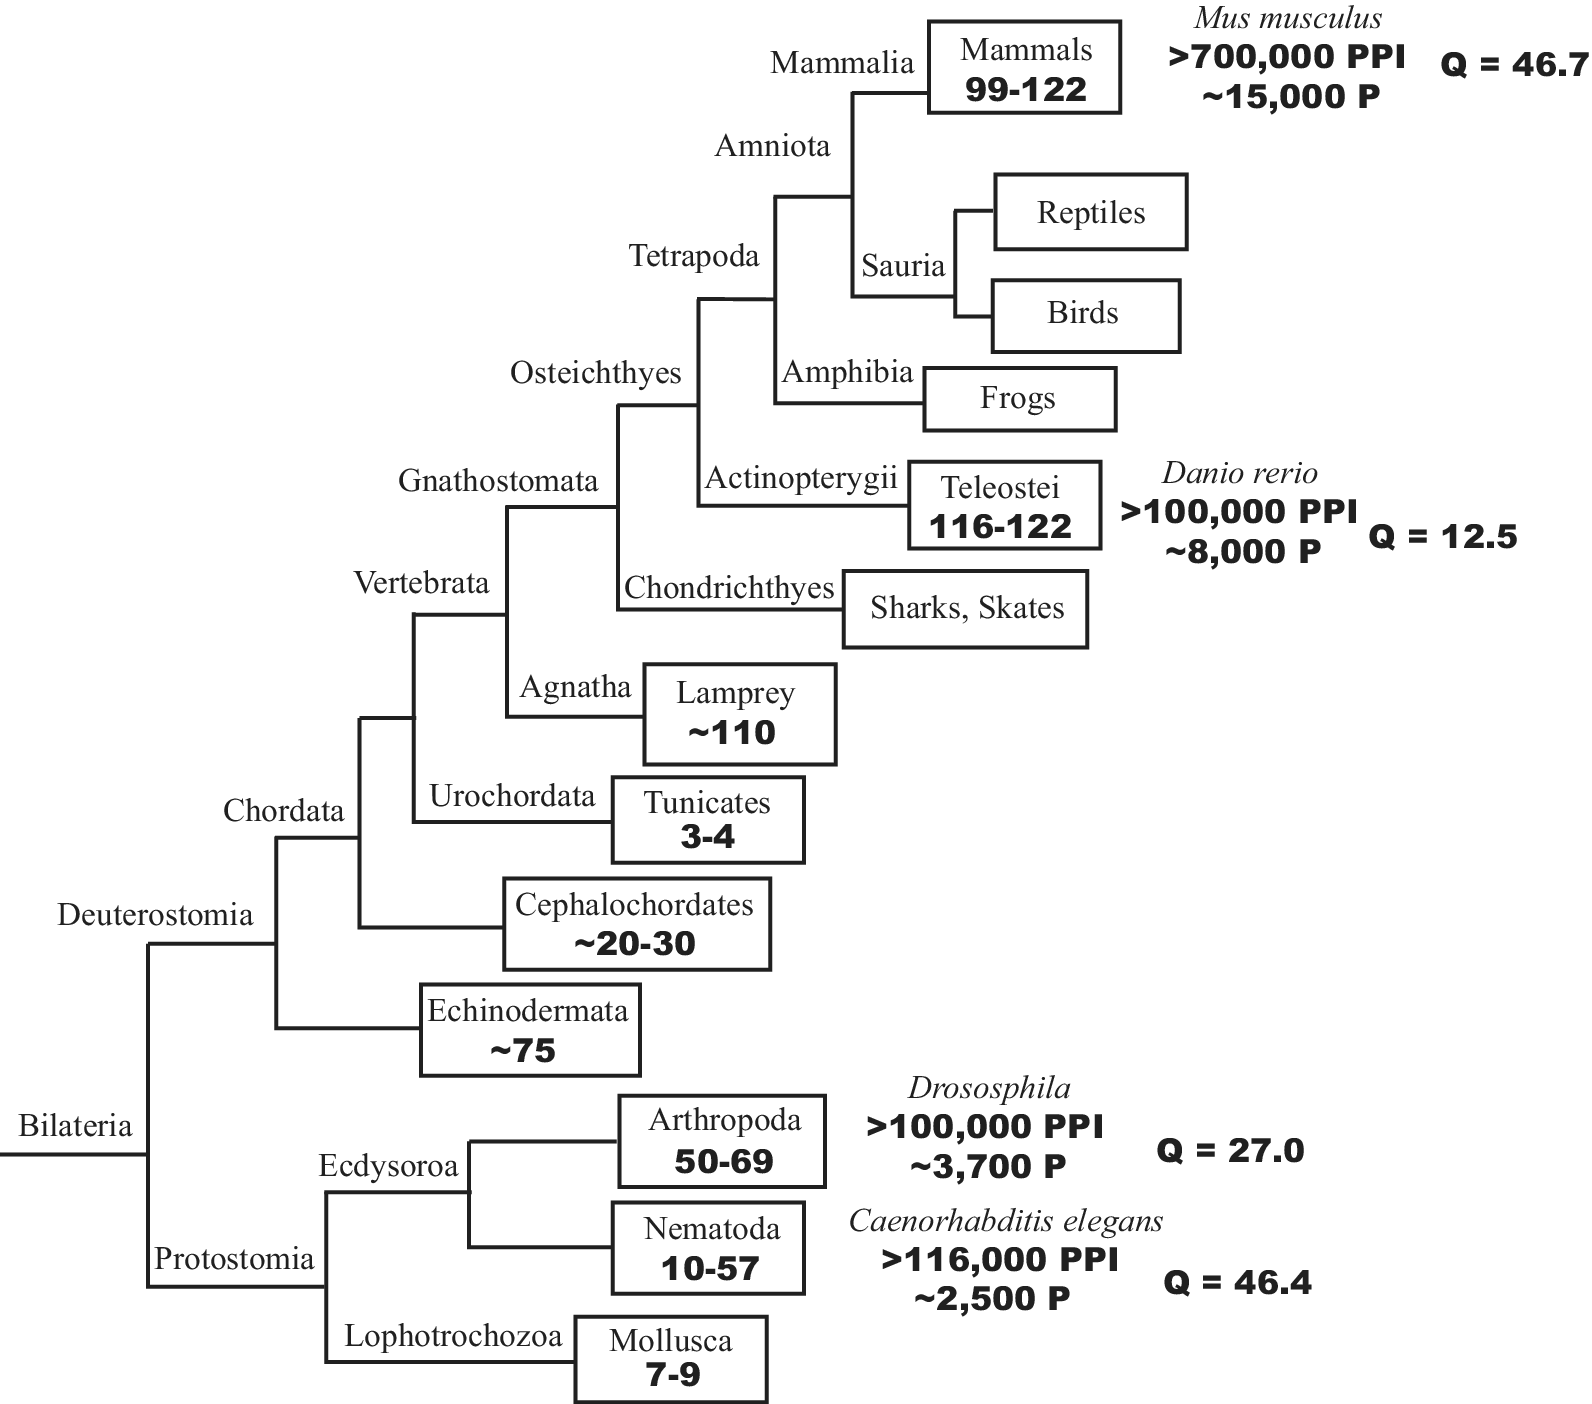
Data for a limited number of protein-protein interaction (PPI) databases and proteins per interactome (P) plotted on a metazoan phylogeny (Figure 5) reveal informative albeit limited insights. For example, a comparison between early- and late-divergent vertebrates (Danio and Mus) reveals a marked increase in PPI, consistent with a deepening interconnectivity. In contrast, a comparison between the Ecdysozoans Drosophila and Caenorhabditis and the vertebrate Danio shows no increase in PPI, albeit a significant increase in P.
Estimates of the number of different cell types (NCT, shown in boxes), the number of protein-protein interactions (PPI), and the number of proteins in the interactome (P) reported for four representative metazoan species. Q denotes the quotient of PPI and P (i.e., Q = PPI/P). Data for PPI and P are provided in Supplementary Table S2.

Figure 5. Long description
A phylogenetic tree branching from Bilateria into Protostomia and Deuterostomia.
Protostomia branches into:
* Lophotrochozoa: Mollusca with 7-9 N C T.
* Ecdysoroa: Nematoda (Caenorhabditis elegans) with 10-57 N C T, greater than 116,000 P P I, approximately 2,500 P, and Q equals 46.4. Arthropoda (Drosophila) with 50-69 N C T, greater than 100,000 P P I, approximately 3,700 P, and Q equals 27.0.
Deuterostomia branches into:
* Echinodermata: approximately 75 N C T.
* Chordata: further branching into Cephalochordates (approximately 20-30 N C T), Urochordata (Tunicates, 3-4 N C T), and Vertebrata.
Vertebrata branches into:
* Agnatha: Lamprey with approximately 110 N C T.
* Gnathostomata: branching into Chondrichthyes (Sharks, Skates) and Osteichthyes.
Osteichthyes branches into:
* Actinopterygii: Teleostei (Danio rerio) with 116-122 N C T, greater than 100,000 P P I, approximately 8,000 P, and Q equals 12.5.
* Tetrapoda: branching into Amphibia (Frogs) and Amniota.
Amniota branches into:
* Sauria: Birds and Reptiles.
* Mammalia: Mammals (Mus musculus) with 99-122 N C T, greater than 700,000 P P I, approximately 15,000 P, and Q equals 46.7.
Likewise, comparisons among the quotients of PPI and P (i.e., the number of protein-to-protein interactions normalized with respect to interactome size, denoted as Q) reveal a significant increase between early and late divergent vertebrates (Danio and Mus, respectively), a significant difference between the two Ecdysozoans (Drosophila and Caenorhabditis), and comparable Q-values for Caenorhabditis and Mus. Unfortunately, data for plant interactomes are limited to late divergent angiosperm lineages, making comparisons among early and late divergent plant lineages impractical.
Clearly, these comparisons are severely limited and yield problematic interpretations both because of their limited number and the experimental difficulties in reliably determining the number of protein-to-protein interactions. Phylogenetically broader and empirically more robust datasets are needed, particularly for early divergent animal and plant taxa and their ancestral traits, which remain problematic for some clades (e.g., Harris et al., Reference Harris, Clark, Schrempf, Szöllösi, Donoghue, Hetherington and Williams2022).
6.4. Example 4: Bulk-transport and interconnectivity’s globalization
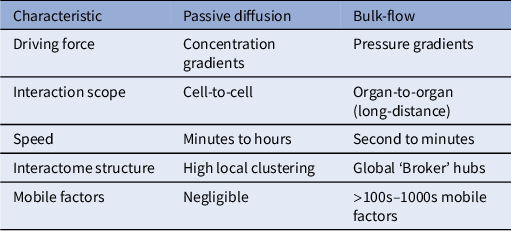
Unlike the previous three examples, this section develops the third organismic metric – bulk-flow globalization – in an explicitly macroevolutionary form. Bulk-transport is treated not as a separate measure but as a mechanism by which locally clustered metabolic connectivity becomes globally centralized. Comparative morphology has long recognized that the differences between passive diffusion and bulk-flow transport (Table 2) occupy a central place in evolution (Knoll, Reference Knoll2011; Niklas, Reference Niklas2014; Niklas & Newman, Reference Niklas and Newman2013; Woudenberg et al., Reference Woudenberg, Renema, Tomescu, De Rybel and Weijers2022). The innovation of bulk-flow transport systems represents a key event in the topological globalization of multicellular life not merely because it adds connections, but because it creates a new dimension of centralized connectivity, providing rapid conveyance, a prerequisite for increased body size and functional specialization (e.g., Mateus et al., Reference Mateus, Steppe and Tricker2026). This innovation undoubtedly created a positive feedback between body plan size and elaboration. Once bulk-flow systems evolved, larger body plans became accessible, and larger body sizes necessitated more efficient bulk-flow systems.
Some characteristics of passive diffusion versus bulk-flow transport

Table 2. Long description
The table consists of three columns: Characteristic, Passive diffusion, and Bulk-flow.
* Driving force: Passive diffusion relies on concentration gradients, while Bulk-flow relies on pressure gradients.
* Interaction scope: Passive diffusion is cell-to-cell, whereas Bulk-flow is organ-to-organ (long-distance).
* Speed: Passive diffusion takes minutes to hours, while Bulk-flow takes seconds to minutes.
* Interactome structure: Passive diffusion shows high local clustering, while Bulk-flow features global ‘Broker’ hubs.
* Mobile factors: Passive diffusion has negligible mobile factors, whereas Bulk-flow involves greater than 100s to 1000s of mobile factors.
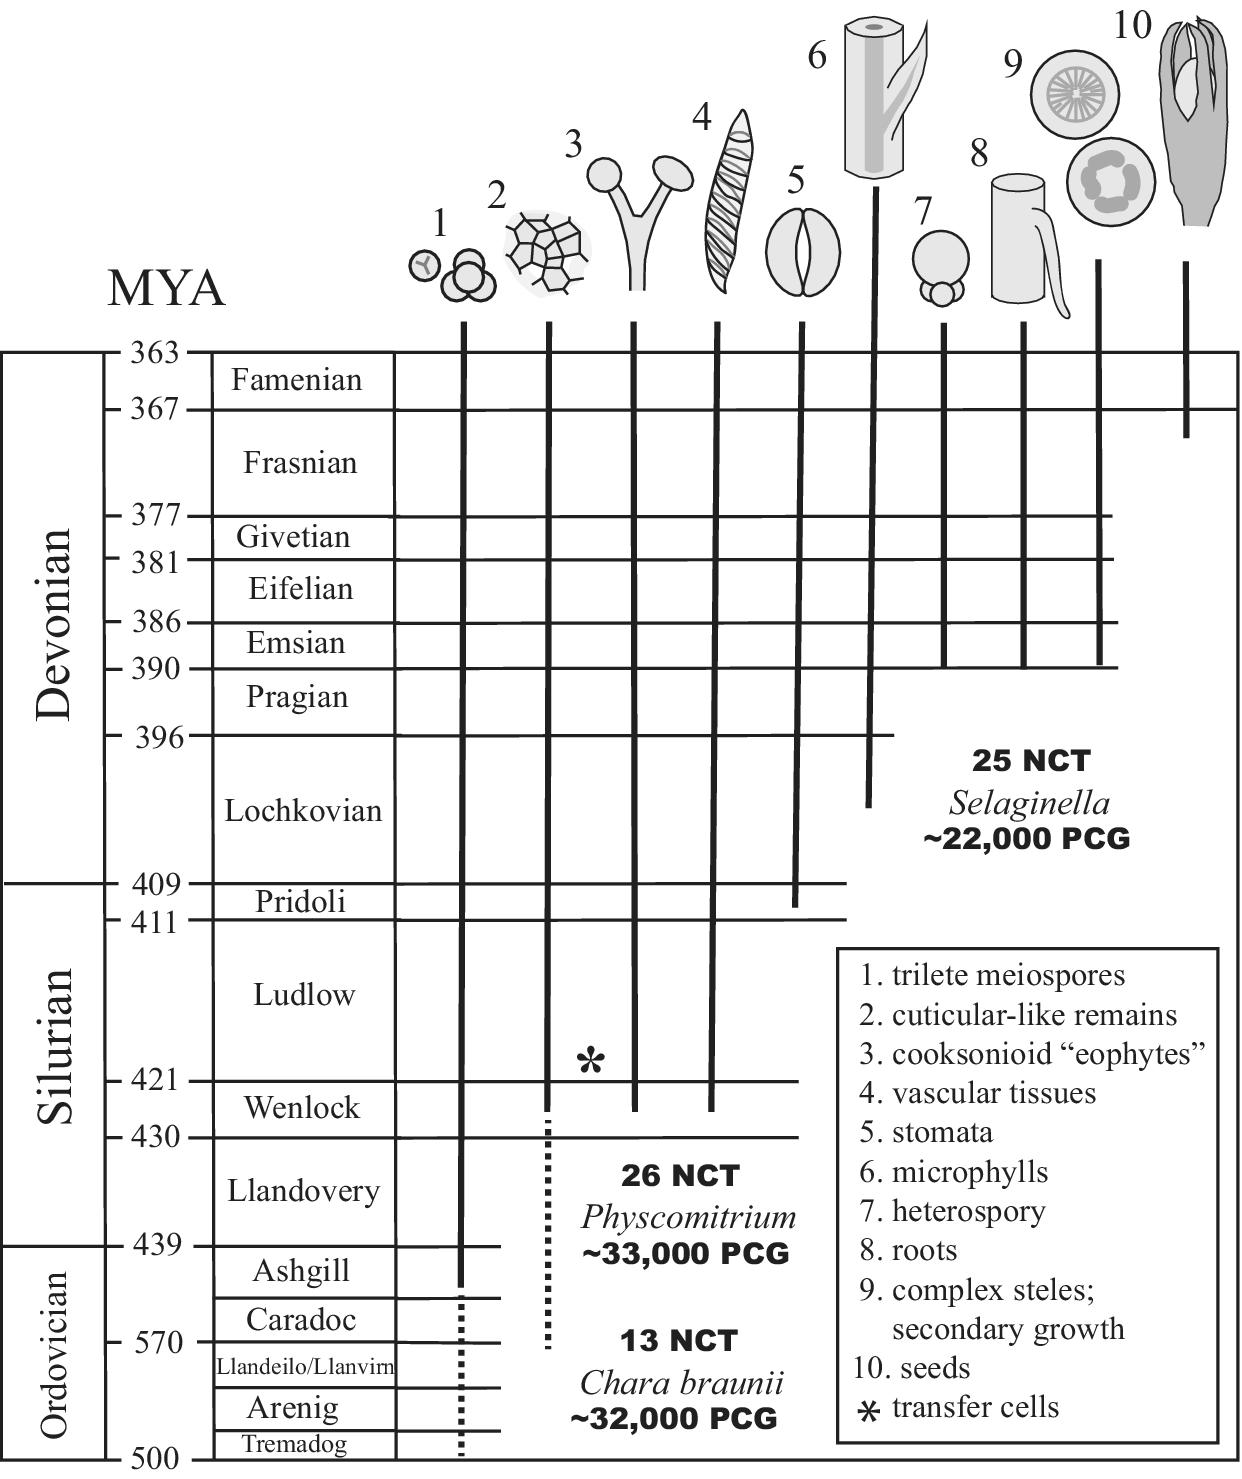
First known occurrences of ten evolutionarily important land plant novelties (1–10; see legend, lower right) appearing in the early Paleozoic. Number of cell types (NCT) and number of protein-coding genes (PCG) of three anatomically comparable extant taxa (an alga, a bryophyte, and an early divergent vascular plant) are provided as benchmark comparisons. The occurrence of transfer cells (Edwards et al., Reference Edwards, Morris, Axe, Taylor, Duckett, Kenrick and Pressel2022), purported to identify the oldest sporophyte–gametophyte physiological conjunction, is denoted by *. First occurrences (which are minimum ages) based on Taylor et al. (Reference Taylor, Taylor and Krings2009) and references therein.

Figure 6. Long description
A vertical timeline chart. The Y-axis on the left is labeled M Y A (millions of years ago) and spans from 500 at the bottom to 363 at the top. It is divided into three major geological periods: Ordovician (bottom), Silurian (middle), and Devonian (top), each further subdivided into stages like Tremadoc, Llandovery, and Famennian.
Three benchmark taxa are placed within the timeline:
1. Chara braunii (alga) at the bottom with 13 N C T and approximately 32,000 P C G.
2. Physcomitrium (bryophyte) in the Silurian with 26 N C T and approximately 33,000 P C G.
3. Selaginella (vascular plant) in the Devonian with 25 N C T and approximately 22,000 P C G.
Ten vertical lines extend from the top of the chart down to their first known occurrence in the fossil record. The lines correspond to numbered illustrations at the top:
1. Trilete meiospores: appearing in the mid-Ordovician.
2. Cuticular-like remains: appearing in the late Ordovician.
3. Cooksonioid eophytes: appearing in the early Silurian, marked with an asterisk for transfer cells.
4. Vascular tissues: appearing in the mid-Silurian.
5. Stomata: appearing in the late Silurian.
6. Microphylls: appearing in the early Devonian.
7. Heterospory: appearing in the mid-Devonian.
8. Roots: appearing in the mid-Devonian.
9. Complex steles and secondary growth: appearing in the late Devonian.
10. Seeds: appearing in the late Devonian.
A legend in the bottom right corner explicitly lists these ten novelties and identifies the asterisk as transfer cells.
Consider two macroevolutionary examples, the Cambrian explosion (CE) and the Devonian explosion (DE). The CE records the appearance of ~36 metazoan phyla within approximately 25 million years. Although Ediacaran taxa with high surface-area-to-volume ratios (e.g., Dickinsonia and Charnia) may have relied exclusively or primarily on passive diffusion (i.e., osmotrophy), the occurrence of triploblastic bilaterians (e.g., Kimberella), burrowing trace fossils (e.g., Helminthoidichnites) evocative of pseudocoelomate-grade organization, and putative deuterostome remains before the CE (Li et al., Reference Li, Wei, Wen, Wang, Lei, Anderson, Zhao, Dunn, Perry and Cong2026) collectively point to the earlier emergence of complex body plans and physiological systems. Clearly, bulk-flow transport systems could not have been sufficient in isolation to explain the CE, whose proximate causality requires a polythetic approach (see Knoll & Carroll, Reference Knoll and Carroll1999; Marshall, Reference Marshall2006; Newman & Bhat, Reference Newman and Bhat2008; Zhang & Shu, Reference Zhang and Shu2021). Reliance on passive diffusion also does not preclude complex body plans manifesting large surface areas capable of systemic motion-driven peristalsis (e.g., the sea spider Nymphopsis spinosissima).
The DE serves as a parallel example (Figure 6). Desiccation-resistant meiospores and cuticular remains extend into the Ordovician, indicating that the antecedents of vascular plants were adapting to air well before the Devonian explosion (see Renner & Sokoloff, Reference Renner and Sokoloff2024; Taylor et al., Reference Taylor, Taylor and Krings2009). However, with the advent of xylem and phloem and the long-distance and targeted transport of chemical and electrical signals (Suda et al., Reference Suda, Hagihara, Ogawa, Ebine, Nakamura and Toyota2026), land plants rapidly exceeded the size ranges permitted by passive diffusion, evolved organographic distinctions among vascularized stems, leaves, and roots, and underwent a reproductive transition from a life cycle dominated by free-living gametophytes to the seed plant habit. Although the evolution of xylem is often emphasized in the context of the DE, the ‘phloem-first’ hypothesis (Niklas, Reference Niklas2013) is relevant because phloem polar transport (in tandem with an antecedent capacity for discretized plasmodesmata deployment; see Bierenbroodspot et al., Reference Bierenbroodspot, Pröschold, Fürst-Jansen, de Vries, Irisarri, Darienko and de Vries2024) provides integrated symplastic pathways delivering signalling molecules (e.g., mRNAs, proteins, and phytohormones) coordinating systemic growth and development (Liu & Chen, Reference Liu and Chen2018). As in the CE, the evolution of plant bulk-flow transport probably did not trigger the DE but more likely provided an interconnective topological revolution upon which subsequent body plan elaborations could be built and sorted into ecophysiologically distinctive clades (DiMichele et al., Reference DiMichele, Stein, Bateman, Allmon and Bottjer2001), from which the subtraction of prior adaptations could not occur in the absence of environmental buffering (e.g., the extreme reduction of the ancestral free-living gametophyte generation seen in seed plants).
In summary, without transport systems capable of nutrient delivery exceeding the capacity of passive diffusion, elaborations of large, metabolically more active body plan variants, and the diversification of niche space would have been physiologically impossible. In both the CE and DE, the physiological efficacy of bulk-transport systems permitted a new level of information transfer to support development and growth. These systems also required an expanded repertoire of signalling molecules that could accommodate increases in morphological and physiological complexity. It is reasonable therefore to predict a discontinuity in complexity (measured by interactome size and interconnectivity) between non-vascularized and vascularized organisms, similar to that observed in the difference in the number of cell types vs. proteome size and versatility observed for unicellular and multicellular organisms (see Figure 4).
7. Predictions
The foregoing examples illustrate some of the current limitations in the datasets required to test the ratchet’s worth. Additional data are clearly required. However, any conceptual framework is useful only insofar as it generates predictions evaluable against data. We focus on three that are testable as new data become available.
7.1. Increasing depth of dependency
Descendant lineages should, on average, manifest more coordination among their parts to achieve greater functionalities. Even when gross morphology appears conserved, underlying regulatory or developmental entanglement will intensify. This is evaluable using comparative interactome data, gene regulatory network architecture, and developmental gene expression studies.
7.2. Asymmetric reversibility
Reduction should necessitate reorganization. Phylogenetic trends and the fossil record should reveal more frequent gains of novel elements than clean losses of long-established ones. Specifically, the probability of retaining a feature should correlate positively with its connectance within the functional network; reductions should be accompanied by network reorganization rather than simple deletion.
7.3. Context-dependent simplification
Reductions should occur in environments that buffer internal requirements as in parasitic or symbiotic settings. Where buffering is absent or where the organism is phenotypically adaptable to a range of environmental conditions (i.e., ‘organismic buffering’), deep losses should be rarer. This is testable by correlating genomic or morphological reduction across parasitic lineages with quantitative measures of host dependency.
8. Summary and concluding remarks
Interconnectivity’s reversible ratchet posits that organismic complexity can be defined and quantified based on the topology of a system’s interconnectivity. Complexity is predicted to increase over evolutionary time as the interconnections among a system’s parts increase and become more functionally integrated. The loss of older interconnections becomes increasingly more costly, whereas the opportunistic addition of new connections offers the possibility of ‘down the road’ benefits. Thus, the ratchet moves on average forward. The loss of parts or connections is nevertheless possible (e.g., when environmental conditions provide the resources or services the lost parts or their connections originally afforded). Although the gains and losses of parts or connections can result from random mutations, the ratchet remains subject to selection acting on the immediate and long-term consequences of lost parts or connections.
By reframing the ratchet in terms of organized interconnectivity, debates over whether complexity increases convert into an empirical question: Under what conditions do interdependencies deepen, and when are they relaxed? We propose that the answer lies not in adaptive foresight but in the historical layering of functional relationships. Evolution proceeds by the inheritance of prior integrations. What persists does so because it has become entangled with other processes, and the past increasingly constrains what cannot be removed.
Open peer review
To view the open peer review materials for this article, please visit http://doi.org/10.1017/qpb.2026.10059.
Acknowledgements
The authors thank the editors and anonymous reviewers for their constructive recommendations to improve this work. The authors also thank Drs. Michael Christianson (University of California) and Stuart Newman (New York Medical College – Biomedical Sciences) for their helpful comments on an earlier draft of the manuscript.
Author contributions
K.J.N. conceived the framework and led manuscript preparation. W.L.C. contributed to case studies in the fossil record and contributed to all sections. T.G.O. conceived the framework and contributed to all sections. All authors approved the final version.
Competing interest
The authors declare no conflicts of interest.
Data availability statement
No new data are presented in this article. This article presents no original empirical data. All data underlying the figures are cited in the figure legends or available from the primary literature cited in Supplementary Tables S1 and S2.
Funding statement
Funding was not provided for this research. Funding for Open Access was provided by the College of Agriculture and Life Sciences, Cornell University.
AI use
AI was used to check and format references for the style of Quantitative Plant Biology. AI was not used to find references, write or modify the text, or generate figures. Ithaca, NY 14853, USA
Supplementary material
The supplementary material for this article can be found at http://doi.org/10.1017/qpb.2026.10059.


 Open access


Comments
Dear Dr. Hamant:
My coauthors and I would like to submit for your consideration a Perspective article entitled Interconnectivity’s Reversible Ratchet and Complexity’s Entanglement with Evolution. This work is original and is not being considered by another journal.
Our work develops and empirically tests a mechanistic definition of biological complexity grounded in the topology of interconnectivity among parts rather than in part enumeration. This idea is tested using published data drawn from metazoans and land plants. The central thesis is that, when novelties become integrated into functional networks, the cost of their loss increases in proportion to the depth of their accumulated interdependencies — a phenomenon we call interconnectivity’s ratchet.
We believe this Perspective will advance the field by
(i) providing an operational, quantitative definition of organized complexity that unifies the genomic, proteomic, cellular, and morphological scales,
(ii) articulating a specific selective asymmetry that explains why complexity, once achieved, resists reduction,
(iii) situating this framework alongside three influential prior accounts: McShea & Brandon’s Zero Force Evolutionary Law, Maynard Smith & Szathmáry’s major transitions, and Stoltzfus-style constructive neutral evolution, and by
(iv) providing testable predictions that can focus future enquiry and falsify our hypotheses.
Because the manuscript deals with plant and animal evolution at different hierarchical levels of biological organization, we recommend without prejudice the names of seven potential reviewers whose research interests span a broad spectrum of plant and animal evolutionary biology and mathematics:
1. Michael Christianson (mxianson@pacbell.net) a geneticist and developmental botanist.
2. Stuart Newman (STUART_NEWMAN@NYMC.EDU) a developmental zoologist and evolutionist.
3. Peijian Shi (peijianshi@gmail.com) a biologist focusing on statistical morphometrics.
4. Gerd Müller (gerhard.mueller@univie.ac.at) a developmental zoologist and evolutionist.
5. Johan Gielis (johan.gielis@gmail.com) a mathematician focusing on morphometrics.
6. Gunter Wagner (gunter.wagner@yale.edu) a developmental and evolutionary zoologist.
7. Bruce Tiffney (bruce.tiffney@ccs.ucsb.edu) a paleobiologist and evolutionary biologist.
We look forward to hearing from you and the reviewers. Should you or they have any questions or concerns, my coauthors and I will be happy to provide answers or additional information.
Cordially yours,
Karl J. Niklas
Cornell University
Ithaca, NY 14853 (USA)