


INTRODUCTION
The embryonic and larval development of marine invertebrates is affected by extrinsic and intrinsic factors, such as temperature, maternal energy provisioning (Ouellet & Plante, Reference Ouellet and Plante2004) and both pre- and post-hatching environmental conditions (Torres & Escribano, Reference Torres and Escribano2003; Giménez et al., Reference Giménez, Anger and Torres2004; Fischer & Thatje, Reference Fischer and Thatje2008). Variation in environmental key factors such as food availability (Anger & Dawirs, Reference Anger and Dawirs1982), quality (Harms et al., Reference Harms, Anger, Klaus and Seeger1991), salinity (Giménez & Torres, Reference Giménez and Torres2002; Giménez & Anger, Reference Giménez and Anger2003) or temperature (Dawirs, Reference Dawirs1979, Reference Dawirs1985) can have unfavourable effects on growth in the early ontogeny of decapod crustaceans (for review, see Anger, Reference Anger2001).
The early life cycle of the edible crab, Cancer pagurus, consists of five planktotrophic zoeal stages and a megalopa before reaching the first crab stage (Ingle, Reference Ingle1981). This species has a broad geographical distribution from northern Norway to West Africa and is also abundant in the Mediterranean Sea, which implies a wide range of temperature tolerance in adult populations of the species. Studies of abundance and catch rates show that C. pagurus is expanding its biogeographical range further northwards (Woll et al., Reference Woll, van der Meeren and Fossen2006).
Since 1962 mean annual sea-surface temperature in the North Sea around the island of Helgoland rose 1.1°C, with milder winters and rising summer maxima (Wiltshire & Manly, Reference Wiltshire and Manly2004). Such a shift in ecological conditions may cause changes in the metabolic efficiency or fitness of an organism (Pörtner, Reference Pörtner2001; Heilmayer et al., Reference Heilmayer, Brey and Pörtner2004), which presumably is reflected in its elemental and biochemical composition (Dahlhoff, Reference Dahlhoff2004). Studies on the complete temperature tolerance window of invertebrate larvae are extremely scarce, but may be a clue in future assessments of the potential of species to cope with climate change (e.g. Anger, Reference Anger2001; Pörtner et al., Reference Pörtner, Berdal, Blust, Brix, Colosimo, Wachter, Giuliani, Johansen, Fischer, Knust, Lannig, Naevdal, Nedenes, Nyhammer, Sartoris, Serendero, Sirabella, Thorkildsen and Zakhartsev2001, Reference Pörtner, Storch and Heilmayer2005; Thatje et al., Reference Thatje, Anger, Calcagno, Lovrich, Pörtner and Arntz2005).
In the present study, we provide evidence for temperature-induced changes in the chemical composition and aerobic capacities of C. pagurus larvae. Based on the hypothesis that the early ontogeny is the most vulnerable part of a life cycle (Anger, Reference Anger2001), we discuss the physiological capability of the species to cope with elevated temperatures.
MATERIALS AND METHODS
Sampling and maintenance of adults and larvae
Ovigerous Cancer pagurus (carapace width (CW) 125 to 171 mm) were caught in May 2005 near the island of Helgoland in the North Sea (54° 11′N 7° 53′E) using a bottom trawl. Animals were immediately transported to the laboratory of the Marine Biological Station Helgoland (Biologische Anstalt Helgoland (BAH)) where they were maintained individually in flow-through seawater aquaria (15–20 l) at sea-surface temperature (15.2–17.2°C) and salinity (~32 psu) in a 12:12-hour light/dark cycle. Adults were fed twice a week either with isopods (Idotea sp.) or pieces of mussel (Mytilus edulis) meat. One day after feeding, remains were removed from the aquaria to maintain good water quality.
Freshly hatched larvae were collected in filters receiving water from the overflow of the aquaria. Since most larvae hatched at night, samples were taken every morning. Filters were cleaned every evening to ensure daily larval age did not vary by more than 12 hours (Lovrich et al., Reference Lovrich, Thatje, Calcagno, Anger and Kaffenberger2003). Solely actively moving larvae were used for experiments.
Influence of temperature on larval development
Randomly selected larvae from one randomly selected female (A) were kept in 500 ml glass bowls with a density of 20 to 30 individuals per bowl. In daily intervals, water was changed; larvae checked for moults or mortality and subsequently were fed with freshly hatched Artemia spp. nauplii. One hatch (female A; Table 1) was divided on the day of hatching and subsequently reared at five constant temperatures (6, 10, 14, 18 and 24°C). Larvae reared at 15°C resulted from a female caught in 1985 and were maintained and reared under the same condition as outlined above.
Cancer pagurus. Changes in dry weight (W), carbon (C), nitrogen (N) and C:N ratio during time days after hatch (±SD) at five temperatures. Larvae reared at 15°C are from different female.

Minimum time of development for each instar was recorded assuming optimal developmental conditions in larvae (see Figure 1). Samples for determinations of larval dry weight (W) and elemental composition were taken immediately after hatching and later in intervals of one to ten days (see Table 1). Five replicates were collected, or fewer, when too few larvae were available. Each replicate consisted of 20–25 individuals in the Zoea I (Z I), but fewer (see Table 1) in the following (larger) instars.
Model of body mass increase (C) throughout the larvae development of the edible crab Cancer pagurus. Equation for the model is: C BC =−7.97−10.755 × t + 919.52 × f(T) + 476.634 × t × f(T); N = 463, F = 1599.51, R2 = 0.954; T represents the temperature in Kelvin and t the time in days. Isolines represent carbon content in µg. ZI–ZV are the larval instars. White areas show the realistic range of the model.

Elemental analyses (CHN)
Carbon (C), hydrogen (H) and nitrogen (N) contents were determined following Anger & Dawirs (Reference Anger and Dawirs1982); in brief: larvae were gently rinsed in distilled water, blotted on filter paper, placed into tin cartridges, vacuum-dried for 48 hours at <0.01 mbar in a Lyovac GT 2E (Leybold-Heraeus) apparatus, weighed to the nearest 0.1 µg on a Mettler UM3 microbalance, and stored frozen at –20°C. CHN content was measured with a Fisons (Carlo Erba Science) Model 1108 Elemental Analyzer.
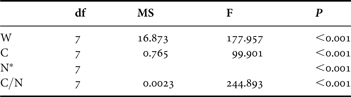
In order to study intraspecific variability in the maternal energy provisioning of offspring, we sampled freshly hatched larvae from eight ovigerous females (always after the first night of the hatching period; female CW = 13–17 cm; Table 2) and compared their initial body mass (measured as dry weight, W) and elemental composition (carbon, hydrogen and nitrogen; collectively CHN).
Cancer pagurus. Size of eight different females and elemental composition (dry weight (W), carbon (C), nitrogen (N), hydrogen (H), C:N and C:H ratio of freshly hatched larvae (hatch 1)).

Enzyme assay
Citrate synthase (CS) (E.C. 4.1.3.7) is a key regulatory enzyme in the tricarbonic acid (TCA) cycle and was chosen as an indicator of aerobic capacity. Investigations on metabolic enzymes in larval stages are scarce and studies on shrimp larvae show that CS activity is dependent on growth during ontogeny (Lemos et al., Reference Lemos, Salomon, Gomes, Phan and Buchholz2003). Samples for determinations of enzyme activity of CS were taken in the premoult period of the Zoea I instar of larvae reared at three temperatures (10, 14 and 18°C) and analysed following a modified method of Sidell et al. (Reference Sidell, Driedzic, Stowe and Johnston1987). Three replicates were collected, each consisting of 10 larvae. No samples were taken for 6° and 24°C as an insufficient amount of material was available.
Frozen samples were homogenized in ~0.3 µl extraction buffer (75 mM Tris–HCl, 1 mM EDTA; pH 7.6) per 1µg larval W (dry weight) to get a 1:10 (w/v) ratio with a Branson Sonifier 450 (0°C, output control 8, duty cycle 50%, 15 minutes). Homogenates were centrifuged for 5 minutes at 7400 g and 0°C with an Eppendorf Centrifuge 5810R. The concentration of soluble protein in the extracts was measured after Bradford (Reference Bradford1976). The samples were first diluted 1:5 with 0.9% NaCl and were then applied in duplicate (5 µl) on microplates. Subsequently 250 µl dye reagent (Biorad protein assay 500 0006, diluted 1:5 with aqua dest) were added and the optical density was measured at 620 nm in a microplate reader (FLUOstar Galaxy). Bovine serum albumin (BSA, 0–3.5 µg per well) was run parallel as standard.
For enzyme assays the absorption of the supernatant was measured at four temperatures (10, 14, 18 and 24°C) in three aliquots with a microplate reader at 405 nm. Homogenates (2 µl/well) were assayed in 150 µl of 100 mM Tris–HCl buffer (pH 8.0), 10 µl 5 mM DTNB (5.5′-Dithio-bis-(2-nitrobenzoic acid)) and 4 µl Acetyl-CoA (20 mM). 4 µl Oxalacetat (20 mM) was added to start the reaction (omitted for the blanks). Standards of 0.5 mM Dithiothreitol DTT (5–40 µl per well) were run in parallel. The activity was expressed as the change of absorption per time and protein weight units (ΔA mingprt−1−1).
Statistical analyses
All data were tested with the Nalimov test to exclude outliers from analysis (Kaiser & Gottschalk, Reference Kaiser and Gottschalk1972). A general additive model (Hastie & Tibshirani, Reference Hastie and Tibshirani1990) was used to describe larval mass (µg C) as a function of time (t, days) and temperature (T, Kelvin):

where CBC is the Box–Cox transformed larval mass (Sokal & Rholf, Reference Sokal and Rohlf1981) and f(T) a function that models the temperature effect according to a normal distribution with mean MT, standard deviation SDT and skewing factor SKT. The latter was introduced to allow for asymmetric effects of temperatures above and below the optimum, as observed in many temperature tolerance studies (see e.g. Pörtner et al., Reference Pörtner, Berdal, Blust, Brix, Colosimo, Wachter, Giuliani, Johansen, Fischer, Knust, Lannig, Naevdal, Nedenes, Nyhammer, Sartoris, Serendero, Sirabella, Thorkildsen and Zakhartsev2001, Reference Pörtner, Storch and Heilmayer2005) and implied by the original data:


For the comparison of elemental composition of larvae of different females and temperature dependence of CS activity a one-way ANOVA was used. Post-hoc tests were conducted with the Student–Newman–Keuls method. C/N ratio data were transformed logarithmically prior to analysis in order to achieve a normally distributed data set.
RESULTS
Influence of temperature on larval development
Complete zoeal development occurred only at 14 and 15°C (Table 1; Figure 1). At 6°C, the Zoea I survived for up to 25 days without moulting to the Zoea II stage. At 10°C, first larvae moulted after 12 days to the Zoea II and survived only for another three days. Larvae reared at 14°C reached the Zoea V 33 days after hatching. At 18°C, larvae died already after 6 days in the Zoea II stage, and at 24°C they reached the Zoea III, dying ten days later.
The minimum duration of development through the ZI stage decreased with increasing temperature. This pattern can be described as a linear relationship between ln temperature and ln instar duration with the equation:

where D = time of development (days) and T = temperature (°C). Changes in W and CHN during the course of larval development are shown in Table 1.
Larval body mass (C in µg/ind) is predicted from day (t) and temperature (T in K) by the model

N = 463, F = 1599.51, R2 = 0.954, P < 0.001 for the whole model and each term with


using

this solves to

Note that this model predicts a larval mass for just any combination of time and temperature whereas our experiments indicate that the time × temperature space where larvae do exist is limited (see discussion). Figure 1 provides a plot of larval mass in the time × temperature space, where the ‘unrealistic’ range has been shadowed. The residual plot (Figure 2) indicates that the model fit the data quite well up to about 40 µg C, but severely underestimates larval mass >50 µg C. At the upper threshold temperatures in higher instars, changes in carbon values were generally lower than predicted by the model (see Figure 2). Further increase or decrease in temperature cause death of the larvae. To give an example: at 6°C larvae did not moult and die after 25 days; at 24°C, carbon values in the Zoea III are much lower than they were predicted by the model (also compare Table 1), e.g. 20°C, and the larvae died before reaching the Zoea IV. According to the model, the final Zoea V body mass of 60 µg C observed at 16°C would be obtained after 36 days at 18°C, which already lies outside the realistic assumption, and would be unattainable at temperatures <= 10°C.
Residual by predicted plot from the model predicting larval growth: plot of regression residuals versus predicted values. The plot does not indicate a problem with the model.

Citrate synthase activity (CSA)
Activities of citrate synthase (CS) in C. pagurus larvae measured at four different temperatures are shown in Figure 3. Larvae of all acclimation temperatures show lowest activity levels at 10°C assay temperature. 14°C acclimated larvae show the highest activity at all assay temperatures. 18°C acclimated larvae show no significant differences over the whole measured temperature range. Significantly higher CSA rates compared to larvae at hatching are only observed at 14°C assay temperature.
Citrate synthase activity (U * g Prot−1) of Cancer pagurus larvae acclimated to three different temperatures (light grey bars—10°C acclimated; white bars—14°C acclimated; dark grey bars—18°C acclimated) compared with larvae immediately after hatching (black bars). Bars within an assay temperature not connected with the same letter are significantly different (P > 0.05).

Variability in initial larval body mass among broods
Female carapace width (CW), larval body weight (W) and elemental composition (CHN) are compared in Table 2. Initial body mass and elemental composition of freshly hatched Zoea I larvae varied significantly among the eight females (Table 3) without showing a clear pattern between larval energy provisioning and female size. For example, females B and D had the same CW, but larval W and C, H, and N contents differed significantly.
Cancer pagurus. One-way ANOVA to evaluate the maternal influence on body mass (as dry weight (W), carbon (C), and nitrogen (N)]) and C:N ratio of freshly hatched larvae (first day of the hatching period 1). *, ANOVA on ranks because equal variance test failed.
DISCUSSION
Larval development of C. pagurus of the Helgoland population up to Zoea V is achieved within a narrow temperature window (15–16°C) only. Below and above this window we see initial development that completes stages Zoea I to Zoea III, depending on temperature. Zoea I development times indicate a positive temperature effect on larval growth up to 24°C, too. Our predictive model captures this feature quite well, indicating that optimum temperature should be around 22°C. Hence, what causes the failure of larval development outside the 15–16°C window? Obviously, this is not a straightforward temperature effect on metabolism, e.g. through cellular oxygen deficiency beyond Pejus temperatures as postulated by Pörtner (Reference Pörtner2001). Additionally, reduced feeding activity at cold temperatures can result in insufficient ingestion rates, while at high temperatures higher maintenance costs cannot be compensated (Dawirs & Dietrich, Reference Dawirs and Dietrich1986; Anger et al., Reference Anger, Lovrich, Thatje and Calcagno2004; Heilmayer et al., Reference Heilmayer, Thatje, McClelland, Conlan and Brey2008). We hypothesize that the transition from one stage to the next is the phase of failure. Either, energy investment and thus oxygen demand is distinctly enhanced during transition from one stage to the next, and/or the complex metamorphotic process by itself is more temperature sensitive, as it has long been known that ecdysis is the critical point in the development of decapod larvae (Anger, Reference Anger2001).
The residual plot (Figure 2) shows a general good fit of the model (i.e. random distribution of residuals) and slightly lower carbon values in higher instars (Z V) than predicted by the model (Figure 2), which might be due to problems during metamorphosis to the megalopa stage. It is known that larvae are able to postpone their metamorphosis to the megalopa stage if the cue for the suitable habitat cannot be detected (Krimsky & Epifanio, Reference Krimsky and Epifanio2008), but the enduring lack of those cues cause stress and the depletion of resources.
Changes in the kinetic characteristics of enzymes reflect differences in metabolic regulation and are inevitably involved in adaptation and acclimation to ambient temperature (Wells et al., Reference Wells, Lu, Hickey and Jeffs2001; Somero, Reference Somero2005). A decrease in CS activity is a strong indication for metabolic reduction. In C. pagurus CSA decreases with increasing enzyme assay temperature, indicating an optimum temperature at 14°C. The generally lower citrate synthase activity, i.e. lower aerobic capacity, of 18°C larvae over the whole measured temperature range indicate that acclimation to above-optimum temperatures cannot be compensated. The compensation over certain temperature ranges has been reported for several fish and crustaceans (e.g. Salomon & Buchholz, Reference Salomon and Buchholz2000; Lannig et al., Reference Lannig, Eckerle, Serendero, Sartoris, Fischer, Knust, Johansen and Pörtner2003; Lemos et al., Reference Lemos, Salomon, Gomes, Phan and Buchholz2003).
No complete larval development was observed in our laboratory experiments at 18°C, although this is a temperature which larvae may encounter in Helgoland waters during summer. Only little information is available about the southern distribution boundaries, where larvae should encounter much warmer water temperatures. There is evidence for a northern expansion of this species in Norway (Woll et al., Reference Woll, van der Meeren and Fossen2006), probably indicating that warming of the ocean drives an expansion if not shift of the geographical range of C. pagurus towards the northern North Sea (see also Wiltshire & Manly, Reference Wiltshire and Manly2004). It is thus necessary to determine the significance of the temperature tolerance window of this species for its distribution boundaries more accurately.
In this context it might be important to recognize that initial larval biomass at hatching varied significantly within our small sample size (N = 8) but without statistically significant correlation between female size and the body mass of freshly hatched Zoea I. However, it must be taken into consideration that our data (12.5–17.1 cm CW) do not cover the whole size-range of mature females and thus future study investigating the full range of female maturity (11.5 to 19 cm; Neal & Wilson, Reference Neal and Wilson2004) may come to a different conclusion. Energy allocation of females into offspring may be controlled by genetic disposition (Reznick, Reference Reznick1981), size (DeMartini et al., Reference DeMartini, DiNardo and Williams2003), temperature (Fischer & Thatje, Reference Fischer and Thatje2008), or the nutritional status of the female (Bernardo, Reference Bernardo1996). A positive relationship between maternal size and offspring size has been observed in both invertebrates (Marshall & Keough, Reference Marshall and Keough2004) and vertebrates (Birkeland & Dayton, Reference Birkeland and Dayton2005), but not universally. Among crustaceans, there are species that show such a relationship, e.g. the xanthoid crab Pseudocarcinus gigas (Gardner, Reference Gardner1997), but also other species not following this pattern, e.g. the American lobster (Homarus americanus) (Ouellet & Plante, Reference Ouellet and Plante2004).
Future studies covering the full size-range of mature C. pagurus need to reveal whether intraspecific variability in energy offspring is a matter of individual variability in female fitness and/or a female size related trade off. Intraspecific variability may also affect larval fitness and survival and thus a future large-scale study is needed to reveal whether the herein reported temperature tolerance pattern for larvae from a single female can be easily translated into populations and consequently management approaches of this species.
ACKNOWLEDGEMENTS
We would like to thank U. Nettelmann for help with the larval culture maintenance and K. Bickmeyer for CHN-analyses. This study was partially conducted in the frame of the EU-project CENSOR (Climate variability and El Niño Southern Oscillation: Impacts for natural coastal resources and management) (Contract No. 511071) and is CENSOR publication No. 0309 with additional support by the Marine Biodiversity and Ecosystem Functioning Network of Excellence MarBEF (Contract No. GOCE-CT-2003-505446) of the FP6.



