I. INTRODUCTION
Similar to dislocations in crystalline materials, shear bands are the major plasticity carriers in metallic glasses which control the yielding, even fracture. Reference Schuh, Hufnagel and Ramamurty1,Reference Greer, Cheng and Ma2 Despite the vital importance, the nature of shear banding in metallic glasses has not been completely understood. The shear banding process can be separated into the initiation stage (the formation of across-the-sample shear band) and the subsequent gliding stage (the shear slip along the shear band). Reference Cao, Cheng and Ma3,Reference Cheng, Han, Li and Ma4 The initiation of a shear band has long been ascribed to work softening or shear thinning. Reference Polk and Turnbull5 Structural disorder inside the shear band was predicted to be the origin of the work softening, instead of thermal softening. Reference Polk and Turnbull5 This notion was supported by experiments Reference Pampillo6–Reference Zhang and Greer9 and atomic simulations. Reference Shi and Falk10,Reference Shimizu, Ogata and Li11 Specifically, the structural disorder has been characterized as the break down of the local stable clusters or the short-range order Reference Cao, Cheng and Ma3,Reference Shi and Falk10,Reference Shi and Falk12,Reference Cheng and Ma13 in atomic simulations.
During the subsequent gliding stage, the shear band endures high local shear strain under extremely high rate, which can lead to temperature rise, Reference Cheng, Han, Li and Ma4,Reference Lewandowski and Greer8 void formation, Reference Jiang, Pinkerton and Atzmon14–Reference Spaepen18 and final fracture. Reference Greer, Cheng and Ma2,Reference Shimizu, Ogata and Li19 The transient dynamics shear band experiences also depend on the material properties and the machine stiffness. Reference Cheng, Han, Li and Ma4,Reference Klaumünzer, Maaß and Löffler20,Reference Song and Nieh21 Multiple remarkable scaling behaviors discovered in the flow state Reference Liu, Liu, Wang, Inoue, Sakurai and Chen22–Reference Langer and Manning24 indicate that the shear banding can be considered as a mechanically driven glass-to-liquid transition. It should be also noted that this liquid-like state of the shear band appears to be weakly dependent on the quenching history of the glass. Reference Shimizu, Ogata and Li11,Reference Shi, Katz, Li and Falk25
Despite the above recent advances in understanding the shear band, the local stress state in the running shear band (RSB), a shear band that is in the flow state, has not been clearly understood. Reference Greer, Cheng and Ma2 Experimentally, it is generally difficult to examine the local stress state in the RSB in experiments due to the limited spatio-temporal resolution. Reference Greer, Cheng and Ma2,Reference Spaepen26 Among the existing theoretical or simulation studies, Reference Cheng, Han, Li and Ma4,Reference Murali, Narasimhan, Guo, Zhang and Gao27 it is commonly assumed that the hydrostatic stress and shear stress in the RSB are different from the rest of the sample, without direct measurements of the full stress tensor. However, the complete knowledge of the stress state is essential to develop any plasticity theory involving the description of shear banding. Particularly, the thermomechanical evolution of the RSB sensitively depends on its stress state. Here, we aim to systematically investigate the stress state of a shear band, once it reaches the mechanically driven flow state.
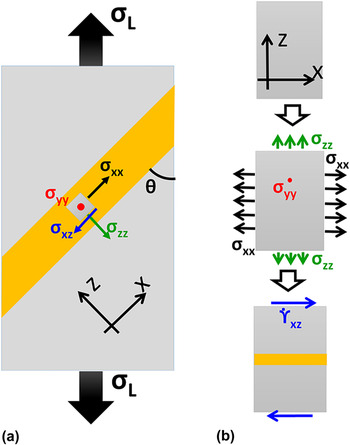
In this study, we conducted molecular dynamics (MD) simulations to examine the stress state of the RSB in a number of distinct model glasses. MD simulation was used, as it can provide the necessary spatio-temporal resolution to resolve the shear banding process. The shear band features a timescale around nanoseconds Reference Lewandowski and Greer8 and a thickness in the order of nanometers. Reference Fujita, Okamoto, Nishiyama, Yokoyama, Kimura and Inoue28 We used two types of simulation methods: large-scale simulations to study the stress state during the realistic transient evolution of the shear band under uniaxial tension tests and small-scale simulations to examine the RSB under more general loadings. We found that the local stress state in the RSB in all of the studied model metallic glasses (except the FeP and the amorphous Si system) exhibits liquid-like hydrostatic plus shear (HS) stress state in which the pure shear stress is nonzero, and all three normal stresses equal to each other in the shear band coordinate (see Fig. 1). The HS stress state is attained regardless of the loading conditions and the temperature. Note that the third invariant of the HS stress state is zero, indicating that the stress state of the RSB is fundamentally changed by the shear flow and cannot be achieved by merely rotating the coordination system. The results support the notion that the shear banding is a form of shear-driven glass-to-liquid transition in metallic glasses.
The schematic illustration of the simulation setups. (a) The uniaxial loading mode for large-scale PSL tests in which the shear band is illustrated by the yellow region. The angle of the shear band away from the loading is θ. Note that σL can be compressive or tensile. (b) A simplified simulation setup for the small-scale simulations. The sample is first loaded in a general stress state with controlled normal stresses. Subsequent simple shear deformation to a large strain is applied to drive a shear band under the condition of fixed volume.

II. SIMULATION SETUP AND METHODOLOGY
We aimed to explore the stress state in an across-the-sample RSB as illustrated in Fig. 1. Consider first, an across-the-sample shear band forms during a uniaxial test as illustrated in Fig. 1(a). Prior to the shear band formation, the local stress state should follow (assuming plane strain condition),
 $${\sigma _{zz}} = {\sigma _{\rm{L}}}{\sin ^2}\theta ,\;{\sigma _{xx}} = {\sigma _{\rm{L}}}{\cos ^2}\theta ,\;{\rm{and}}\;{\sigma _{yy}} = v{\sigma _{\rm{L}}}\quad ,$$
with θ to be the shear band angle with respect to the loading direction, v to be the Poisson's ratio, and σL to be the global tensile stress. Note that σL can be either compressive (expressed as negative values) or tensile (expressed as positive values).
We used two types of simulation setups to explore the stress state in a shear band. One type is the large-scale simulation with the perturbative static loading (PSL) method Reference Luo and Shi29 to directly examine the transient shear band stress state under uniaxial tension or compression tests. The PSL method has been used to study the tensile fracture of metallic glasses recently. Reference Luo and Shi29 Particularly, the shear band angle can be conveniently controlled, which allows us to study how the stress state of a shear band is affected by the shear band angle. The procedure of a PSL test (details can be found in Refs. Reference Murali, Narasimhan, Guo, Zhang and Gao27 and Reference Luo and Shi29) is briefly described as follows. We first subjected the glassy sample to a conventional uniaxial tension test to 5% of tensile strain. Then, the sample was replicated to the desired length and width. A shear band at an oblique angle is not affected by the periodicity because it travels through different portions of the replicas. Subsequently, two surfaces were created to allow sample gliding along the shear band. After that, we applied a heat pulse with 5 ps duration to perturb the local structure of a thin band region in which the shear band will later nucleate. Note that after the perturbation, the thin band was relaxed at its original temperature for another 5 ps. The property of the resulting RSB will not be affected by the details of how it is initiated, for its independence of its thermomechanical history. Reference Shimizu, Ogata and Li11 To avoid high loading speed in the sample, we kept the strain rate to be zero after the perturbation. The setup mimics an ideal displacement controlled uniaxial loading under zero strain rate. Here, we applied the PSL test to the modified binary Lennard-Jones (mBLJ) Reference Shi, Luo, Yuan and Huang30 sample with the sample size of 120 × 2.7 × 360 nm3 under 5% tensile strain. This model glass former, together with the other glass formers studied here, will be discussed later in this section.
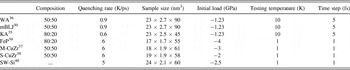
The second type of mechanical test is the small-scale simulation to probe the stress state of RSB under more general temperature and stress conditions, as illustrated in Fig. 1(b). We controlled the initial normal stresses σ zz and σ xx of the small slab according to Eq. (1). Different from the physical meaning of θ and σL in the context of uniaxial tension tests as illustrated in Fig. 1(a), in small-scale simulations, θ and σL should be considered as two free adjusting parameters that control the initial normal stresses of the small slab system shown in Fig. 1(b). Although the shear band angle observed in the experiment only ranges from 30 to 45° under compression and 45–60° under tension, Reference Gao, Wang, Bei and Nieh31 in the small-scale simulation, one can tune θ from 0 to 90° to explore initial stress states that are more general. We kept σL at a constant (see Table I) for a given glass, as it was found to have little effect on the attainment of HS stress state in the shear band. Consistent with the large-scale PSL test, the plane-strain condition was implemented in the small-scale tests. After the initial normal stress is stabilized, simple shear with constant strain rate was applied in the xz direction to drive the sample to form a shear band. During the simple shear deformation, the system was kept in a NVE (i.e., constant number of particles, constant volume, and total energy) ensemble. The tests under NVT (i.e., constant number of particles, total volume, and system temperature) ensemble will also be discussed. Temperature control and stress control used in the MD simulations follow the standard Nose–Hoover formulation Reference Nosé32,Reference Hoover33 with the temperature and pressure damping parameters set to be 1 in the corresponding time unit for each system (for LJ type of force fields, the time unit is 0.5 ps and for embedded atom method (EAM) or Si force fields, the time unit is 1 ps). The shear strain rate applied is 2 × 10⁸ s−1 for all systems. Periodic boundary conditions are present in all directions in the small-scale simulations.
The composition, the quenching rate, the sample size, the initial load σL, the testing temperature under NVT ensemble, and the time step used for the force fields used in this study. Here compressive stresses are expressed as negative values.

To explore the commonality among different model metallic glasses, we applied the small-scale simulations on six commonly used model metallic glasses and a model amorphous Si. It is interesting to point out that the model amorphous silicon has been explored as a metallic glass analog, which exhibits a number of behaviors including shear localization similar to those in metallic glasses. Reference Argon and Demkowicz34 The force fields used in this study include pair wise interaction as in the binary Lennard-Jones potential parameterized by Kob Anderson (KA), Reference Kob35 Wahnstrom (WA), Reference Wahnström36 and a modified version with an energy penalty (mBLJ), Reference Shi, Luo, Yuan and Huang30 many body potentials as in the widely used EAM potentials that describe CuZr Reference Mendelev, Sordelet and Kramer37 (developed by Mendelev et al., termed M-CuZr here) and CuZr Reference Cheng, Ma and Sheng38 (developed by Sheng termed S-CuZr here), and FeP Reference Ackland, Mendelev, Srolovitz, Han and Barashev39 and three body interaction (angular constraint) as in the Stillinger–Weber (SW) amorphous Si system. Reference Stillinger and Weber40 The simulation parameters for all these systems are listed in Table I. The as-quenched temperature is 10 K for the WA, mBLJ, and KA systems, 1 K for the three EAM systems, and the SW-Si system. We choose such low temperatures to demonstrate that high temperature is not necessary for the attainment of the HS stress state in the shear band.
To assess the local stress state in the shear band, we partitioned the glassy sample into thin bins with a thickness of about 1 nm. Note that each bin extends through the whole cross section and includes 2000 to 3000 atoms. The choice of the bin thickness allows us to resolve the shear band yet with sufficiently low fluctuations benefited from averaging. The bins extend parallel to shear band direction. First, virial stress (in energy units) is calculated for each atom without divided by atomic volume since the atomic volume in a glass is usually hard to define accurately. Then, the atomic stresses in each bin are summed and divided by the volume of the bin to yield the local stresses for each bin. The local stresses calculated in this way can be considered as the “bulk” value of a sample of a few thousand atoms. The local stresses are identical to the corresponding global components before the formation of the shear band. The bin with the highest local temperature, most likely in the middle of the RSB, is taken as a representative bin to represent the stress state of the RSB. All the simulations were performed using LAMMPS. Reference Plimpton41
III. SIMULATION RESULTS FROM THE mBLJ SYSTEM
The primary simulation results on the stress state inside the shear band will be described below for the mBLJ system. First, we used the large-scale PSL tests to produce the shear band dynamically during zero strain rate uniaxial unloading. Then, we used the small-scale tests to investigate the stress state in RSB under a more general stress state. In both situations, the shear band attains the liquid-like HS stress state.
A. Large-scale simulation in the mBLJ system
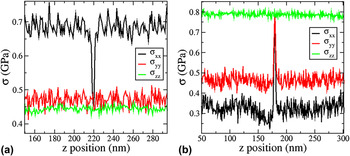
We directly examined the stress state of a shear band under uniaxial tensile loading in the PSL tests. Similar observations have been made in compressive PSL tests. The shear band angle was tuned by controlling the angle of perturbation within the range from 39° to 57°. Before the shear band nucleates and grows across the sample, the normal stress is uniform throughout the sample. As soon as an across-the-sample shear band forms, the HS state is attained in the shear band as shown in Fig. 2. It is interesting to note that when the shear band angle is lower than 45° in Fig. 2(a), the hydrostatic stress in the RSB is lower than the rest of material. This is different from the situation in the confined shear band at the crack tip, Reference Murali, Narasimhan, Guo, Zhang and Gao27 which will be discussed in details later (Sec. IV. D). When the shear band angle is higher than 45°, the hydrostatic stress is elevated above the rest of the material as in Fig. 2(b). The common feature in Figs. 2(a) and 2(b) is that σ zz stay uniform inside and outside the shear band, thus maintaining mechanical equilibrium perpendicular to the shear band. Moreover, σ zz is equal to the magnitude of the hydrostatic stress, which dictates the value of σ xx and σ yy in the shear band. Importantly, the hydrostatic stress in the shear band can be easily calculated as,
 $${\sigma _{{\rm{hydrostatic}}}} = {\sigma _{zz}} = {\sigma _{\rm{L}}}{\sin ^2}\theta \quad .$$
The local normal stress distribution along the z direction in PSL tests under tensile loading, once a shear band forms across the mBLJ sample with θ = 39° in (a) and θ = 57° in (b).

Here, the dynamical effect of shear band formation and associated elastic waves are neglected. From Eq. (2), the hydrostatic tensile stress inside the shear band sensitively depends on the shear band angle, which may contribute to the generally larger than 45° tensile fracture angle observed in experiment. Reference Gao, Wang, Bei and Nieh31 For instance, once the shear band angle under uniaxial tension increases from 45° to 60°, Reference Gao, Wang, Bei and Nieh31 the tensile hydrostatic stress in the shear band increases by 50%.
B. Small-scale simulation in the mBLJ system
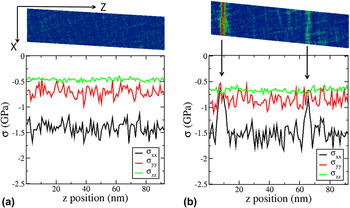
Small-scale simulation enables one to study the stress state in RSB under more general initial stress state. The initial stress state is set using Eq. (1). We set σL to be compressive (see Table I) to achieve extensive shear loading without the complication of cavitation. Reference Luo and Shi29 During the small-scale simulation, the system was kept in a NVE ensemble. Figure 3 shows the stress distribution as a function of z positions (in the direction perpendicular to the shear band) with a spatial resolution of 1 nm. Prior to the formation of the shear band, the local stress distribution along the z direction is uniform with atomic fluctuation as shown in Fig. 3(a). Immediately after the shear band forms as shown in Fig. 3(b), the local normal stresses of σ xx , σ yy , and σ zz in the shear band become equal to each other, indicating that the shear band becomes liquid-like. Similar to the large-scale simulation, σ zz is uniform across the sample even after the formation of the shear band. However, the shear band region exhibits differences in the σ xx and σ yy distributions compared to other regions.
The deformation morphologies (colored by atomic shear strain, with blue corresponding to 0 strain, and red corresponding to a strain of 20% and above) and the corresponding local normal stress distribution along the z direction before (a) and after (b) shear band formation in the mBLJ model glass. The applied shear strain is 6 and 8% in (a) and (b), respectively. The θ parameter is set to be 0°. The local normal stresses become equal to each other at the location where the shear bands formed as are indicated by the arrows.

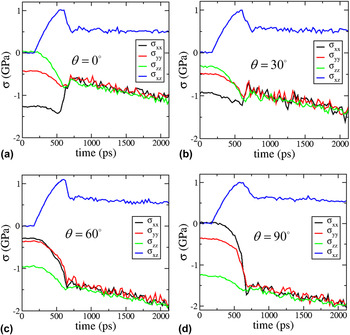
To understand the robustness of the HS stress state inside the shear band, we then analyzed the local stress evolution of the shear band as a function of time. Particularly, how the HS stress state varies with respect to the applied shear flow. Here, the stress state is controlled by the θ parameter using Eq. (1), ranging from 0° to 90°. As shown in Figs. 4(a)–4(d), the shear stress exhibits an overshoot and then drops to the shear flow stress, indicating shear band formation. Shortly after the three normal stresses merge together, thus the HS stress state is achieved. In addition, we set σL to be tensile and also observed the HS stress state in the shear band. Therefore, the shear band will be in a HS stress state independent of the initial normal stress state. The simulation results from the small-scale simulations show the HS stress state inside a shear band, consistent with the observations obtained from the large-scale PSL tests.
The evolution in time of the local stress at the location where the shear band forms in the mBLJ model glass under NVE ensemble with the parameter θ set from 0° to 90° in (a) to (d). The local HS stress state was achieved when the shear band forms, independent of θ. The magnitude of the normal stresses during shearing keeps increasing due to increasing temperature in the shear band under NVE ensemble.

IV. DISCUSSIONS
A. The effect of temperature
To comprehend the HS stress state inside the shear band, one would immediately link to the local temperature rise inside the shear band. Both the small-scale and large-scale simulations are under NVE ensemble. Therefore, the temperature inside the shear band can rise as high as 200 K. It should be noted, however, such temperature is still much lower than the glass transition temperature, which is measured to be 680 K for the mBLJ system.
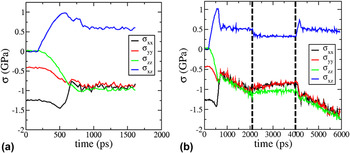
To identify the effect of temperature on the stress state of the shear band, we repeated the small-scale simulation while keeping the average temperature of the whole system at 10 K in a NVT ensemble. We have also conducted simulations with local temperature controls where the peak temperature in the RSB is only around 20 K. The results are essentially the same. As shown in Fig. 5(a), the HS stress state is again attained in the RSB. The only difference here is that the compressive hydrostatic stress stays constant, instead of increasing continuously due to an increasing temperature as shown in Sec. III. B (Fig. 4). Therefore, the HS stress state is not due to the temperature rise in the shear band.
The evolution of the local stresses at the location where the shear band forms in the mBLJ model glass under the NVT ensemble with the temperature to be 10 K. Representative result with the θ parameter to be 0° is shown. (b) As a continuation of the tests in Fig. 4, relaxation without any deformation (thus aging) is conducted from 2.1 to 4 ns, as is indicated by the dashed line. After 4 ns, the shear deformation is resumed. Representative result with the θ parameter to be 0° is shown. The magnitude of the normal stresses during shearing keeps increasing due to increasing temperature in the shear band under NVE ensemble.

B. The effect of shear flow
To assess the effect of shear flow on the HS stress state in the shear band, we continued the small-scale simulation in Sec. III. B without shearing for 1.9 ns. Thus, one can investigate the effect of aging (by stopping the shear flow) on the stress state of the shear band. As can be seen in Fig. 5(b), the shear stress drops only slightly before leveling off, indicating that the shear band can sustain shear stress under zero strain rate. Without shear flow, the three normal stresses of σ xx , σ yy , and σ zz begin to deviate from each other. After the holding period, shear on the system resumes for another 2 ns. The shear stress of the system overcomes a yield stress, lower than the initial one, probably due to the combination of softer shear band and higher temperature. Then the system enters the flow state. The HS stress state again emerges in the shear band. This result suggests that the HS stress state is resulted from the driven shear flow. Deviation from the HS stress state of the shear band is expected once the shear flow stops.
C. The effect of different glass formers
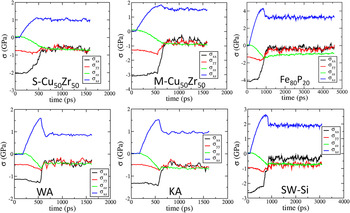
We also conducted small-scale tests on the other six aforementioned glass formers: KA, WA, FeP, M-CuZr, S-CuZr, and SW-Si. Representative results are shown in Fig. 6. Except in the FeP system and the SW-Si system, the HS stress state is achieved within the atomic fluctuation in the shear band for all the glass formers. It is interesting to note that although the atomic structure of shear bands of SW-Si is close to its liquid structure, Reference Argon and Demkowicz34,Reference Demkowicz and Argon42 the deviation from HS state in the RSB of SW-Si indicates that subtle differences exist between RSBs and the liquid state in SW-Si.
The evolution in time of the local stresses at the location where the shear band forms for the labeled force fields. The simulations are kept under the NVT ensemble with very low temperature listed in Table I. Representative results with the θ parameter to be 0° are shown. The local HS stress state was achieved within atomic fluctuation in all these glasses when the shear band forms except in the FeP system and the SW-Si system.

In the Fe80P20 glass, σ xx and σ yy elevate above σ zz in the shear band. One feature of the Fe80P20 model glass is that the system exhibits strong phase segregation, which is in fact intended in the design of the force field. Reference Ackland, Mendelev, Srolovitz, Han and Barashev39 Therefore, exception in the FeP system might be related to the strong tendency for chemical ordering driven by phase segregation.
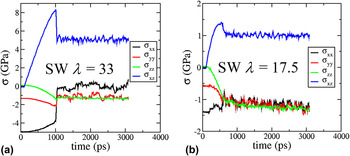
Albeit served as a metallic glass analog, Reference Argon and Demkowicz34 the SW-Si is in fact a covalent system that features a strong angular constraint that controls the rigidity of the local tetrahedral bonding angle. Reference Stillinger and Weber40 The angular constraint can be tuned by one parameter, λ Reference Shi, Luo, Yuan and Huang30,Reference Molinero, Sastry and Angell43 which scales the energy penalty for bond angles deviating from 109°. A larger λ corresponds to a stronger angular constraint or directionality in bonding. Therefore, one can conveniently tune λ to test whether the angular constraint has any effect on the stress state in the RSB. For Si, λ is set to be 21 according to the original force field by Stillinger and Weber. Reference Stillinger and Weber40 For a smaller λ equal 18.75, the corresponding less-covalent solid can be considered as a hypothetical element intermediate between Ge and Sn. Reference Molinero, Sastry and Angell43 Conversely, tuning λ up is qualitatively tuning silicon toward carbon. In the additional simulations, we modified λ to be 17 and 33. As shown in Fig. 7, for λ of 33, the local stress in the shear band σ xx deviates from σ zz even more than the SW-Si shown in Fig. 6. However, for λ of 17, the HS state is attained in the shear band. Thus, the force tuning method demonstrates that the deviation from HS stress state in the shear band of SW-Si system is caused by the strong angular constraint or directionality in bonding.
The evolution in time of the local stresses at the location where the shear band forms in simulations with the θ parameter to be 0° for the SW-Si system with modified angular constraint. The simulations are kept under the NVT ensemble with the temperature at 1 K. The slight increase in the magnitude of the hydrostatic stress in (b) is due to the fast shear band thickening, which grows from 4 to 12 nm during the simulation.

D. The effect of plastic confinement
It is worth noting the possible differences between an across-the-sample RSB and a confined static shear band at the crack tip. For the former case, the magnitude of the hydrostatic stress is angle dependent, which is different from the shear band at the crack tip Reference Murali, Narasimhan, Guo, Zhang and Gao27 where an elevated level of hydrostatic stress was proposed to prevail based on plastic flow confinement Reference Varias, Suo and Shih44–Reference He, Evans and Hutchinson46 from conventional mechanics. It can be further seen that the HS stress state observed here in the RSB cannot be fully explained by plastic confinement. First, the plastic confinement can only elevate the hydrostatic stress but cannot dictate the three normal stresses to be equal to each other. In addition, the plastic confinement cannot predict the magnitude of hydrostatic stress to be lowered with the angle of the across-the-sample shear band being smaller than 45° [Fig. 2(a)]. Moreover, if the stress state is controlled by the plastic flow confinement, then the aspect ratio of the shear band will have a strong effect on the magnitude of the hydrostatic stress in the shear band. Reference He, Evans and Hutchinson46 However, as in both the small-scale simulation and large-scale PSL simulation, we did not observe such aspect ratio effect. Therefore, the HS stress state in the across-the-sample RSB should be a result of atomic structural transformation, Reference Shimizu, Ogata and Li11,Reference Shi and Falk12,Reference Shi and Falk47 that is, beyond the scope of conventional mechanics.
V. CONCLUSIONS
We examined the local stress state of the across-the-sample RSB in seven different amorphous solids in MD simulations. Our finding suggests that the HS stress state in RSB might be universal to metallic glasses but not for systems with a tendency to phase segregate or systems with high covalency. The HS stress state is originated from the shear flow induced structural transformation (disorder) instead of the elevated temperature, special initial stress state, or the plastic confinement effect. Since the HS stress state is the property of a dynamic shear band, it will disappear once shear stops (for instance, it may not be applicable to the stopped shear bands formed under indentation) and is independent of the quenching history. Such liquid feature of the stress state supports the notion that shear banding is like a shear-driven glass-to-liquid transition. An important insight can be obtained for RSBs: the magnitude of the hydrostatic stress in the RSB of metallic glasses can be calculated based on σ zz . In uniaxial tests, it is σLsin2θ, where σL is the magnitude of the uniaxial loading, and θ is the angle of the shear band to the loading direction.
ACKNOWLEDGMENTS
We thank the support from the National Science Foundation-United States (NSF) under grant DMR-1207439, XSEDE under award TG-DMR130089, and the Center for Computational Innovations (CCI) at Rensselaer Polytechnic Institute.