INTRODUCTION
Frontotemporal lobar dementia (FTLD) is a progressive neurodegenerative disorder that is almost as common as Alzheimer’s disease (AD) in individuals younger than 65 years (Knopman, Petersen et al., Reference Knopman, Petersen, Edland, Cha and Rocca2004; Mesulam, Reference Mesulam1982; Ratnavalli et al., Reference Ratnavalli, Brayne, Dawson and Hodges2002; Rosso et al., Reference Rosso, Kaat, Baks, Joosse, de, Pijnenburg, de Jong, Dooijes, Kamphorst, Ravid, Niermeijer, Verheij, Kremer, Scheltens, van Duijn, Heutink and van Swieten2003). Diagnostic refinements such as progressive aphasia or disorder of personality and social comportment promise new insights into disease mechanisms (Grossman, Reference Grossman2002; Neary et al., Reference Neary, Snowden, Gustafson, Passant, Stuss, Black, Freedman, Kertesz, Robert, Albert, Boone, Miller, Cummings and Benson1998). Regrettably, clinical diagnostic accuracy for FTLD remains challenging, with significant overlap being demonstrated with other degenerative dementias on postmortem assessment, suggesting that this promise remains elusive (Kertesz et al., Reference Kertesz, McMonagle, Blair, Davidson and Munoz2005; Knopman et al., Reference Knopman, Boeve, Parisi, Dickson, Smith, Ivnik, Josephs and Petersen2005; Litvan et al., Reference Litvan, Agid, Sastrj, Jankovic, Wenning, Goetz, Verny, Brandel, Jellinger, Chaudhuri, McKee, Lai, Pearce and Bartko1997). This has motivated the search for biomarkers from modalities such as clinical neuroradiology, which have regrettably yet to yield definitive diagnostic criteria (Clark et al., Reference Clark, Charuvastra, Miller, Shapira and Mendez2005; Frisoni et al., Reference Frisoni, Laakso, Beltramello, Geroldi, Bianchetti, Soininen and Trabucchi1999; Galton et al., Reference Galton, Patterson, Graham, Lambon-Ralph, Williams, Antoun, Sahakian and Hodges2001; Talbot et al., Reference Talbot, Lloyd, Snowden, Neary and Testa1998).
Nevertheless, the potential of neuroimaging has been supported in part by reports correlating atrophy in each FTLD subgroup with distinct performance profiles on measures of cognition and behavior (Grossman et al., Reference Grossman, McMillan, Moore, Ding, Glosser, Work and Gee2004; Mummery et al., Reference Mummery, Patterson, Price and Hodges2000; Williams et al., Reference Williams, Nestor and Hodges2005) and by anatomic distribution of disease burden determined by autopsy (Grossman et al., Reference Grossman, Libon, Forman, Massimo, Wood, Moore, Anderson, Farmer, Chatterjee, Clark, Coslett, Hurtig, Lee and Trojanowski2007). Given the limitations of clinical diagnosis as a principle of organization, we propose to depart from it, resorting in its stead to principles from lesion analysis. As opposed to a priori subgrouping of participants by clinical diagnosis, we have assigned a heterogeneous patient population with degenerative dementia to subgroups according to the participant’s quantitatively determined pattern of cortical atrophy (Listerud et al., Reference Listerud, Troiani, Moore and Grossman2007).
The object of this manuscript was to validate these neuroanatomically defined subgroups. We hypothesize that the participant’s particular pattern of cortical atrophy, determined a priori and by automated procedure, will account for a specific pattern of deficits on neuropsychological testing. Furthermore, we hypothesize that these deficit patterns will comport with known brain–behavior relationships from the literatures on focal brain lesions and functional imaging.
Patient Subgroups Defined by Predominant Location of Cortical Atrophy
A complete description of the development of our automated assignment procedure is beyond the scope of this manuscript, but a brief description is included here (Listerud et al., Reference Listerud, Troiani, Moore and Grossman2007). To begin, voxel-based morphometry (VBM) and a standard Brodmann Area (BA) atlas were used to measure cortical atrophy per subject per BA. We have made use of the fact that the severity of cortical loss in degenerative dementia guarantees that adequate statistical significance is a matter of course with a target group as small as a single individual. This is a novel circumstance, and although VBM has previously been used on groups of dementia patients (Grossman et al., Reference Grossman, McMillan, Moore, Ding, Glosser, Work and Gee2004; Mummery et al., Reference Mummery, Patterson, Price and Hodges2000), to our knowledge, this fact has not previously been exploited.
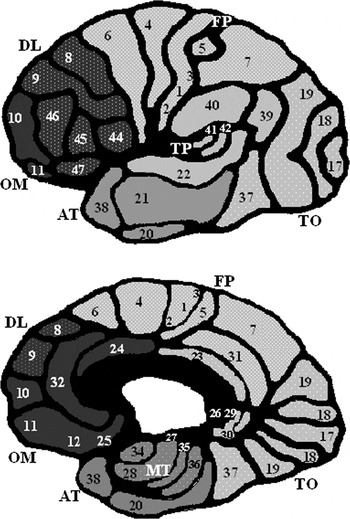
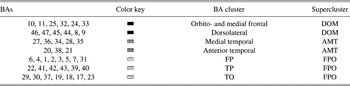
The second step in our procedure is to use “seriation” to obtain a hierarchical classification within BAs and within our patient population. The clustering of BAs is described in Figure 1, and Table 1 lists the nomenclature for the BA clusters to which we will refer throughout the remainder of the manuscript.
BA clusters. Clusters of BAs defined by the seriation process, in which similarity is based on correlation of cortical loss among BAs, are indicated here (see Table 1 for labels). These clusters may be nested within less tightly correlated BA “superclusters” as indicated here by similar shading. Compare here, for example, the TP BA cluster and the TO cluster, both nested within the FPO supercluster. This figure is adapted from Kolb and Whishaw (Reference Kolb and Whishaw1995).

BA clusters

Note
This table provides the key for the figures in this manuscript and for the definition of acronyms used throughout the manuscript. Dark gray signifies the dorsolateral/orbital/medial frontal (i.e., prefrontal) cortices, abbreviated here as “DOM.” AMT cortices are colored medium gray. Light gray indicates the primary and secondary motor cortex, parietal cortex, and occipital cortex, abbreviated “FPO.”
In its most intuitive form, as in Piaget’s (Reference Piaget, Hodgson and Gattegno1998) description of cognitive development of numerical skills in childhood, seriation is simply the careful sorting of items into an ordered series by placing like with like, in hopes that a pattern will emerge. As a technique for “preliminary” or “exploratory” data analysis, it was being used in archaeology over 100 years ago in the preliminary analysis of very large tabulations of artifacts and their features (Petrie, Reference Petrie1899). Though seriation has not, to our knowledge, found previous application in medical imaging literature, it is a fully developed methodology with well-established theoretical underpinnings (Climer & Weixiong, Reference Climer and Weixiong2006; Gluck, Reference Gluck2001; Kendall, Reference Kendall1975).
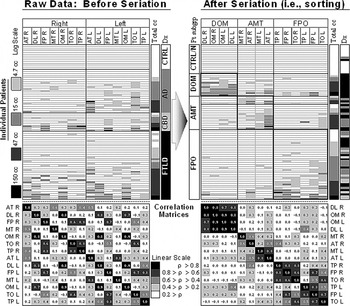
This section will provide a very brief introduction by examining the initial triage point in our patient-sorting algorithm. Our starting point is the “low-resolution” table (Figure 2) of cortical atrophy per BA cluster (14 columns; Table 1) per subject (75 rows). Coloration of data cells according to their contents suggests our “Before” table is random. Our first task is to identify “similar” columns, aided by the corresponding correlation matrix. In a well-sorted table, two strongly correlated (i.e., similar) columns should be listed close to each. Consequently, the cell corresponding to this pair of columns must appear close to the diagonal of the correlation matrix; coloration reveals these relationships at a glance.
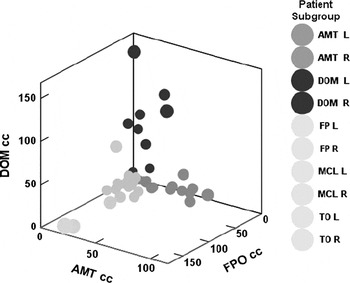
Successful seriation not only groups “like” columns but also exposes the boundaries between dissimilar groups; the top hierarchy of our algorithm has emerged in the sorted raw data table (i.e., “After,” Figure 2): dorsolateral/orbito-medial (DOM), anterior and medial temporal (AMT), and fronto-parieto-occipital (FPO). A similar sorting of the rows (i.e., subjects) shows each BA supercluster to be associated with a participant subgroup in a simple way, leading us to the observation that there is very little overlap between these three patterns of cortical atrophy. Figure 3 portrays this same information in another way. Here, subjects are plotted according to their total cortical atrophy on three dimensions: cubic centimeters (cc) of atrophy in DOM supercluster, AMT, and FPO. Virtually, all subjects lie along one axis; each axis defines a separate subgroup.
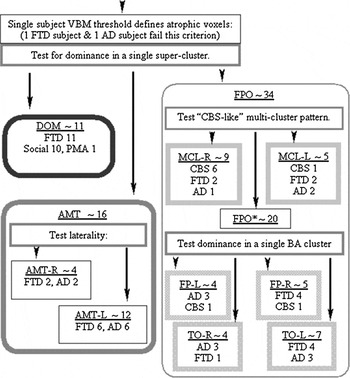
This sorting process suggests a simple algorithm: partition all patients with degenerative dementia according to the cluster containing the maximum cortical atrophy. This rule appeared to hold throughout our population, with the exception of the corticobasal syndrome (CBS) subjects. Their handling was motivated by the observation of a distributed, bilaterally asymmetric “multicluster” (MCL) pattern of cortical atrophy confined to the parieto-occipital supercluster but involving contralateral clusters {e.g., MCL_Left ~ [temporooccipital (TO)_Left, temporoparietal (TP)_Left, and frontoparietal (FP)_Right]}. Based on this observation, a specific MCL pattern of cortical loss was defined that, with two exceptions, captured all CBS patients. Figure 4 describes the algorithm derived from the seriation process by which participants were partitioned according to each participant’s pattern of atrophy.
Example of seriation at the top level of hierarchy. In its simplest meaning, seriation refers to a careful sorting, putting like with like. In this example, the raw data on cortical atrophy per BA cluster (column) and per patient (row) are tabulated before and after seriation (see Table 1 and Figure 1 for definition of BA clusters). In the “Before” table, regions are listed alphabetically, and subjects are listed first by clinical diagnosis and then by total cortical atrophy within the diagnostic group. Both the total cortical atrophy and the raw data cells are shaded according to the log scale shown on the far left. The diagnosis columns for each table follow the same key, which is self-explanatory for the “Before” table. Before sorting, a data table may appear to be random. Computing a correlation matrix for the corresponding column order can facilitate sorting, as a high correlation value flags similar columns. Thus, for a well-sorted raw data table, cells in the corresponding correlation matrix containing such high values should only appear close to the diagonal. Coloration of the correlation matrix (here following a linear scale) facilitates the observation of three major groupings of columns: the DOM region, the AMT region, and the FPO region (Figure 1; Table 1). If we now sort the rows as well, we discover that patients in this study apparently fall into three major subgroups, one corresponding to each of these three neuroanatomic regions. (A fourth subgroup primarily composed of the control subjects is also tabulated; two patients with no atrophy as measured by our procedure were also assigned to this group and were excluded from further analysis.) The low correlation values for columns belonging to different regions suggest minimal overlap in the distribution of cortical atrophy between these patient subgroups. In other words, an individual in the AMT subgroup, with cortical atrophy predominantly in the AMT region, has little to no atrophy in either the DOM or the FPO regions. Figure 3 displays this fact in a more direct way.

Example of seriation at the top level of hierarchy. Prompted by the results of the seriation from Figure 2, we may plot the position of each subject in three dimensions according to the absolute cortical atrophy (in cc) in the DOM region, the AMT region, and the FPO supercluster (Table 1; Figure 1) (cc of atrophy in DOM, AMT, and FPO). We observe that virtually all subjects exhibit significant atrophy in only one supercluster. Consequently, each plotted point lies along one of these axes, suggesting each axis represents a distinct clinical subgroup. This is a restatement of the observation from the seriation in Figure 2 that there is very little overlap in the patterns of atrophy defining these three patient subgroups.

Algorithm for parsing patients based on neuroanatomic features. This figure portrays the simple algorithm suggested by seriation for partitioning patients into subgroups; this algorithm was defined, and this assignment was performed in a fashion blinded to the neuropsychological testing results. First, patients are parsed into the supercluster in which their predominant cortical loss occurs (see Table 1 for definition of acronyms). The rationale for this step is indicated in Figures 2 and 3. The DOM-dominant subgroup is uniformly composed of FTLD patients, and with one exception, all fall within the SOC/EXEC subgroup as shown here and in Figure 2 in the “Dx” column of the raw data table after sorting. The AMT-dominant subgroup is composed of an approximately equal number of FTLD and AD patients who are readily sorted into right and left dominance. The FPO-dominant subgroup contains CBS, FTLD, and AD patients. A MCL rule [e.g., MCL_Right~(TP_Right, TO_Right, and FP_Left)] has been proposed that successfully captures all but two of the CBS patients. Single-cluster dominance, similar to the supercluster partition rule, is observed in the remainder of FPO patients.

Seriation as a Preliminary Data Analysis Technique
Kendall (Reference Kendall1975) has warned that the results of a seriation must be taken as provisional, which the expert is then obligated “to refine with the aid both of his own professional judgement and of external information.” As a preliminary data analysis technique, it is by definition not a method for testing a hypothesis but, rather, a way to generate one. Thus, a proper seriation of cortical atrophy data would best be informed by a careful reading of texts such as Mesulam’s (Reference Mesulam and Mesulam2000b) Principles of Behavioral and Cognitive Neurology.
Mindful of Kendall’s (Reference Kendall1975) admonition, our seriation procedure was blinded to the results of neuropsychological testing. We then formulated the following “stand-alone” hypotheses for the degenerative dementias: (1) based on the patterns of cortical atrophy specified in Table 1, our partitioning algorithm will account for substantial variability in neuropsychological testing, and furthermore (2) the pattern of deficit for each pattern of atrophy will be compatible with known brain–behavior relationships. As such, we broadly intend to test our hypotheses against the “large-scale network” model derived from the lesion analysis and functional activation literatures.
METHODS
Participants
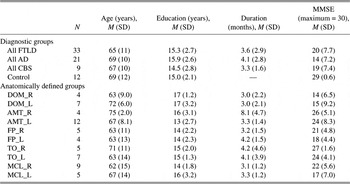
A total of 42 patients with FTLD were studied and diagnosed using standard criteria (McKhann et al., Reference McKhann, Trojanowski, Grossman, Miller, Dickson and Albert2001; Neary et al., Reference Neary, Snowden, Mann, Gustafson, Passant, Brun and Englund1994) including 17 with a social/dysexecutive (SOC/EXEC), 9 with progressive nonfluent aphasia (PNFA), 7 with semantic dementia (SD), and 9 patients with corticobasal syndrom (CBS). Twenty-one patients with AD were also included. These participants and their legal representatives participated in an informed consent procedure approved by the Institutional Review Board at the University of Pennsylvania. There was no between-group difference (Table 2) with respect to age at time of scan (p = .671) and education (p = .866) or (excluding elderly controls) duration of illness (p = .472) and severity of dementia (Mini-Mental Status Exam, (MMSE), p = .426). We used a consensus mechanism to establish subgroup clinical diagnosis based on a review of a semistructured history, detailed mental status exam, and complete neurologic exam by at least two independent trained reviewers using published criteria (Neary et al., Reference Neary, Snowden, Gustafson, Passant, Stuss, Black, Freedman, Kertesz, Robert, Albert, Boone, Miller, Cummings and Benson1998) that have been modified to improve reliability (Grossman & Ash, Reference Grossman and Ash2004). If the reviewers disagreed in their diagnosis, consensus was established through discussion. The reviewers were blinded to the neuropsychological testing and imaging studies reported here.
Demographics by diagnostic and anatomically defined patient subgroup

Note
Column values listed as: mean (standard deviation).
All participants were right-handed by self-report, except for one left-handed SOC/EXEC patient, one ambidextrous SOC/EXEC patient, two left-handed AD patients, and one left-handed CBS patient. No discernable pattern of distribution of left-handed participants was observed neither in the subgroups defined clinically nor in those defined by pattern of cortical atrophy.
Neuropsychological and Behavioral Assessment
Tasks were administered in a single 45-min session among other measures in a fixed order, typically obtained on the same day as the magnetic resonance imaging (MRI). Elderly controls for this battery have been previously described (Grossman et al., Reference Grossman, McMillan, Moore, Ding, Glosser, Work and Gee2004).
Visual Confrontation Naming was assessed with the modified 15-item version of the Boston Naming Test (Kaplan et al., Reference Kaplan, Goodglass and Weintraub1983).
Semantic Memory was assessed with an “Animal” Fluency Test (Mickanin et al., Reference Mickanin, Grossman, Onishi, Auriacombe and Clark1994) where participants were given 60 s to name as many animals. Semantic Memory was also assessed with a Semantic Category Judgment Test (Grossman et al., Reference Grossman, Payer, Onishi, White-Devine, D’Esposito, Robinson and Alavi1997). In this test, participants were asked to judge the semantic category membership of 48 individually presented stimuli in response to a simple probe (“Is it an X?”). One target category was natural (VEGETABLES) and one manufactured (TOOLS); the stimuli were balanced, half targets versus half foils, and half printed words versus half color photos (matched for frequency, familiarity, and visual complexity). Participants were given as much time as they needed to complete the task.
Episodic Memory was assessed with a list of 10 words (Welsh et al., Reference Welsh, Butters, Hughes, Mohs and Heyman1991) administered over three immediate free recall test trials. After 20-min filled delay, Delayed Recall was assessed, followed by a Recognition Test where participants were presented with a list of 20 words, half of which were on the original learning list and half of which were foils, and were asked to identify the original target items.
Figure Copy was assessed by asking participants to copy four geometric designs that differed in their perceptual-spatial complexity (circle, rectangle, diamond, and cube). Performance was graded on an 11-point scale (Morris et al., Reference Morris, Heyman and Mohs1989; Welsh et al., Reference Welsh, Butters, Hughes, Mohs and Heyman1992).
Social Disorder (Chart Review and Scoring): We scored each clinical chart according to a checklist of features based on published characterizations of the disorder of social and personality functioning seen in participants with FTLD (Cummings et al., Reference Cummings, Mega, Grey, Rosenberg-Thompson, Carusi and Gornbein1994; Kertesz et al., Reference Kertesz, Nadkarni, Davidson and Thomas2000). Two independent reviewers evaluated each chart based on the checklist for each item on the checklist; a participant was simply marked 1 for the presence of any relevant comments in the chart and 0 otherwise, and the marks tallied for the final score.
Imaging Acquisition and Processing
All participants were imaged with a GE Horizon Echospeed 1.5-T MRI Scanner (GE Medical Systems, Milwaukee, WI). High-resolution T1-weighted three-dimensional spoiled gradient echo images were acquired with standard parameters: axial, repetition time (TR) = 35 ms, echo time (TE) = 6 ms, slice thickness = 1.3 mm, flip angle = 30°, in-plane resolution of 0.9 × 0.9 mm and dimension of 128 × 256. The individual patient’s brain volumes were transformed into a common anatomical space by registration to the Montreal Neurological Institute brain template bundled with the Statistical Parametric Mapping image analysis package (SPM99) (Evans et al., Reference Evans, Collins, Mills, Brown, Kelly and Peters1993). The anatomic transformation we employed consists of a 12-parameter affine registration and a nonlinear registration using 12 nonlinear iterations and 7 × 8 × 7 basis functions. Brain volumes then were segmented into four tissue types (gray matter, white matter, cerebrospinal fluid, and other). The gray matter volume then was smoothed with a 12-mm full width at half-max Gaussian filter to minimize individual gyral variations.
In order to identify gray matter loss, we next performed a VBM two-sample t test comparing the gray matter volume of each participant to that of a control group of 12 healthy seniors. Standard largely default parameter settings were employed: proportional threshold at 40% of grand mean value, implicit masking, global mean, and cluster size 40 (Forman et al., Reference Forman, Cohen, Fitzgerald, Eddy, Mintun and Noll1995). A statistical threshold of T = 2.5, uncorrected (i.e., sans Bonferroni correction), was selected; the choice of this threshold guaranteed that only two participants failed to survive this threshold procedure; these participants were excluded from further analysis.
Seriation of the Tabulation of Cortical Loss per BA
Absolute cortical loss was then determined by computing the intersection of a set of predefined regions of interest (ROI) with the postthreshold T-map for each subject, resulting in a table of burden of loss indexed by participant and by predefined ROIs. These predefined ROIs consisted of the BAs and subcortical structures derived from the open source Wake Forest application brain atlas (WFU_PickAtlas; www.ansir.wfubmc.edu/maldjian.htm) (Maldjian et al., Reference Maldjian, Laurienti and Burdette2003). The relative atrophy (i.e., the ratio of BA cortical loss vs. total atrophy for a participant) was then computed from this calculation of absolute loss and submitted to seriation analysis. All cortical atrophy computations were automated (thus blinded to clinical and neuropsychological characteristics) using the SPM99 (Wellcome Department of Imaging Neuroscience; http://www.fil.ion.ucl.ac.uk/spm) and augmented with scripts either written locally or obtained from the SPM99 user base.
A semiautomated seriation application was locally developed (Visual Basic, Excel—Microsoft Office) along the lines of Gluck (Reference Gluck2001; Gluck et al., Reference Gluck, Lixin, Boryung, Woo Seob and Ching Tung1999) partly in order to take into account unique aspects of this data set, such as the bilateral symmetry inherent in neuroanatomic data. Seriation was performed with knowledge of the participants’ clinical diagnoses but blinded to the results of the neuropsychological protocol.
Hypothesis: Patterns of Deficit Can Be Related to Patterns of Cortical Atrophy
The seriation procedure was exclusively used to formulate an a priori hypothesis. Its use was blinded to the results of the neuropsychological tests, resulting in a quantitative algorithm for partitioning of the patient population according to pattern of cortical atrophy (Figure 2). This algorithm was applied once and for all prior to any access to the neuropsychological results or performance of any regression analysis.
Individual neuropsychological profiles were regressed against patient subgroups defined by predominant location of cortical atrophy using the covariate total cortical atrophy as an index of disease severity (e.g., univariate General Linear Model (GLM), dependent variable~Boston Naming Test score, fixed effects~patient subgroups, covariate~total cortical atrophy; interaction term specified between total cortical atrophy and patient subgroups, model specifying a single intercept). All statistical analyses were performed with a standard commercial statistical package (SPSS v12.0; SPSS Inc., Chicago, IL).
RESULTS
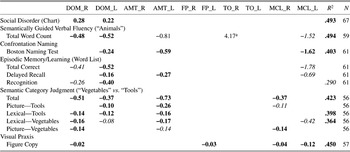
The results of the regression analyses are listed in Table 3. The R 2 values for the regression models are listed on the far right; with the exception of the individual Episodic Memory test parameters (i.e., Recognition, Delayed Recall, and Total Correct for the Word List), the regression models fits were significant, typically accounting for over 40% of the observed variance. Completion of all instruments by every participant was not possible; the number completing each inventory is listed on the far right. The ratios of test score units changed per 10 cc of absolute total volume lost (i.e., the fitted slopes or β-values) are reported in boldface when significant (p < .05) or in italics when trending toward significance (.05 < p < .10). With the exception of the Social Disorder score, in which a higher score indicates increasing deficit, all other indices score performance positively. Thus, the negative ratios represent the decline of performance on a particular neuropsychological index among participants within a subgroup with increasing disease severity.
Regression of psychosocial indices versus total cortical loss for subgroups by dominant cortical loss

Note
This tabulation lists the “β-values” for each neuropsychological test score regressed against the total volume loss as covariate and, as fixed effects, patient subgroups defined by pattern of cortical atrophy. These β-values represent decline in function and are reported in the following units: (table value) (units on psychosocial instrument/10 cc cortical loss). Not all subjects were able to complete every psychosocial instrument; the number of subjects in each inventory is also listed. All scores indicate ability, with the exception of Social Disorder, which tallied deficit. Thus, decline in performance with increasing total cortical atrophy is generally reflected in a negative slope, with the exception of Social Disorder. Values in boldface are significant (p < .05), values in italics are trending (.05 < p < .10), and the blank cells indicate not significant (.10 < p).
a The large positive value for Semantically Guided Verbal Fluency (“Animals”) for the right TO-dominant patient subgroup (TO_Right) is almost certainly an artifact; this subgroup exhibited minimal loss of performance on this index and minimal degrees of cortical atrophy.
The DOM-dominant subgroup showed declines in performance with disease severity for most indices within our neuropsychological protocol. Of particular note, only this subgroup showed a significant correlation between the total cortical atrophy and the Social Disorder scale (Table 3). There are some differences between the right- and the left-dominant patient subgroups, perhaps best demonstrated by the Semantic Category Judgment subscores, “Picture—Vegetables” and “Picture—Tools,” respectively. Additionally, Confrontation Naming (i.e., Boston Naming Test) and all the episode memory test indices (i.e., Word List Recognition, Delayed Recall, and Total Correct) saw declines with increasing total cortical atrophy for the DOM_Left subgroup, but decline in performance was overall much weaker for the DOM_Right subgroup. Thus, the more significant language deficits for DOM_Left as contrasted with the more significant visuospatial deficits for DOM_Right would appear to give some modest support to distinguishing between these two subgroups.
The small AMT_Right-dominant patient subgroup showed no degradation in their neuropsychological performance with increasing severity of total cortical atrophy. By comparison, the larger AMT_Left-dominant subgroup’s language-based performance (i.e., Boston Naming Test, Delayed Recall, Semantic Category Judgment, and “Animal” Fluency) is reliably degraded with increasing total cortical atrophy. Of note, the decline of the AMT_Left group’s Delayed Recall with increasingly severe total cortical atrophy specifically suggests the temporal lobe’s role in memory retrieval, in contrast with the DOM involvement across other Episodic Memory measures.
In general, FPO-dominant patient subgroups display a markedly different neuropsychological profile (Table 3). The several single-cluster-dominant patient subgroups do not demonstrate significant correlations of deficit with atrophy for the language components of our neuropsychological protocol virtually across the board. The one exception may be the decline on Figure Copy (Visual Praxis) for the left central sulcus (FP_Left)-dominant subgroup. These results should be interpreted with some care, given the small numbers of participants in these individual subgroups and the more tentative support for the partitioning of the FPO-dominant patients by seriation.
These null results for the FPO single-cluster-dominant subgroups are to be contrasted with the significant correlations found in the “CBS-like” MCL patient subgroups. In particular, MCL_Left is a relatively large subgroup that shows significant performance degradation with increased disease severity for the Boston Naming Test and trending toward significance on some language measures (Delayed Recall and the Total Correct for Word List indices and “Lexical—Vegetables” score from Semantic Category Judgment), while MCL_Right shows significance for visually guided Semantic Category Judgment (i.e., “Picture—Tools” and “Picture—Vegetables” subscores). Both MCL_Right and MCL_Left are likewise associated with Figure Copy (Visual Praxis) performance decline with increasing disease severity.
DISCUSSION
Subgroups Defined by Patterns of Cortical Atrophy
Given the heterogeneity of clinical deficits and the progressively changing clinical profile over the course of illness (Kertesz et al., Reference Kertesz, McMonagle, Blair, Davidson and Munoz2005), the identification of biomarkers for the degenerative dementias would be highly advantageous. We have proposed grouping participants according to pattern of predominant cortical atrophy, based on the simple observation that cortical atrophy for our heterogeneous study population appears to be largely confined to only one of the clusters defined in Figure 1 and Table 1.
This strategy is consistent with observations, from the earliest autopsy reports on the degenerative dementias, that pronounced atrophy, typically involving heteromodal cortex, is commonly juxtaposed with regions preserved free of pathology, regions that tend to include the unimodal cortex (Braak & Braak, Reference Braak and Braak1991; Mesulam, Reference Mesulam and Mesulam2000a; Pick, Reference Pick, Rottenberg and Hoschberg1977). In the case of AD, the severity of disease has been described as following a pattern of sequential involvement, from entorhinal cortex to hippocampus and amygdala to finally involving isocortex, and this macroscopic severity is reflected in histological distinctions between regions with early versus late involvement (Damasio et al., Reference Damasio, Van Hoesen, Hyman and Schwartz1990; Nagy et al., Reference Nagy, Hindley, Braak, Braak, Yilmazer-Hanke, Schultz, Barnetson, King, Jobst and Smith1999). For AD, it has been further demonstrated that the specific pattern of progression of atrophy in a particular participant is reflected in the evolution of that individual’s neuropsychological profile and that different patterns of progression can be associated with particular patient subgroups (Martin, Reference Martin and Schwartz1990). Our results extend this previous literature to other neurodegenerative dementia patients in that cognitive functions associated with the subgroup’s defining BA cluster correlate with disease severity, while cognitive functions associated with unaffected BA clusters remain relatively preserved. This “double dissociation,” a fundamental principle of modularity in neuropsychology (Teuber, Reference Teuber1955), is in fact what we observe in Table 3. We may extrapolate that those BA clusters associated with a particular neuropsychological test constitute the nodes of the network recruited by that test.
Brain–Behavior Associations for Subgroups Defined by Cortical Atrophy
Social disorder (chart review and scoring)
Notably, the DOM patient subgroup accounts for a substantial amount of the variance on this score and that for no other patient subgroup did Social Disorder correlate with disease severity. Given that our clinical chart scoring system was based on established prospective instruments measuring social functioning (Cummings et al., Reference Cummings, Mega, Grey, Rosenberg-Thompson, Carusi and Gornbein1994; Kertesz et al., Reference Kertesz, Nadkarni, Davidson and Thomas2000), this result is consistent with the fact that virtually all other DOM-dominant participants fell within the SOC/EXEC subgroup.
Confrontation naming (Boston Naming Test)
In addition to activation in the anterior temporal lobe and middle temporal gyrus, functional activations in the left inferior frontal gyrus (BAs 44 and 45) and the heteromodal cortex of the occipital lobe (BAs 18, 19, and 37) have also been consistently observed with confrontational naming (Abrahams et al., Reference Abrahams, Goldstein, Simmons, Brammer, Williams, Vincent, Giampietro, Andrew and Leigh2003; Farias et al., Reference Farias, Harrington, Broomand and Seyal2005; Martin et al., Reference Martin, Wiggs, Ungerleider and Haxby1996; Votaw et al., Reference Votaw, Faber, Popp, Henry, Trudeau, Woodard, Mao, Hoffman and Song1999). This is generally consistent with the surgical literature (Henry et al., Reference Henry, Buchtel, Koeppe, Pennell, Kluin and Minoshima1998) and with lesion analysis (DeLeon et al., Reference DeLeon, Gottesman, Kleinman, Newhart, Davis, Heidler-Gary, Lee and Hillis2007). Our observation of decline on the Boston Naming Test in the predominantly DOM_Left, AMT_Left, and MCL_Left subgroups would appear to agree with this body of work.
Episodic memory/learning (Word List)
Memorization exercises such as the Word List paradigm have an established relationship in the theory and in the clinical evaluation of several aspects of memory, including working memory, storage, and retrieval (Huff et al., Reference Huff, Becker, Belle, Nebes, Holland and Boller1987; Kasniak, Reference Kasniak1988). The DOM cortical atrophy, necessarily including the dorsolateral prefrontal cortex (Baddeley, Reference Baddeley2003), the putative site of the executive component of working memory, accounts for the decline in Word List performance.
Of note, among the Word List indices, the selective decline on Delayed Recall in the AMT_Left patient subgroup is compatible with the clinical literature. In fact, the selective loss of recall in the face of relatively preserved working memory has been identified as one of the earliest and most accurate tests for AD (Flicker et al., Reference Flicker, Ferris and Reisberg1991; Troster et al., Reference Troster, Butters, Salmon, Cullum, Jacobs, Brandt and White1993; Welsh et al., Reference Welsh, Butters, Hughes, Mohs and Heyman1991, Reference Welsh, Butters, Hughes, Mohs and Heyman1992).
Some reports have suggested that in normal individuals, overburdening of working memory may recruit parietal resources, specifically, BA 40 (Cohen et al., Reference Cohen, Perlstein, Braver, Nystrom, Noll, Jonides and Smith1997; Honey et al., Reference Honey, Bullmore and Sharma2000), the putative location of the phonological loop component of the tripartite model of working memory (Baddeley, Reference Baddeley2003; Gathercole et al., Reference Gathercole, Pickering, Ambridge and Wearing2004). This may account for the trending toward significance in the declining performance of the MCL_Left patient subgroup on the Total Correct and Delayed Recall Word List indices. No other patient subgroup demonstrated declining performance with increasing disease severity for Word List–related indices.
Visual praxis (Figure Copy)
The second component of working memory, the visuospatial sketch pad, is also putatively located in the parietal cortex, and deficits in Figure Copy have been associated with predominantly right-sided parietal hypoperfusion in AD (Eberling et al., Reference Eberling, Reed, Baker and Jagust1993; Ober et al., Reference Ober, Jagust, Koss, Delis and Friedland1991). It has been suggested that the nondominant hemisphere, involving the right-sided BAs 47, 6, 40, and 19, lateralizes visual processing in analogy to the dominant hemisphere’s speech-dedicated working memory components (Baddeley, Reference Baddeley2003). However, functional imaging reports have suggested that activation of the higher associational parietal cortex (e.g., intraparietal sulcus and parietal operculum) is multimodal (i.e., haptic as well as visual) and sensitive to the participant’s “field of attention” and exhibits bilateral activation to lateralized stimuli (Culham & Kanwisher, Reference Culham and Kanwisher2001; Macaluso et al., Reference Macaluso, Frith and Driver2002; Peltier et al., Reference Peltier, Stilla, Mariola, LaConte, Hu and Sathian2007). Our observation of decline on Figure Copy for the MCL_Left-, MCL_Right-, and DOM_Right-dominant patient subgroups would appear to be compatible with this literature. With the exception of the predominantly FP_Left patient subgroup, no other patient subgroup demonstrated involvement.
Semantically guided verbal fluency (“Animals”)
Semantically Guided Verbal Fluency is perhaps one of the most thoroughly characterized neuropsychological tasks, prompting theories about the special role of the left inferior frontal gyrus in the execution of this task (Ardila et al., Reference Ardila, Ostrosky-Solís and Bernal2006; Costafreda et al., Reference Costafreda, Fu, Lee, Brian, Brammer and David2006; Thompson-Schill, Reference Thompson-Schill2003). Consequently, it is expected that we should find both DOM_Left and DOM_Right cohorts’ performance declines. However, accounting for involvement of the AMT_Left patient cohort may involve consideration of the particular category chosen, that of “Animals,” a subject of a long-standing controversy (Bright et al., Reference Bright, Moss, Longe, Stamatakis and Tyler2007; Caramazza & Shelton, Reference Caramazza and Shelton1998; Gelman, Reference Gelman1990; Gerlach, Reference Gerlach2007; Grossman et al., Reference Grossman, Koenig, DeVita, Glosser, Alsop, Detre and Gee2002; Martin & Chao, Reference Martin and Chao2001; New et al., Reference New, Cosmides and Tooby2007; Thompson-Schill, Reference Thompson-Schill2003). Having said that, lesion analysis has consistently supported a role for the anterior temporal lobe in this task (Brambati et al., Reference Brambati, Myers, Wilson, Rankin, Allison, Rosen, Miller and Gorno-Tempini2006; Damasio et al., Reference Damasio, Grabowski, Tranel, Hichwa and Damasio1996; Mummery et al., Reference Mummery, Patterson, Hodges and Wise1996); this study may be considered to fall within this well-established literature. With the exception of the clearly spurious positive correlation found for the small TO_Right, and the trend toward significance in the small MCL_Left subgroup, no other subgroup demonstrated involvement.
Semantic category judgment (“Vegetables” vs. “Tools”)
Semantic Category Judgment (“Vegetables vs. Tools”) has been proposed as a task that has the potential to distinguish sensory-related semantic organization from a superordinate-based semantic organization and, as such, a task that can contribute to the elucidation of differences between the degenerative dementias (Grossman et al., Reference Grossman, M. D’Esposito, Hughes, Onishi, Biassou, White-Devine and Robinson1996, Reference Grossman, Payer, Onishi, D’Esposito, Morrison, Sadek and Alavi1998). And in fact, within a cohort of subjects having “probable AD,” using an earlier version of this task (featuring vegetables as the sole-identified category vs. foils with a gradation of increasingly exclusionary features, typically of man-made objects), Grossman has described three subgroups: “Pictures Only,” “Severe,” and “Semantic” (Grossman & Mickanin, Reference Grossman and Mickanin1994).
Subjects in one subgroup, the “Pictures Only” participants, categorized objects presented as words normally but were insensitive to pictorial features indicating relatedness to exemplars of the target category and could be easily confused by target-related pictorial features on foils. This description would appear to be a reasonable match to the MCL_Right-dominant patient subgroup, that showed performance decline on the “Picture—Vegetables” with increasing total cortical atrophy, and for which “Picture—Tools” was trending toward significance, but showed no decline in “Lexical” subscores.
Another small “Severe” subgroup was identified in which category judgment itself was impaired across the board, whether presented as pictures or words, paralleling our AMT_Left subgroup. Of note, this subgroup did not differ in their degree of dementia as per MMSE scores. Finally, a small “Semantic” subgroup was identified in which word and picture category judgment was highly correlated on an item-by-item analysis; specifically, coherent category-related foils (e.g., “apple”—edible plant) were poorly excluded, whether presented as pictures or words, but performance with unrelated coherent foils (e.g., “chair”) or unrelated anomalous foils (“stripped carrot”) was normal, whether presented as pictures or words. This subgroup may be a match for our DOM_Right subgroup that showed decline on “Vegetables,” whether presented as word or picture, but no decline on “Picture—Tools.” Of note, the DOM_Left subgroup appears to have the converse relationship for the “Tools” category judgment.
Silent Cortical Areas and Double Dissociation
Throughout our discussion of the respective cognitive domains, in addition to noting locations associated with declining function, we have flagged the locations for which cortical atrophy did not affect task performance. This is a critical aspect of the double dissociation principle. Of perhaps equal interest, several subgroups appear to have no footprint in the current neuropsychological battery whatsoever: AMT_Right, FP_Right, FP_Left, TO_Right, and TO_Left subgroups. Together they account for 24 subjects, over a third of our patient population. Being able to exclude these subjects can only improve the power of statistical analyses of tests included in our current battery and motivates the development of tests targeting these silent regions and their corresponding patient subgroups.
Several subgroups identified by our quantitative patient-partitioning algorithm have clear precedent: DOM subgroup ~ frontal variant FTLD, AMT_Left ~ temporal variant FTLD and/or AD with hippocampal atrophy, and MCL_Right~ CBS. It would appear that our partitioning algorithm may have identified previously unidentified subgroups, the corresponding BA clusters of which all fall within the FPO supercluster.
CONCLUSIONS
This study had some limitations. Because of the relatively large number of patient subgroups, some were necessarily small. Pathological diagnoses were not available to confirm the clinical diagnoses. Patients were not assessed for hemispheric dominance, though no discernable grouping pattern emerged among the few subjects who were not right-handed by self-report. Perhaps the most problematic unaddressed issue is the known variability in degeneration seen in the different cortical regions. We have preliminary evidence, not presented here, that differences in the time rate of degeneration for the different anatomically defined subgroups can be statistically significant. In future manuscripts, we also intend to present evidence that dominant cortical atrophy is accompanied by secondary degeneration in other selected cortical and subcortical regions. This is a difficult issue to address succinctly as our study was not longitudinal, each subject being imaged only once.
However, in this manuscript, our mathematical modeling assumes that cortical degeneration is exclusive to the dominant BA cluster. This overly simplistic model is apparently sufficiently accurate to account for a significant portion of the variance in neuropsychological testing in the different anatomically defined patient subgroups, our main result. Of perhaps equal significance, we observed a double dissociation of the brain–behavior relationship probed by each test within our neuropsychological battery in a clinically heterogeneous population with neurodegenerative disease. This would suggest the reconsideration of the cognitive deficits in the degenerative dementias in light of the “network” analytic perspective from the lesion and functional activation literatures. Our findings thus suggest the potential feasibility of using a quantitative analysis of the pattern of cortical atrophy as a biomarker for the degenerative dementias.
ACKNOWLEDGMENTS
Portions of this work were supported by the U.S. Public Health Service (AG17586, AG15116, and NS44266) and the Dana Foundation. Portions of this work were presented at the annual meeting of the American Academy of Neurology, Boston, 2007.