INTRODUCTION
Guiding and focusing of intense beams is an important aspect of many applications of laser and particle beams. The fast ignition concept of inertial fusion (Tabak et al., Reference Tabak, Clark, Hatchett, Key, Lasinski, Snavely, Wilks, Town, Stephens, Campbell, Kodama, Mima, Tanaka, Atzeni and Freeman2005) depends on laser energy transport to the dense plasma region by cone guiding (Johzaki et al., Reference Johzaki, Sakagami, Nagatomo and Mima2007; Nakamura et al., Reference Nakamura, Mima, Sakagami, Johzaki and Nagatomo2008, Reference Nakamura, Sakagami, Johzaki, Nagatomo and Mima2006). In other inertial fusion scenarios, intense laser or ion beams are guided within a plasma channel (Neff et al., Reference Neff, Knobloch, Hoffmann, Tauschwitz and Yu2006; Niemann et al., Reference Niemann, Neff, Tauschwitz, Penache, Birkner, Constantin, Knobloch, Presura, Rosmej, Hoffmann and Yu2003; Verma & Sharma, Reference Verma and Sharma2009; Yu et al., Reference Yu, Cao, Yu, Cai, Xu, Yang, Lei, Tanaka and Kodama2009). In this paper, we propose the method of cone focusing of heavy ion beams for warm dense matter experiments.
Reflection of ion beams by a solid wall in a vacuum is a well known phenomenon (Maskhova & Molchanov, 1985). Applications include diagnostic techniques such as Rutherford backscattering (RBS), particle-induced X-ray emission (PIXE), and elastic recoil detection analysis (ERDA). In addition focusing devices for X-rays and neutrons (Chen et al., Reference Chen, Downing, Mildner, Gibson, Kumakhov, Ponomarev and Gubarev1992) based on grazing incidence reflection and scattering have been built and operated. Tapered glass capillaries have also been investigated as a means of focusing MeV ion beams to small spot size (Nebiki et al., Reference Nebiki, Yamamoto, Narusawa, Breese, Teo and Watt2003).
The United States' heavy ion fusion science program has developed techniques for heating targets to high temperature for the study of matter under warm dense matter (WDM) conditions (Barnard et al., Reference Barnard2005). Intense ion beams have several attractive features as a technique for generating WDM. These features include: precise control of local beam energy deposition dE/dx, nearly uniform throughout a given volume, and not strongly affected by target temperature, large sample sizes (about 1 µm thick by 1 mm diameter), and the ability to heat any target material, for example, foams, powders, conductors, insulators, solid, gas, etc.
Uniformity of beam energy deposition is obtained by taking advantage of regions where the dE/dx curve is flat or nearly flat: high energy approaching 1 GeV/AMU (as at the GSI accelerator (Ni et al., Reference Ni, Kulish, Mintsev, Nikolaev, Ternovoi, Hoffmann, Udrea, Hug, Tahir and Varentsov2008)), at a lower energy such as near the Bragg peak (where dE/dx is maximum) as in the Neutralized Drift Compression Experiment II (NDCX-II) accelerator now under construction, and at low energy at about 10 keV/AMU, as in neutralized drift compression experiment I (NDCX-I). This approach allows generation of volumetric WDM with moderate beam energy.
Because the range of such beams in matter is typically a micron or less, it is necessary to compress beam pulses longitudinally to about 1–3 ns to be consistent with the hydrodynamic expansion time of the target. Beam pulse compression using space charge neutralized rotation in phase space has been achieved. Initial experiments have been performed using the 350 keV K+ beam from the NDCX-I accelerator (Seidl et al., Reference Seidl, Anders, Bieniosek, Barnard, Calanog, Chen, Cohen, Coleman, Dorf, Gilson, Grote, Jung, Leitner, Lidia, Logan, Ni, Roy, van den Bogert, Waldron and Welch2009). The WDM conditions are achieved by combined longitudinal and transverse neutralized drift compression to provide a hot spot on the target with a beam spot size of ≤1 mm, and pulse length of about 1–3 ns. Longitudinal phase space rotation in an induction bunching module provides the longitudinal pulse compression. Incident beam energy spread on target is about ±20% (60 keV). Transverse final focus is provided by a high-field pulsed solenoid with a focal length of about 20 cm. Because of the space charge of the beam at final focus, focusing of the beam to the desired spot size requires space charge neutralization. Neutralizing plasma is injected to provide space charge neutralization in the final focus region.
The reflection characteristic of ion beams on solid walls suggests the concept of introducing a metal cone to concentrate the ion beam on target to high intensity. We investigate here the properties of the reflected beam distribution from a gold cone inserted in close proximity to the target. The cone scatters radially inward those beam ions that strike the inner wall of the cone, to concentrate additional beam energy onto the target. The cone acts as a kind of final focus element in close proximity to the target that does not depend on electric or magnetic fields to focus the beam. The inner bore of the cone may have a straight or curved profile. A parabolic profile, for example, has the property that comes close to optimizing the ion beam concentration efficiency of the cone onto the target because of the nearly specular reflection property of the wall. The results from a prototype gold cone focusing the neutralized drift compression experiment (NDCX) beam are presented and compared with model predictions.
REFLECTION MODEL
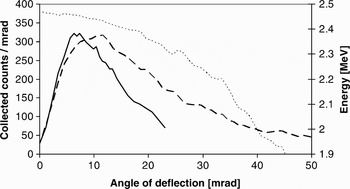
The distribution of the angle of reflection for 2.5 MeV protons incident on a 10-nm gold coating on a SiO2 substrate has been measured (van Kan & Vis, Reference van Kan and Vis1996). Figure 3a of van Kan and Vis is re-plotted in Figure 1 for an angle of incidence θi = 10.6 mrad. The measurement was made by monitoring the X-ray production on a thin copper wire inserted into the reflected ion distribution. The angular distribution of the reflected protons peaks near the angle of incidence, θr ≈ θi measured with respect to the surface of the wall.
Comparison between data of Ref. 7 (solid) and TRIM simulation (dashed) of the scattered ion distribution (counts per mrad) at 10.6 mrad angle of incidence for 2.5 MeV protons on a 10 nm gold layer over a SiO2 substrate. Measured distribution represents X-ray production from a copper wire passed through the scattered beam, and is normalized to approximate the peak value of the simulated distribution. Also shown is the average energy of the scattered distribution (dotted) from TRIM.

The Monte Carlo simulation program transmission and range of ions in matter (TRIM), which is part of the stopping and range of ions in matter (SRIM) collection of programs (Ziegler, Reference Ziegler2008), calculates the transmission and range of ions in matter. TRIM follows detailed ion-atom collision kinetics, and it can generate a file containing backscattered ion information. We have used this program extensively to calculate expected angular and energy distributions of beam ions, which enter the wall at a grazing incidence and scatter back into the vacuum. The simulation results show a peaked scattered ion angle distribution for grazing incidence, in agreement with the measurements of van Kan and Vis. The angular scattered ion distribution of a 2.5 MeV proton beam at θi = 10.6 mrad for 10-nm gold coated on a SiO2 substrate in a TRIM simulation is shown in Figure 3 for comparison with the data. The simulated scattered ion distribution is absolute, allowing for prediction of energy efficiency of the scattering mechanism. The ratio of reflected particles to incident particles in the simulation was 9800/17200 = 0.57. Note that both the measurements and the TRIM results show a qualitatively similar distribution with a linear rise to a peak at small angles, and a fall-off in ion distribution at large angles. The TRIM simulated distribution peaks at a higher angle than the measurements and the simulation has a longer tail than the measurements. The discrepancy may be partly related to the fact that the energy distribution of the scattered ions in the simulation falls monotonically as a function of scattered angle. The X-ray production efficiency is a strong function of ion energy, which was not measured. As a result, the measured X-ray signal falls more steeply with angle in the tail than the raw particle distribution.
We do not take into account the total reflection due to surface channeling that has been observed for very small angles of incidence (van Kan & Vis, Reference van Kan and Vis1996). As a result, our simulations may underestimate the reflection efficiency of the wall at least in the case of very small angles of incidence.
Although a direct quantitative comparison is not possible between the measurements and the simulation, on the basis of the qualitative agreement we use the TRIM model as a guide to the reflected particle distribution in our design and modeling of the cone.
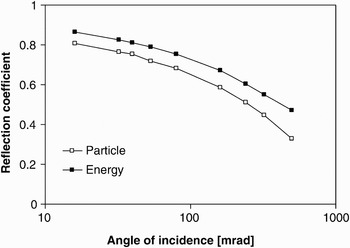
Figure 2 shows results from TRIM for the particle (ratio of number of reflected particles to number of incident particles) and energy (ratio of average energy of reflected particles to the energy of the incident particles) reflection coefficient for K+ beam on gold as a function of angle of incidence. This curve indicates that the reflection coefficient is dependent on the angle of incidence but remains relatively high even beyond 100 mrad. Scaling studies using TRIM indicate that the reflection coefficient is a weak function of ion energy and ion mass, with significant reflection from very low ion energy to beyond 100 MeV. The reflection coefficient generally increases with atomic number of both the wall material and the beam ion species, and decreases with the beam energy, in agreement with the reduced energy formulation of (Mashkova & Molchanov, Reference Mashkova and Molchanov1985).
Summary of particle and energy reflection coefficients for grazing incidence 300 keV potassium beam on gold.

EXPERIMENTAL RESULTS
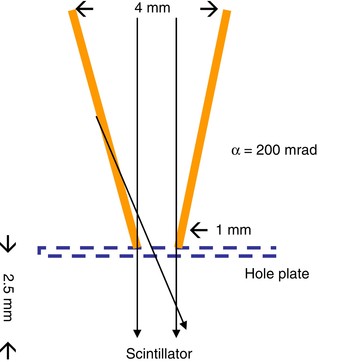
Two experimental cones were fabricated from pure gold for use on NDCX. The first cone (Fig. 3) was machined to simple cone geometry. The pitch angle of the cone wall with respect to the axis was α = 200 mrad. The cone was attached to a 51-μm thick stainless steel screen with 76 µm circular holes on a hexagonal pattern of 152 µm hole-to-hole separation. The detector in this experiment was an alumina screen used as a scintillator imaged with a Princeton Instruments intensified CCD (PIMAX) gated camera (Bieniosek et al., Reference Bieniosek, Eylon, Faltens, Friedman, Kwan, Leitner, Molvik, Prost, Roy, Seidl and Westenskow2005). The purpose of the screen is to provide a source of neutralizing secondary electrons to the scintillator surface. Previous measurements (on STS-500 (Westenskow et al., Reference Westenskow, Kwan, Grote and Bieniosek2007)) indicated that the response of the alumina scintillator light output is approximately linear with K+ beam energy in the energy range 30 to 350 keV. As a result, the light output from the scintillator was used as a relative measure of the beam energy flux incident on the scintillator. The cone assembly was mounted on a movable diagnostic paddle on NDCX, downstream of the solenoid transport section. A 3-µs, 30-mA, 300-keV K+ beam pulse from NDCX was directed into the cone. In order to provide an approximately uniform distribution of beam across the 4-mm entrance aperture of the cone, the NDCX beam tune was adjusted to provide a beam profile at the plane of the cone larger than the entrance aperture of the cone. Measurements were taken in a fixed 1-µs time window during the central portion of the beam pulse.
(Color online) Schematic drawing of the simple cone experiment.

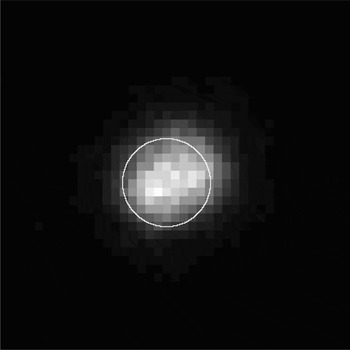
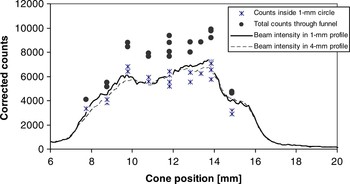
The scintillator image of Figure 4 shows beam at the scintillator both inside and outside the 1-mm circle indicating the exit aperture of the cone where ions can pass through the cone directly onto the detector. This result indicates the presence of scattered ions exiting the cone. Because of the geometry of the experiment, some of the ions scattered on the cone wall arrive at the detector radially inside the 1-mm circle and some arrive radially outside the 1-mm circle. Counts in the camera images with and without the cone (summarized in Fig. 5) were compared to determine the increase in detected ion signal due to the cone.
Scintillator image at the cone exit with beam directed into the cone. The image size is 4 × 4 mm; the 1-mm circle indicates the size of the exit aperture of the cone.

Scintillator image intensity (corrected counts) as a function of cone position scanned across the beam profile.

Figure 5 shows the total incident beam inside the 1-mm exit aperture and inside the 4-mm entrance aperture of the cone, normalized by the relative area of the two circles. Also shown are the detected signals inside the 1-mm diameter exit aperture of the cone, and total signal through the cone, as the cone was moved transversely across the beam profile. Each point represents a single beam pulse. The signals were corrected for the baseline offset of the camera and analyzed using the image processing program ImageJ. The beam integrated intensity inside the 1-mm circle shows generally good agreement with the expected signal without the cone in the same area. Because there are only 10 pixels across the 1-mm exit aperture, the camera resolution may be a limiting factor in the accuracy of this measurement. The total counts integrated across the entire beam profile (both inside and outside the 1-mm exit aperture) have little sensitivity to camera resolution. These counts, also corrected for offset, show an increase in signal above the incident beam intensity at all locations across the beam. The data shows on average about a 40% increase in beam energy on target using the cone. The observed pulse-to-pulse variations indicate the degree of reproducibility of the experiment. To confirm the analysis technique, the experiment was repeated using a 1-mm diameter hole in a thin steel plate in place of the gold cone. No enhancement of the scintillator signal under the hole was observed, as expected.
This cone has been installed about 1 mm upstream of the target in the NDCX-I target chamber and is now used routinely in WDM target experiments (Bieniosek et al., Reference Bieniosek, Henestroza, Leitner, Logan, More, Roy, Ni, Seidl, Waldron and Barnard2009). The 1-mm spot size on the target is optically diagnosed through a 0.4-mm diameter optical fiber. To avoid transverse target temperature variations due to the thermal losses to the cold unheated target material outside of the 1-mm spot, we place the optical fiber inside a region defined by a 0.1-mm margin radially inside the edge of the 1-mm spot. Thus, the required alignment accuracy of the optical system is <0.2 mm.
The second cone was designed to approximate a parabolic shape. Because of the nearly specular nature of the ion reflection from the wall, a cone in a paraboloid shape has the property that comes close to optimizing the ion beam concentration efficiency onto the target. A machined steel pin was pressed into a gold cylinder to form the cone. The shape of the pin and the design shape of the cone was parabolic with a pitch angle α = 160 mrad at the tip (diameter = 0.4 mm) and α = 40 mrad (diameter = 1.6 mm) at a height of 9.4 mm. The measured dimensions of the gold cone were 1.65 mm at the entrance and 0.51 mm at the exit.
We expect to install this second cone in the target assembly using a 0.2-mm diameter optical fiber for the optical diagnostics. Because of its small size, this cone takes advantage of the large fraction of even a well focused beam that does not directly strike a 0.5-mm target spot. Alignment accuracy for diagnostics required for this cone is <0.05 mm.
DISCUSSION
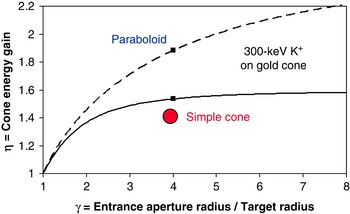
The TRIM code was used to predict enhancement of energy on target by following reflected ions from the cone wall to the target plane for a given radius of the wall interaction. The energy enhancement is the product of the increased ion flux and the energy of the ions to the target. It is determined by integrating the flux at the target as a function of the radius of the wall. The calculated energy enhancement ratio η (ratio of energy deposition with cone to energy deposition without the cone) is shown in Figure 6 for the cone of Figure 3 (solid curve) assuming uniform spatial distribution of the incident beam. The predicted ratio for the simple cone is η = 1.53 for γ = 4, compared with the measured ratio of η ≈ 1.4. The difference may be attributed to the nonuniform incident beam profile and to imperfections in the cone surface. In addition, the presence of the hole plate between reduces the intensity of reflected ions as angle of incidence increases. For example, at a reflected angle of 2α = 400 mrad, the transmission factor of the hole plate is 0.65. Because of the relatively shallow pitch angle of this cone, enhancement due to second-order reflection is expected to be small.
(Color online) TRIM calculation of relative energy enhancement on target for a uniform incident beam and single reflection in the simple (α = 200 mrad) cone (solid curve) and for a parabolic (α = 160/γ mrad) cone (dashed curve) as a function of normalized radius of the entrance aperture. Also shown is experimental data point for the simple cone geometry tested.

The predicted enhancement for the parabolic cone is also shown in Figure 6 (dashed curve). This prediction is based on TRIM calculations for reflection of a uniform flux of 300 keV K+ ions on a gold cone. The cone modeled has a parabolic profile with a pitch angle α = 40 mrad at the entrance aperture (diameter = 1.6 mm) and α = 160 mrad at the target (diameter = 0.4 mm). The enhancement for a single reflection at γ = 4 is compared with the efficiency for the simple cone described previously. The predicted ratio η for a single reflection in the parabolic cone is η = 1.89 for γ = 4. As the entrance aperture increases the enhancement factor continues to increase, in contrast with the simple cone that saturates at a relatively low value near γ = 4. In addition, a significant contribution from second (and higher order) reflections is expected to occur because of the large enhancement of the beam ion flux in the vicinity of the target. Each step in the cascade is characterized by an increase in angular spread as the beam particles reflect repeatedly off the wall. However, the additional contribution from these multiple reflections has not yet been modeled.
The parabolic cone approximates a final focus element with focal length f = r/Δθ = 1 cm (referenced to the entrance location) where r is the radius of the entrance aperture, and Δθ is the deflection angle (80 mrad). In contrast to conventional focusing elements, there is no significant energy dependence over the energy range of interest in this experiment. Based on this approach, the spot size attainable with the cone is limited to approximately r spot ~ ɛ/Δθ where ɛ is the beam emittance. For example, if the emittance is 16 π mm mrad and taking the deflection angle at the entrance, the spot size for this cone is limited by beam emittance to about 0.2 mm. This emittance-limited spot size is comparable to the target spot size.
At the beam intensity used in the prototype cone experiments externally-applied space neutralization plasma was not necessary. Space charge neutralization is required at the intensity required in the WDM target experiments. As the beam enters the cone, each beam ion striking the wall at grazing incidence generates secondary electrons. Measurements of 1-MeV potassium beam at grazing incidence indicate a secondary electron coefficient up to 100 on stainless steel (Molvik et al., Reference Molvik, Kireeff Covo, Bieniosek, Prost, Seidl, Baca, Coorey and Sakumi2004). The copious secondary electrons are expected to enhance space charge neutralization for the beam ions focused in the cone. They may also provide additional electrons to the external plasma already provided for space charge neutralization of the beam upstream of the cone as the beam reaches final focus.
Since the cone introduces additional beam energy spread, the cone is not isochronous. The velocity of a 300-keV K+ ion is v = 1.22 mm/ns. For a cone of axial length 10 mm, the time for the ion to traverse the length of the cone is 8.2 ns. The energy distribution of the reflected ions is degraded, with a typical energy distribution peaking at about 97% of the incident beam energy (290 keV) of particles reflected into the target from the vicinity of the entrance aperture. (Those particles reflected at greater angles into the tail of the angular distribution, and which are generally lost, suffer greater energy losses.) In NDCX, the spread in beam energy at the target due to scattering is less than the incident beam energy spread from the induction bunching module. The arrival time difference between a 300-keV incident beam ion and the peak of the scattered ion energy distribution (~290 keV) is 0.14 ns for a 10-mm path length. The additional spread in beam arrival time is small compared to the compressed pulse length (1–3 ns).
Further enhancements of the cone concept may include nested cones and small-diameter capillary tubes. For example, at high beam intensity space-charge neutralized transport is generally required. However, the unshielded beam potential ϕ in a grounded tube filled by a uniform beam, given by ∇2 ϕ = ρ/ɛ0, scales as r 2: ϕ = ρr 2/4ɛ0, for a given charge density ρ (ɛ0 is the permittivity of free space). If beam energy density on target is J = 1 J/cm2, the unshielded beam potential in a tube for a 1-ns, 300 keV K+ beam is about 1 V for a 1-μm radius tube. As a result, unshielded high intensity beam transport may be possible in micron-diameter capillaries.
In conclusion, the cone has a number of advantageous properties for focusing intense ion beams: (1) enhanced flux as described above; (2) enhanced secondary electron flux for space charge neutralization; (3) reduced beam space potential because of the close proximity of the metal wall to the beam; (4) shielding of the target from the edges of the beam, which are blocked by the body of the cone; and (5) improved uniformity of energy flux on target because of the addition of the reflected beam ions to the beam ions directly striking the target. Further modeling and experimental studies are planned to study performance of the cone in these areas of interest.
ACKNOWLEDGMENTS
The authors thank Jed Duersch for assistance in TRIM calculations, J. van Kan (National University of Singapore) for helpful discussions, W. Greenway for fabrication of the gold cones, and S.M. Lidia, P.K. Roy, and P.A. Seidl for operation of NDCX-I for the experimental tests of the cone. This work was supported by the Director, Office of Science, Office of Fusion Energy Sciences, of the U.S. Department of Energy under Contract No. DE-AC02-05CH11231.