

Soft tissue sarcoma is a cohort of mesenchymal malignancies, comprising about 1% of all adult solid tumours. This review focuses on one particular histological subtype of soft tissue sarcoma: malignant peripheral nerve sheath tumour (MPNST). This terminology was adopted by the World Health Organization (WHO) in 1990, replacing previous disparate descriptors such as malignant schwannoma, malignant neurilemmoma, and neurofibrosarcoma. This review provides an updated summary of the critical molecular pathways identified in MPNST – both neurofibromatosis type 1 (NF1)-related and sporadic forms – and their potential clinical applications.
Clinical observations
Epidemiology
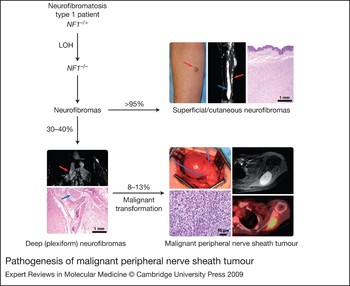
MPNSTs account for about 3–10% of soft tissue sarcomas, rendering them an extremely rare group of malignancies (Ref. Reference Grobmyer1). Gender incidence is equivalent (Refs Reference Cashen2, Reference Anghileri3) and the most common age of diagnosis is in the sixth and seventh decades of life for sporadic MPNST and third and fourth decades of life for NF1 patients (Refs Reference Angelov4, Reference Evans5). The aetiology of MPNST is poorly understood; however, up to 50% of MPNSTs arise in patients suffering from NF1 (Ref. Reference Ducatman6). In this autosomal dominant genetic disorder, patients develop both superficial and deep neurofibroma tumours and the latter are associated with risk of malignant transformation to MPNST. It has been suggested that MPNST may arise in NF1 patients outside the context of a pre-existing deep neurofibroma, and superficial neurofibromas can transform upon rare occasion, but the major risk is with deep neurofibromas (Ref. Reference Ferner and Gutmann7) (Fig. 1). Lifetime risk of MPNST development in NF1 patients ranges between 8% and 13% and arises within deep neurofibromas in about 30% of patients who display the lesions (Refs Reference Evans5, Reference Tucker8). Other clinical features are also associated with this complex and interesting syndrome, but risk of MPNST is most cogent to this review (Refs Reference Friedman9, Reference Gutmann10). The remainder of MPNSTs (~50%) develop sporadically. Interestingly, about 3–10% of all MPNST patients (sporadic and NF1-related) have a history of radiation exposure, usually as treatment for a previous malignancy 10–15 years earlier (Refs Reference Ducatman6, Reference Zadeh11, Reference Adamson, Cummings and Friedman12, Reference Gupta, Mammis and Maniker13).
Pathogenesis of malignant peripheral nerve sheath tumour. Neurofibromatosis 1 (NF1) is a neurogenetic disorder caused by loss of function of the NF1 gene. Neurofibromas are the most common benign peripheral nerve sheath lesions in NF1 and manifest as superficial cutaneous neurofibromas (nonplexiform) in virtually all patients and/or as deep (often plexiform) neurofibromas. Only deep neurofibromas have the significant propensity to undergo malignant transformation to MPNSTs, with an estimated 8–13% lifetime risk in a patient. Most MPNSTs are believed to arise in association with deep neurofibromas, but they may arise outside of this context as well. In the superficial cutaneous neurofibroma panel, a clinical photograph depicts a cutaneous neurofibroma (red arrow), and a radiograph from a different patient shows both superficial (red arrow) and deep (blue arrow) neurofibromas involving the lower extremity. The haematoxylin and eosin (H&E) photomicrograph shows a dermal neurofibroma. The deep neurofibroma panel features a radiograph of lobular, plexiform neurofibroma (red arrow) deep in the pelvis and an H&E image of a plexiform neurofibroma associated with a nerve (blue arrow). Additional molecular events must accumulate for malignant transformation. In the MPNST panel, an intraoperative photograph shows an MPNST in an NF1 patient involving the sciatic nerve with a histological photomicrograph of an MPNST below. The images to the right show a radiograph of an MPNST near the scapula and a PET (positron emission tomography) image showing avid glucose uptake consistent with intense metabolic activity in the same case directly below. Clinical and radiographic images were kindly provided by John Madewell, John Slopis and Ian McCutcheon of M.D. Anderson Cancer Center, Houston, TX, USA. Abbreviations: LOH, loss of heterozygosity; MPNST, malignant peripheral nerve sheath tumour; NF1, neurofibromin gene.

Presentation and clinical features
MPNST usually presents as an enlarging mass causing pain and disability depending upon lesion size and location. The most common sites of presentation are nerve roots and bundles in the extremities and the pelvis (Refs Reference Cashen2, Reference Anghileri3), with rare cases of MPNST arising at various body sites (Ref. Reference Grobmyer1). Symptoms of MPNST may include radicular pain, paresthesia and neurological deficits. In NF1 patients, a rapid change in the size or onset of pain from an existing lesion may suggest malignant transformation. MPNSTs are often diagnosed at an advanced stage, with primary tumours having reached a diameter of 5–10 cm and with detectable distant metastases (Ref. Reference Anghileri3). The commonest site of metastases is lung; less frequent sites are liver and brain (Refs Reference Anghileri3, Reference Ducatman6, Reference Vauthey, Woodruff and Brennan14). The site distribution of primary MPNST does not differ significantly between sporadic and NF1- related cases (Ref. Reference Ducatman6).
Diagnosis
The diagnosis of MPNST begins with a careful physical examination and patient history. Radiological imaging should be obtained prior to biopsy. Magnetic resonance imaging (MRI) is a popular imaging modality for MPNST and in some cases may facilitate the differentiation of neural tumours from non-neurogenic soft tissue tumours (Ref. Reference Van Herendael15). However, MRI cannot distinguish benign from malignant tumour, for which microscopic tissue examination is mandatory. Computerised tomography (CT) may also be useful (Ref. Reference Grobmyer1). The role of positron emission tomography (PET) with the glucose analogue [18F]fluorodeoxyglucose (FDG) in the primary diagnosis of MPNST is less established, but several reports suggest higher PET standardised uptake values in MPNST compared with benign neural tumours (Ref. Reference Cardona16).
One of the following pathological criteria is required to establish a diagnosis of MPNST: (1) the tumour arises in association with a peripheral nerve or a pre-existing deep neurofibroma and has histological features compatible with MPNST; (2) the tumour has the histological appearance of MPNST and arises in a patient with NF1; or (3) the tumour demonstrates the unequivocal histological features of MPNST (Refs Reference Gutmann10, Reference Woodruff17). Histology usually reveals a neoplasm composed of distinctly atypical cells with prominent mitoses and often necrosis. The morphology can vary from spindled cells to sometimes more epithelioid forms. A group of tumours associated with scattered nuclear atypia and lacking significant mitotic activity are termed atypical neurofibromas or ‘low-grade MPNST’ by some, but generally do not metastasise and thus may not be fully malignant; they may represent intermediate precursors between deep neurofibromas and MPNST, but more study is needed (Ref. Reference Lin, Weiss and Medeiros18). In actual practice, outside of the setting of NF1 or documented association with a nerve, the reproducible diagnosis of MPNST is challenging and is a diagnosis of exclusion. Immunohistochemistry and electron microscopy may be helpful, but are not entirely specific. Experts may express varying opinions on individual cases. This difficulty in establishing the diagnosis outside of the setting of NF1 certainly affects the reported percentages of MPNST associated with NF1, which range from a quarter to half of all cases, with the latter figure being reasonable in our experience (Refs Reference Ducatman6, Reference Zou19).
Early detection and prevention
Early detection of MPNST in NF1 patients is currently precluded by the lack of clinical or pathological means to conclusively ascertain the potential for malignant transformation of an individual deep neurofibroma. However, given that up to a third of patients with deep, plexiform neurofibromas will undergo such transformation, early detection is desirable (Refs Reference Grobmyer1, Reference Ferner and Gutmann7, Reference Friedman9). Suggested risk factors in the setting of NF1 include high neurofibroma tumour burden, previous exposure to radiation therapy, microdeletions of the NF1 gene, neurofibromatous neuropathy and family history of MPNST (Refs Reference Ferner and Gutmann7, Reference De Raedt20). The presence of such factors may warrant more aggressive screening. Distinguishing between a recently transformed deep neurofibroma and a benign one is challenging (Ref. Reference Warbey21). In a single-institution study aiming to establish robust clinical markers that would lead to early detection of MPNST, characteristics such as limb localisation, larger size, depth in relation to deep fascia, and short duration of symptoms such as pain correlated with a diagnosis of MPNST (Ref. Reference Furniss22). This study also suggested that CT and MRI documenting rapid interval growth can perform well in detecting malignancy (Ref. Reference Furniss22). These findings are encouraging, but probably difficult to apply in less experienced centres. More recently, FDG-PET combined with CT has been evaluated for early detection of NF1-associated MPNST (Fig. 1). Imaging of NF1 patients with deep neurofibromas by FDG-PET–CT suggests that this diagnostic modality is both a sensitive (0.87; 95% CI = 0.74–0.95) and specific (0.97; 95% CI = 0.81–0.99) diagnostic tool for patients with NF1 (Ref. Reference Warbey21). There are ongoing trials utilising FDG-PET–CT in the follow-up of deep neurofibroma growth behaviours (NCT00693394, NCT00060008) and evaluation of response to experimental prevention treatments for NF1 (Table 1), including several trials evaluating targeted drugs such as sorafenib and sirolimus, in this direct and indirect prevention setting (NCT00727233, NCT00029354, NCT00053937).
A summary of recent trials offered to NF1 and MPNST patients
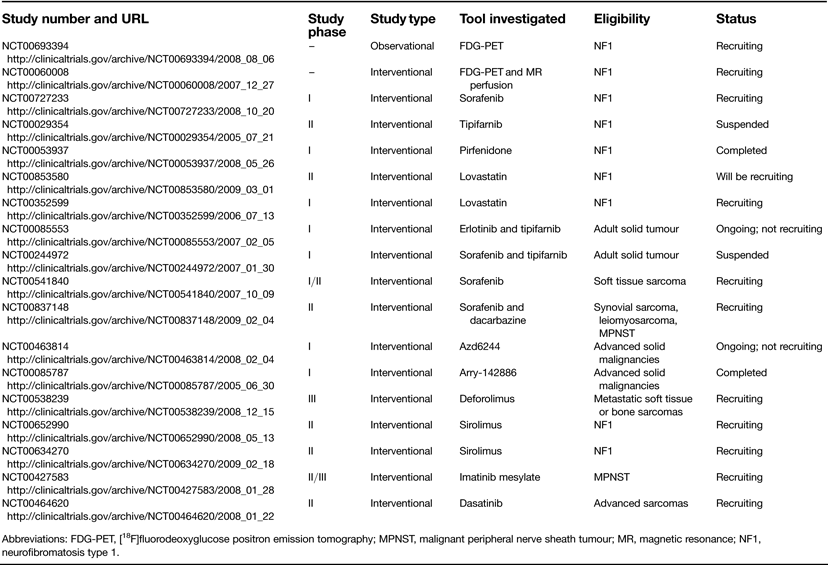
Abbreviations: FDG-PET, [18F]fluorodeoxyglucose positron emission tomography; MPNST, malignant peripheral nerve sheath tumour; MR, magnetic resonance; NF1, neurofibromatosis type 1.
Treatment
Complete surgical excision with clear margins represents the mainstay of localised MPNST therapy (Refs Reference Ducatman6, Reference Ferner and Gutmann7). The role of systemic chemotherapy in MPNST remains controversial. Based on retrospective data, adjuvant chemotherapy is frequently integrated in the treatment of high-risk MPNST (Ref. Reference Grobmyer1). Advanced nonresectable disease may demonstrate some responsiveness to first-line chemotherapy, which is usually a combination of doxorubicin and ifosfamide. However, responses to second-line therapies are much lower. Given that MPNST has a 40–65% rate of local recurrence (Refs Reference Hruban23, Reference Kourea24, Reference Wong25), radiation has been employed in the adjuvant setting (Refs Reference Ducatman6, Reference Vauthey, Woodruff and Brennan14), perhaps with some improvement in local control. The use of this modality is debated in the setting of NF1 where prior radiation itself is associated with development of MPNST (Ref. Reference Sharif26). However, in specific NF1 patients, the need for local control of MPNST in the absence of other viable options can outweigh this potential risk. Radiation is generally avoided in NF1 patients who have not developed MPNST. Concomitant improvements in survival as a result of nonsurgical therapy have yet to be demonstrated (Ref. Reference Ducatman6).
Outcome
Patients diagnosed with MPNST generally have an unfavourable prognosis. Many MPNST patients have nonresectable disease at diagnosis (Ref. Reference Anghileri3). Advanced nonresectable and/or metastatic MPNSTs demonstrate limited responses to chemotherapy; afflicted patients have 5-year survival rates of only 20–50% (Refs Reference Ducatman6, Reference Kourea24, Reference Wong25, Reference Sordillo27) and 10-year disease-specific survival of only 7.5% (Ref. Reference Zou19).
For those patients diagnosed with primary disease, the 10-year disease-specific survival is 32%, which decreases to 26% for recurrent disease (Refs Reference Zou19, Reference Carli28). Improved survival of MPNST patients has been correlated with complete surgical excision, extremity location, small tumour size (<10 cm), and lower-grade histology (Refs Reference Anghileri3, Reference Ducatman6, Reference Zou19). Several studies have suggested a less favourable outcome for NF1-associated MPNST patients compared with those harbouring sporadic MPNST (Refs Reference D'Agostino, Soule and Miller29, Reference Poyhonen, Niemela and Herva30). However, this conclusion is refuted by other studies (Refs Reference Cashen2, Reference Kourea24) and the issue remains unresolved.
For further reading on clinical aspects of MPNSTs, see the recent review by Gupta et al. (Ref. Reference Gupta, Mammis and Maniker13).
Molecular insights and clinical implications
MPNST molecular pathobiology
The hallmark of NF1 and NF1-related MPNST is the loss of neurofibromin expression. Neurofibromin is a 220 kDa protein encoded on chromosome 17q11.2 with Ras-GTPase-activating protein activity that functions as a tumour suppressor (Refs Reference Perry31, Reference Bottillo32). Moreover, many sporadic MPNSTs also display mutations in the NF1 gene.
Loss of neurofibromin expression is considered a tumour-promoting event, leading to the constitutively increased activation of Ras and its downstream effectors (Refs Reference Tang43, Reference Ingram44, Reference Yang45, Reference Donovan46, Reference Lau47, Reference Zhang48). However, loss of neurofibromin activity is not sufficient for malignant transformation, implying that additional genetic alterations are necessary for the development of MPNST. A number of potential deregulations have been proposed; several include mutations of genes important in cell cycle regulation (Refs Reference Holtkamp49, Reference Mawrin50). The most widely investigated is p53 (TP53), a ubiquitous tumour suppressor that has a ‘gatekeeper’ role in cell survival and is disrupted in approximately half of all human cancers. In MPNST, p53 is frequently mutated, with loss of protein expression or accumulation of nonfunctional protein in the nucleus and inability to initiate apoptosis (Refs Reference Menon34, Reference Mawrin50, Reference Schneider-Stock51, Reference Kindblom52). Homozygous deletions of the CDKN2A gene, which encodes both p16INK4A and p14ARF in alternative reading frames, as well as inactivation of CDKN1B, a gene that encodes the p27 (KIP1) cell-cycle regulator, have been described (Refs Reference Holtkamp49, Reference Kourea53, Reference Nielsen54, Reference Kourea55, Reference Perry56). A study using comparative genomic hybridisation (CGH) to compare MPNST and neurofibromas suggested MPNST-specific gene alterations, including changes in the genes HGF, MET, PDGFRA, ITGB4, MMP1 and HMMR (Ref. Reference Mantripragada57).
Although MPNST is treated today as a single diagnostic entity, subdivision into sporadic and NF1-related MPNST may allow more individualised treatment, since NF1-related and sporadic MPNSTs may not always share the same molecular alterations. For instance, mutations in p53 appear to be more often associated with sporadic MPNST, whereas hyperactivation of Raf and the phosphoinositide 3-kinase (PI3K)–AKT pathway are observed to a higher degree in MPNST cell lines derived from NF1 patients (Refs Reference Holtkamp33, Reference Menon34, Reference Birindelli35, Reference Legius36, Reference Johannessen37, Reference Ambrosini38). There may be more frequent occurrence of increased epidermal growth factor receptor (EGFR) gene copy number in NF1-related MPNSTs (Ref. Reference Perrone39). Despite these findings, expression profiling studies have failed to identify a recurrent, unique molecular signature that distinguishes NF1-related from sporadic MPNST (Ref. Reference Watson40). Nevertheless, it is thought that MPNST most likely constitutes a cluster of molecularly distinct tumours sharing a histological phenotype (Refs Reference Watson40, Reference Mahller41, Reference Mattingly42).
Aberrant signal transduction
Recent years have witnessed significant interest in signal transduction pathways; such investigations have resulted in design and development of novel drugs targeting those intermediates that ‘switch on’ proliferation (or other important functions) in a pro-oncogenic pathway. Unravelling commonly deregulated pathways in MPNST may allow specific targeting of relevant pathways in this tumour.
The NF1–Ras pathway
A strong rationale underlies focusing on the neurofibromin-regulated Ras pathway as a potential treatment target in MPNST given the high frequency of loss of neurofibromin function in the vast majority of NF1-associated MPNST and many sporadic cases (Refs Reference Perry31, Reference Bottillo32) (Fig. 1). Loss of heterozygosity of NF1 is assumed to be universal in the setting of NF1. The exact prevalence of loss of neurofibromin function in sporadic MPNST is not known as the numerous fashions in which gene function can be lost currently defy sensitive detection. Neurofibromin is a cytosolic protein that is highly expressed in neural tissues, kidney, spleen and bone (Ref. Reference Theos and Korf58). The interaction between neurofibromin and Ras is essential for normal cell signalling. The GTPase-activating domain of neurofibromin accelerates the hydrolysis of active GTP-bound Ras to an inactive GDP-bound form, resulting in suppression of the Ras signalling pathway (Refs Reference Ballester59, Reference Xu60). Since neurofibromin suppresses Ras signalling, it functions as a tumour suppressor.
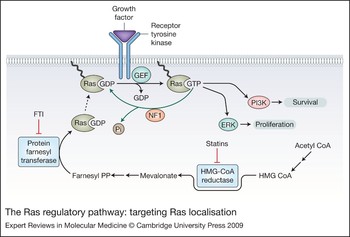
Localisation of Ras to the inner surface of the cell membrane, along with its capability to commence protumourigenic signalling, may occur more efficiently after switching from a GDP-bound inactivated state to a GTP-bound activated state (Ref. Reference Daum61). GEF (guanine-nucleotide-exchange factor) adaptor molecules are recruited to the cytoplasmic domain of stimulated tyrosine kinase receptors (TKRs), which serve as a docking site. Efficient GEF-catalysed nucleotide exchange depends upon membrane localisation of Ras. Ras membrane binding requires a sequence of post-translational modifications (Ref. Reference Fu and Casey62) in which a 15-carbon farnesyl group donated by a farnesyl pyrophosphate is covalently linked to the cysteine of the Ras C-terminal domain (prenylation). Following this attachment, the last three residues of the Ras C-terminus are cleaved and the prenylated cysteine is methylated and available for membrane localisation. The final relocalisation of Ras to the inner portion of the extracellular membrane from the cytosol is a rate-limiting step that controls Ras oncoactivity (Refs Reference Rubio63, Reference Basso, Kirschmeier and Bishop64, Reference Roy65). Activated Ras initiates a wide variety of signal transduction pathways that control diverse processes such as cytoskeletal integrity, proliferation, cell adhesion, apoptosis, and cell migration. Among the downstream effector pathways activated by Ras are the PI3K–AKT and Raf–MEK–ERK signalling pathways discussed below.
The abnormal presence of intracellular elevated and activated GTP-bound Ras in MPNST has focused interest on Ras as a potential target for MPNST treatment. The strategy pursued was to hamper Ras attachment to the inner cellular membrane (Fig. 2). Several drugs achieve this by interfering with post-translational prenylation of Ras. The drugs fall into two major categories based on their enzymatic target. The first is the statin family, which inhibits HMG-CoA reductase, the rate-limiting enzyme in cholesterol synthesis (Refs Reference Roy65, Reference Wong66), and has been widely applied clinically for many years as a cholesterol-lowering treatment. However, inhibiting the HMG-CoA reductase affects synthesis of farnesyl pyrophosphate, an intermediate on the cholesterol biosynthesis pathway and donor of the lipid farnesyl group (Ref. Reference Morgan, Ganser and Reuter67). Preclinical studies with lovastatin (Refs Reference Mendola and Backer68, Reference Sebti, Tkalcevic and Jani69) demonstrated that even low drug concentrations, in the micromolar range, prevent prenylation and membrane localisation of Ras. Recent preclinical data have shown that the combination of lovastatin with a farnesyl protein transferase inhibitor (FTI; to be discussed below) reduced Ras prenylation, induced cell cycle G1 arrest, and increased caspase activity (a signal promoting apoptosis) in two MPNST cell lines (NF90-8 and ST88-14), and no toxic effects were observed in the normal rat Schwann cells (Ref. Reference Wojtkowiak70). Statins have also been explored in NF1 patients as a means to improve neurocognition, which is impaired in many NF1 patients. Simvastatin failed to improve neurocognitive and learning deficits in NF1 children (Ref. Reference Krab71), and similar Phase I trials evaluating lovastatin in children and adults with NF1 are still ongoing (NCT00853580, NCT00352599). Although these trials are related to neurocognition in NF1 they could still benefit MPNST patients, for whom statin trials have yet to be conducted. For example, a safe toxicity profile in NF1 patients might hasten evaluation of statins in clinical trials aimed at prevention of NF1-related MPNST.
The Ras regulatory pathway: targeting Ras localisation. Localisation of Ras to the cytoplasmic surface of the cell membrane is required for efficient signalling. The farnesylation of Ras can be interrupted at the level of lipid biosynthesis and at the level of protein prenylation. The statin drug family inhibits HMG-CoA reductase and the farnesyl transferase inhibitors (FTIs) directly inhibit protein farnesyl transferase. Activation of Ras requires exchange of GDP for GTP downstream from receptor tyrosine kinase activation and mediated by guanine-nucleotide-exchange factors (GEFs). The hydrolysis of GTP to GDP is an intrinsic enzymatic of activity of Ras, but is further catalysed by the NF1 gene product neurofibromin. The ERK and PI3K pathways are both activated by Ras. Abbreviations: ERK, extracellular-signal-regulated kinase (also known as mitogen-activated protein kinase, MAPK); farnesyl PP, farnesyl pyrophosphate; FTI, farnesyl transferase inhibitor; GDP, guanine diphosphate; GEF, guanine-nucleotide-exchange factor; GTP, guanine triphosphate; HMG-CoA, 3-hydoxy-3-methylgluteryl-coenzyme A; NF1, neurofibromin; Pi, inorganic phosphate; PI3K, phosphoinositide 3-kinase; statins, statin family of HMG-CoA reductase inhibitors.

The second group of drugs abrogating Ras membrane localisation is the FTI family. The farnesyl transferase enzyme is responsible for covalently binding a farnesyl group to Ras. Interestingly, alternative prenylation of KRAS by geranylgeranyl transferase was suggested to take place when farnesyl transferase is inhibited. While detailed in vivo data for this putative mechanism in sarcoma and in MPNST in particular are lacking, it is possible that failure to respond to single-agent FTI in vivo may be overcome by adding also a geranylgeranyl transferase inhibitor (Refs Reference Sun72, Reference Rowell73).
In vitro studies show growth inhibition of an NF1-associated MPNST cell line (ST88-14) using the FTI BMS-186511. In the clinic, an FTI has been examined in young NF1 patients with deep neurofibromas as a means of chemoprevention, with good patient tolerance profiles (Refs Reference Yan74, Reference Widemann75). Efficacy evaluations of the FTI tipifarnib as a chemoprevention measure to counter de novo development or recurrence of cancer in NF1 patients who have plexiform neurofibromas are anticipated following the analysis of a Phase II trial that is now concluding (NCT00029354). There have been several Phase I trials that examine the role of tipifarinib in combination with other targeted biological agents such as erlotinib (NCT00085553) or sorafenib (NCT00244972); such combinations may confer synergistic antitumour effects. It should be noted that all trials discussed above are only the initial steps in exploring this family of drugs for MPNST patients; clinical deployment, if successful, remains to be achieved.
The Raf–MEK–ERK pathway
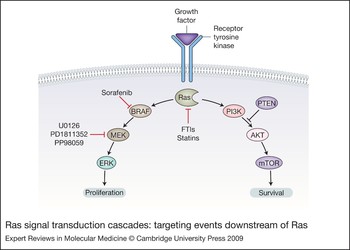
Multiple lines of evidence support the importance of the Raf–MEK–ERK pathway [also known as the mitogen-activated protein kinase (MAPK) pathway] downstream of Ras in controlling the proliferative capacity of MPNST in general and NF1-related MPNST in particular (Refs Reference Johannessen37, Reference Mattingly42, Reference Lau47, Reference Yan74). Activation of this pathway results in the transcriptional induction of cyclin D1, with activation of cyclin-dependent kinase 4 (CDK4), phosphorylation of the retinoblastoma protein pRB (RB1), and continued cell cycle progression from G1 to S phase (Refs Reference Chang76, Reference Lavoie77). Raf is an immediate downstream effector of Ras. There are three different but highly similar forms of Raf: CRAF (RAF1), ARAF and BRAF. Following recruitment and activation of Raf after its association with activated GTP-Ras at the cell membrane (Ref. Reference Ambrosini38), it initiates a mitogenic kinase cascade by phosphorylating the downstream kinase MEK (‘MAPK kinase’) on two serine residues (Ref. Reference Katz and McCormick78), which subsequently phosphorylates ERK (extracellular-signal-regulated kinase; or MAPK). Phosphorylated MEK (pMEK) has been found to be a surrogate marker for activated Ras. The tumourigenic effect of pMEK is supported by its overexpression in greater than 90% of MPNST tissues compared with expression in 21% of benign neurofibromas (Ref. Reference Zou19). Several factors identify the Raf–MEK–ERK pathway as an attractive therapeutic target in MPNST: its heightened stimulation by Ras activation as a result of loss of neurofibromin; its role in promoting cell proliferation and survival; and its further upregulation in MPNST. Both Raf and MEK have been targeted in MPNST (Fig. 3).
Ras signal transduction cascades: targeting events downstream of Ras. Ras regulates the downstream ERK and PI3K pathways involved in cell proliferation and survival, respectively. Clinically relevant agents can inhibit this pathway at the level of BRAF and MEK. PI3K–mTOR inhibitors are depicted in Figure 4. Abbreviations: BRAF, B-Raf proto-oncogene serine/threonine-protein kinase; ERK, extracellular-signal-regulated kinase (also known as mitogen-activated protein kinase, MAPK); GF, growth factor; mTOR, mammalian target of rapamycin; PI3K, phosphoinositide 3-kinase.

BAY 43-9006, also known as sorafenib, is a tyrosine kinase inhibitor designed as an inhibitor of Raf-dependent MEK phosphorylation activities. Its reported inhibition of BRAF and not CRAF may be beneficial in that BRAF has higher affinity for MEK (Ref. Reference Lavoie77). However, sorafenib is not specific to interactions with BRAF and exerts inhibitory effects on proliferation and angiogenesis via inhibition of TKRs including vascular endothelial growth factor receptor (VEGFR) types 1, 2 and 3 (FLT1, KDR and FLT4), platelet-derived growth-factor receptor β (PDGFR-β/PDGFRB) and mast/stem cell growth factor receptor KIT (Ref. Reference Rini79). In MPNST cell lines, the levels of activated Ras in NF1-deficient cells appear to be a good predictor for MPNST cell sensitivity to sorafenib (Ref. Reference Ambrosini38). Despite these in vitro results, sorafenib has been disappointing as a single agent, inducing only minor responses in a Phase II clinical trial involving MPNST patients (Ref. Reference Maki80). Currently, sorafenib is being evaluated alone or in combination with ifosfamide or dacarbazine in Phase I/II and Phase II trials; MPNST patients are eligible for inclusion (NCT00541840, NCT00837148). Sorafenib efficacy might be improved by combining it with other targeted drugs, aiming for synergism with clinical efficacy. Sorafenib is also being studied as a possible prophylaxis agent in an ongoing Phase I trial for young NF1 patients with unresectable deep neurofibromas.
MEK1 (MAP2K1) and MEK2 (MAP2K2), located downstream of Raf, are activated upon direct phosphorylation by Raf and are currently under evaluation as a therapeutic target in advanced MPNST (Ref. Reference Diwakar81). Treatment of MPNST cell lines (ST88-14 and STS26T) with the MEK-blocking agents U0126, PD184352 (CI-1040) and PD98059 resulted in concentration-dependent suppression of proliferation (Refs Reference Mattingly42, Reference Dilworth82). Other MEK inhibitors such as AZD6244 have been evaluated in Phase I and II clinical trials; however, these trials are accruing patients with advanced solid malignancies or carcinoma and not MPNST patients specifically (NCT00463814, NCT00085787).
The PI3K–AKT–mTOR pathway
The PI3K–AKT–mTOR (mechanistic or mammalian target of rapamycin; MTOR) pathway is another cascade that may be initiated by activated Ras in neurofibromin-deficient MPNSTs (Refs Reference Perry31, Reference Johansson83) (Fig. 3). Ras can directly activate PI3K, which catalyses the formation of phosphatidylinositol 3,4,5-trisphosphate [PI(3,4,5)P 3] and phosphatidylinositol 3,4-bisphosphate [PI(3,4)P 2]. These two phospholipids enhance the translocation of 3-phosphoinositide-dependent protein kinase 1 (PDPK1/PDK1) and perhaps other serine/threonine kinases to the cell membrane. Full activation of AKT by dual phosphorylation of Ser473 and Thr308 enables the direct phosphorylation of numerous downstream substrates including the serine/threonine kinase mTOR. mTOR constitutes a control point to integrate growth factor stimulation of TKRs with the energy-sensing pathway that regulates influx of nutrients. mTOR exists within cells in two complexes – mTORC1 and mTORC2 – in which mTOR is bound to Raptor (RPTOR; regulatory associated protein of MTOR, complex 1) and Rictor (RICTOR; rapamycin-insensitive companion of mTOR or RPTOR independent companion of MTOR, complex 2), respectively. TORC1 signals downstream to S6 kinase/ribosomal (S6K1/RPS6KB1) and the 4EBP1/eIF4E (EIF4EBP1, eukaryotic translation initiation factor 4E binding protein 1; EIF4E, eukaryotic translation initiation factor 4E) pathway to control protein translation of key mRNAs important in tumour progression (Ref. Reference Guertin and Sabatini84). mTORC2 may phosphorylate its upstream AKT effector, resulting in positive feedback and further elevation of mTORC1 activity. Negative feedback is mediated by active S6K1, through inhibitory phosphorylation of insulin receptor substrate (IRS1) protein. Phosphorylated IRS1 no longer activates PI3K and the net effect is reduced AKT activation (Ref. Reference LoPiccolo85).
AKT and mTOR are both abnormally activated in MPNST; a recent study demonstrated increased AKT/mTOR activation both in human MPNST cell lines (NF1-related SNF02.2, SNF96.2, T265 and ST88, and sporadic MPNST STS26T) and in MPNST human specimens (N = 96) (Ref. Reference Zou86). Activation of this pathway potentially enhances malignant growth and cell cycle progression (Refs Reference Johannessen37, Reference Johansson83, Reference Zou86). The mTOR pathway has emerged as a promising target for MPNST therapy (Fig. 4).
Targeting the PI3K–mTOR pathway. Rapamycin analogues can be used to inhibit the mTOR pathway, but as they inhibit only the mTORC1 arm, feedback inhibition of IRS1 is withdrawn and mTORC2 is free to directly mediate AKT activation leading to a ‘paradoxical’ increase in AKT activity. This pathway can also be inhibited at the level of PI3K, which may partially ameliorate the activation of AKT in response to rapamycin analogues. Abbreviations: 4EBP1 and e1F4E, eukaryotic translation initiation factors 4E binding protein 1 and 4E, respectively; FTI, farnesyl transferase inhibitor; IRS1, insulin receptor substrate 1; mTOR, mammalian target of rapamycin; mTORC1/2, mTOR, mammalian target of rapamycin complex 1/2; PI3K, phosphoinositide 3-kinase; S6K1, S6 kinase/ribosomal; TSC1/TSC2, tuberous sclerosis protein 1/2.

Rapamycin, also known as sirolimus, is the prototypic mTOR inhibitor. Initially classified as a macrolide antibiotic after it was isolated from the soil of Easter Island, it was later identified as an antifungal agent in the mid-1970s (Ref. Reference Vezina, Kudelski and Sehgal87). Two decades later, rapamycin received approval of the US Food and Drug Administration (FDA) as an immunosuppressant for use after renal transplantation. Rapamycin also exhibits potent anticancer activity through its binding to intracellular immunophilin FKBP12 (FKBP1A). The resultant complex binds the FK-rapamycin domain of mTOR. The poor water solubility and chemical instability of rapamycin led to the synthesis of several rapamycin analogues [temsirolimus (CCI-77), everolimus (RAD-001) and deforolimus (AP23573)], that differ only slightly in chemical composition yet possess more favourable pharmaceutical characteristics (Ref. Reference Sabatini88). These compounds function mainly as mTORC1 inhibitors, abrogating the downstream signalling of protein translation initiation (Ref. Reference Wan and Helman89). Rapamycin and/or the rapamycin derivative RAD001 (everolimus) were reported to inhibit proliferation of MPNST cell lines derived from NF1-related and sporadic MPNSTs (MPNST ST26T, ST8814, ST88-3, S462 and T265p21) and to interfere with xenograft growth of ST26T cells (Refs Reference Johannessen37, Reference Johansson83). There is evidence that rapamycin also exerts its antitumourigenic effect by interrupting angiogenesis in vivo (Ref. Reference Guba90). Although initially promising, the effect of rapamycin and its analogue RAD001 on tumour proliferation is transient, and tumours regrow after withdrawal of treatment. This may suggest that rapamycin as well as other rapamycin analogues function as tumouristatic rather than tumouricidal agents (Refs Reference Johannessen37, Reference Johansson83). Since rapamycin is a preferential mTORC1 inactivator, it induces a feedback activation loop of mTORC2. While rapamycin selectively inhibits mTORC1, the mTORC2 complex continues to be active and may phosphorylate AKT. In addition, the negative feedback mechanism exerted on AKT through PIK3/IRS is blocked by rapamycin inhibition of mTORC1. Both mechanisms lead to a paradoxical effect of AKT stimulation (Refs Reference Wan and Helman89, Reference Sun91, Reference Wang92).
Despite these limitations, several rapamycin analogues are currently in clinical soft tissue sarcoma trials that include MPNST patients (Ref. Reference Wan and Helman89). Deforolimus has shown promising clinical results in the treatment of sarcoma in a Phase I trial (Ref. Reference Mita93). A Phase II trial of intravenous deforolimus was administered to 212 patients with advanced, heavily pretreated sarcoma. The investigators reported at the 2007 American Society of Clinical Oncology (ASCO) meeting that more than 25% of patients achieved clinical benefit (objective response or stable disease for ≥16 weeks, the primary endpoint of the study) (Ref. Reference Chawla94). At the next annual ASCO meeting in 2008, increased experience with both infused and oral deforolimus formulations was reported, indicating that target levels could be reached while improving drug administration convenience (Ref. Reference Fetterly95). The Sarcoma Multi-Center Clinical Evaluation of the Efficacy of Deforolimus (SUCCEED; NCT00538239) trial is currently evaluating maintenance therapy with oral deforolimus in patients with chemotherapy-responsive metastatic soft tissue sarcoma or bone sarcoma (Ref. 96). With an expected enrolment of 650 patients, this trial should be powered to assess responses in specific soft tissue sarcoma histologies including MPNST. Sirolimus is being tested in two different trials for NF1 patients with deep neurofibromas that cannot be removed by surgery, as both treatment and possible prevention of MPNST development (NCT00652990, NCT00634270).
To enhance the efficacy of mTOR inhibitors, combination therapies are being evaluated. RAD001 has been studied in combination with erlotinib (an EGFR inhibitor) or doxorubicin in vivo and in vitro. Although erlotinib had no activity as a single drug, when combined with RAD001 it rendered an additive inhibitory effect on cell growth in vitro and the combination extended survival of tumour-bearing mouse in vivo. However, doxorubicin combined with RAD001 showed no added benefit when applied to cell lines or established tumours in mice (Ref. Reference Johansson83). Dual mTOR and AKT inhibition seeks to avoid undesired competing AKT activation triggered by rapamycin. AKT blockade may be pursued either through PI3K upstream inhibition or directly by inhibiting AKT phosphorylation. Recently, dual PI3K/AKT and mTOR inhibitory compounds such as PI-103 and LY294002 have been developed; PI-103 has effective activity in preclinical glioma, breast, ovarian and prostate tumour models (Ref. Reference Raynaud97). Both PI-103 and LY294002 have been evaluated in MPNST cell lines (STS26T, T265, ST88) and showed a dose-dependent cell growth inhibitory effect. PI-103 abrogated cell growth through G1 cell cycle arrest and induction of autophagy (Ref. Reference Zou86). In addition, it abolished the paradoxical AKT activation induced by mTOR inhibitors such as rapamycin, supporting the efficacy of such dual inhibitory approaches.
Deregulated tyrosine kinase receptors
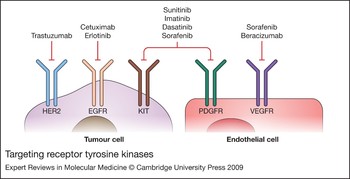
TKRs are a family of cell-surface receptors sharing a similar structure and function as the primary mediators of cell signalling (Fig. 5). Upon TKR activation via an appropriate ligand, a cascade of protein interactions occurs, releasing positive and negative control signals for a myriad of cellular processes that include cell cycle regulation, proliferation, adhesion, migration, invasion and survival. TKRs are not only key regulators of normal cellular processes but also play a critical role in the development and progression of many types of malignancy. In normal cells, cellular TKR activation is tightly regulated. In cancer cells, control of TKR signalling is lost and aberrant signalling is activated by various mechanisms including mutations and overexpression of TKRs and their ligands. The association of uncontrolled TKR signalling with tumourigenesis has provided the rationale for development of TKR inhibitors (TKRIs). Two main strategies have been utilised for TKR inhibition: monoclonal antibodies and small-molecule inhibitors. The antibodies target either the extracellular domain of a TKR or its ligand, ultimately preventing the ligand binding and activation. The small molecules are designed to target the intracellular ATP-binding and catalytic domain of TKRs. These TKR-targeted agents have been shown to be effective in treating a variety of malignancies, alone or in combination with conventional chemotherapeutics. Deregulation of several TKRs has been identified in MPNST, as discussed below.
Targeting receptor tyrosine kinases. All of the pathways depicted in Figures 2, 3 and 4 can be initiated by specific growth factors binding to a variety of cell-surface receptor tyrosine kinases (RTKs). Some of these may be important on the tumours cells while others serve to stimulate and maintain angiogenesis such as the VEGF receptor (which can be stimulated by VEGF produced by tumour cells). Numerous antagonists of these RTKs are clinically available and several inhibit more than one RTK. Abbreviations: EGFR, epidermal growth factor receptor; HER2, human epidermal growth factor receptor 2; KIT, v-kit Hardy-Zuckerman 4 feline sarcoma viral oncogene homologue; PDGFR, platelet-derived growth factor receptor; VEGF, vascular endothelial growth factor; VEGFR, vascular endothelial growth factor receptor.

EGFR
The epidermal growth factor receptor (EGFR) family comprises four members: EGFR (HER1), HER2 (ERBB2), HER3 (ERBB3) and HER4 (ERBB4). All are transmembrane TKRs except HER3, which lacks tyrosine kinase activity. EGFR is overexpressed in many epithelial cancers as well as in soft tissue sarcomas including MPNST (Ref. Reference Gschwind, Fischer and Ullrich98). All receptor subtypes tend to dimerise as homodimers and/or heterodimers following the binding of an appropriate growth factor ligand. Constitutive activation of signalling via the EGFR family promotes uncontrolled proliferation, tumour cell survival, adhesion, migration, differentiation and resistance to therapy (Ref. Reference Yarden99). Although all four receptors can potentially serve as therapeutic targets, most studies have focused on EGFR and HER2 since drugs targeting these receptors – erlotinib and trastuzumab, respectively – have already received FDA approval (Ref. Reference Holtkamp49).
EGFR appears to be a key player in MPNST, and is overexpressed in MPNST tissues (Refs Reference Holtkamp49, Reference Perry56, Reference DeClue100). One study found that 62% and another found that 29% of MPNSTs express EGFR (Refs Reference DeClue100, Reference Tawbi101, Reference Albritton102). EGFR is abundantly expressed in MPNST cell lines compared with normal Schwann cells, which MPNST cells may resemble (Ref. Reference DeClue100). Mouse models have been developed to enhance understanding of the role of EGFR and other proteins in disease and for evaluation of new therapeutics. Studies in genetically engineered mice lacking both normal Nf1 alleles (Nf1 −/−) and Trp53 (encoding p53) were found to develop soft tissue sarcomas (Ref. Reference Li103). Cell lines derived from these murine tumours demonstrate extensive overexpression of EGFR, in keeping with studies in which NF1 and non-NF1 MPNST human cell lines (four types) as well as more than 20 transformed Schwann cells derived from Nf1 −/− mouse embryos were found to overexpress EGFR (Refs Reference DeClue100, Reference Ling104). EGFR overexpression may be the result of EGFR gene amplification, reported to occur due to chromosome 7 polysomy sometimes also combined with EGFR locus amplification (Refs Reference Perry56, Reference Holtkamp105).
Accumulating evidence supports the putative role of EGFR in MPNST; EGFR overexpression correlates with more aggressive disease course, advanced stage at presentation, higher tumour mitotic rates, and poor overall outcome (Ref. Reference Keizman106). Mean 5-year disease-free survival was 17.4 months for patients overexpressing EGFR versus 30.1 months for patients lacking overexpression (P = 0.048). Five-year overall survival rates were likewise significantly impacted by EGFR overexpression (mean 52% vs 25%; P = 0.04) (Ref. Reference Keizman106). In light of these adverse prognostic findings, EGFR overexpression in tumours renders EGFR a very attractive target for anti-MPNST therapy.
As discussed above, inhibition of EGFR signalling can be achieved by small-molecule TKRIs or monoclonal antibodies. Erlotinib or gefitinib are both EGFR TKRIs that target the cytoplasmic ATP-binding site of the receptor required for kinase activity (Ref. Reference Raymond, Faivre and Armand107). This prevents autophosphorylation and downstream targets are not activated. In vitro studies demonstrate that growth and invasion potential of MPNST cell lines are inhibited in the presence of erlotinib (Refs Reference Holtkamp49, Reference Su108). In vivo, erlotinib was evaluated in mice xenografted with ST26T MPNST, demonstrating tumour antiangiogenic and antiproliferative responses (Ref. Reference Mahller109). Clinical trials of both drugs are in progress. Gefitinb was well tolerated in a Phase I trial (Ref. Reference Herbst110). A recent Phase II study evaluated erloitinib in metastatic and unresectable MPNST patients; however, no objective responses were observed in any of 20 treated patients, and the trial was closed to further accrual (Ref. Reference Albritton102). These disappointing results argue against empirical use of erlotinib as monotherapy. However, it is still possible that these EGFR inhibitors may be effective in specific patient subsets, such as patients with MPNSTs expressing activated EGFR (pEGFR) or containing certain EGFR mutations. However, one study demonstrated that only 3% of MPNST that were examined expressed pEGFR, and correlation with therapeutic response was not performed (Ref. Reference Tawbi101).
Recent findings in colon carcinoma and non-small-cell lung carcinoma suggest that various molecular deregulations can predict response to EGFR inhibition. KRAS/BRAF activation, PI3KCA activation or loss of expression of the lipid-phosphatase tumour suppressor PTEN have all been described as significantly associated with poor responses to EGFR inhibitors (Refs Reference Benvenuti111, Reference van Zandwijk112, Reference Perrone113, Reference Frattini114). Because the PI3K–AKT signalling pathway is hyperactivated in both NF1 and sporadic subtypes of MPNST (discussed above), it is conceivable that resistance to EGFR inhibition, localised to the beginning of this signalling cascade, results in uncontrolled signalling downstream to EGFR (Ref. Reference Perrone39). In that context, a combination therapeutic strategy may prove more effective in MPNST. If activation of AKT, ERK and mTOR contribute to EGFR resistance, then targeting both EGFR and additional downstream targets may have synergistic antitumour impact (Ref. Reference Perrone39). This was observed when MPNST xenografts were treated with a combination of erlotinib and RAD001 (Ref. Reference Johansson83).
The second EGFR family member, HER2, is expressed in most MPNST cell lines and is absent in benign neurofibromas (Ref. Reference Holtkamp49). However, the role of HER2 as a therapeutic target for MPNST therapy is uncertain (Ref. Reference Holtkamp49). Trastuzumab, a humanised monoclonal antibody that binds to the extracellular segment of the HER2 receptor, was reported to inhibit cell proliferation in a non-dose-dependent manner, suggesting that HER2 may not be a useful therapeutic target in MPNST (Ref. Reference Holtkamp49). Nonetheless, despite these inconclusive in vitro results it is possible that trastuzumab efficacy is dependent upon the in vivo immune environment, which is not represented in an in vitro experimental construct (Ref. Reference Holtkamp49). It may also be worthwhile to consider the role of multi-EGFR inhibitors such as lapatinib, which inhibits both EGFR and HER2 and is already used to treat breast cancer (Ref. Reference Geyer115). Such dual inhibition may block crosstalk among heterodimers, leading to enhanced therapeutic efficacy (Ref. Reference Holtkamp49).
Platelet-derived growth factor receptor
Platelet-derived growth factors (PDGFs) and their TKRs (PDGFRs) have been identified in many malignancies, including soft tissue sarcomas. The PDGF system consists of three receptor subtypes: PDGFR-α and PDGFR-β homodimers, and PDGFR α–β heterodimer. In general, PDGF ligands binding to PDGFRs act as mitogens for normal mesenchymal cells such as dermal fibroblasts and smooth muscle cells (Ref. Reference Heldin and Westermark116) and appear to play a role in normal physiological processes such as wound healing, angiogenesis and platelet aggregation. A total of four chains with different receptor-binding specificities exist for PDGF, which dimerise as homo- or heterodimers (Ref. Reference Betsholtz, Karlsson and Lindahl117). For example, the ligand subtype PDGF-ββ is formed of two dimerising β chains. In MPNST, this ligand was reported to have higher affinity to PDGFR-β and binding has been associated with MPNST tumourigenic potential (Ref. Reference Badache and De Vries118). When compared with normal Schwann cell expression, the MPNST expression level of PDGFRs varies across studies, with some reporting overexpression (Refs Reference Holtkamp119, Reference Holtkamp120) and others reporting similar expression levels (Ref. Reference Dang and DeVries121). Both Schwann cells and MPNST cells respond to receptor ligation with activation of both PI3K–AKT and Ras–MAPK signal transduction pathways (Refs Reference Dang and DeVries121, Reference Jones and Kazlauskas122). Despite activation of the same pathways following PDGFR phosphorylation, such activation in MPNST appears to confer a proliferation advantage relative to Schwann cells. One study linked these proliferation effects to intracellular calcium levels, demonstrating that PDGF-ββ binding to the PDGFR-β in NF1-related MPNST cells was associated with phosphorylation of calmodulin kinase II (Ref. Reference Dang and DeVries121). Such phosphorylation resulted in a specific increase of calcium in the MPNST cells that was absent in normal Schwann cells. This elevated level of intracellular calcium unique to MPNST cells correlated directly with their proliferation potential, possibly by promoting distinct mitogenic signalling over and above that provided by the PI3K–AKT and Ras–MAPK signal transduction pathways; such mitogenic signalling might be responsible in part for the proliferation potential of MPNST (Ref. Reference Dang and DeVries121).
PDGFR was reported to play an active role not only in tumour proliferation but also in tumour invasive potential (Ref. Reference Aoki123). PDGF-ββ was overexpressed in MPNST cell lines and induced invasion of these cells through PDGF-β receptor phosphorylation (Ref. Reference Aoki123). In addition, PDGFR-α levels were found to be increased in MPNST mainly due to PDGFRA gene amplification (Ref. Reference Holtkamp120), raising interest in targeting PDGFRs. Several preclinical studies using the PDGFR inhibitor imatinib mesylate have shown promise in MPNST (Refs Reference Holtkamp120, Reference Aoki123, Reference Buchdunger124). Imatinib mesylate suppresses invasive activity and cell growth of MPNST cell lines by inhibiting PDGF-αα-induced PDGFR-α phosphorylation and PDGF-ββ-induced PDGFR-β phosphorylation (Refs Reference Aoki123, Reference Buchdunger124).
In addition to its anti-PDGFR activity, imatinib mesylate is known to inhibit the transmembrane TKR KIT. Recent studies have demonstrated overexpression of KIT and its ligand SCF (stem cell factor; KITLG) in MPNST cell lines and tumours (Refs Reference Holtkamp120, Reference Badache, Muja and De Vries125). Other recent studies utilising genetically engineered mice suggest an important role for mast cells in development and progression of both deep and superficial neurofibromas (Refs Reference Reilly and Van Dyke126, Reference Zhu127). It seems that mast cells create a cytokine-rich microenvironment that promotes or is permissive for tumourigenesis. Mice lacking mast cells failed to develop neurofibroma. As KIT is an important receptor in mast cells it is possible that compounds such as imatinib mesylate can induce an inhibitory effect on NF1 neurofibromas that could result in a secondary anti-MPNST effect through halting the progression of these tumour precursors. Taken together, these findings favour clinical trial evaluation of imatinib mesylate as anti-MPNST therapy, especially for MPNSTs that express both KIT and PDGFR, as is now occurring in Phase II and III studies (NCT00427583). Dasatinib, another multi-TKR small-molecule inhibitor, blocks PDGFR in addition to SRC and KIT, and has been advanced to a currently accruing Phase II clinical trials for various soft tissue sarcomas, including MPNST (NCT00464620).
Vascular endothelial growth factor receptor
The MPNST microenvironment, particularly the vascular compartment, is promising as a therapeutic target if only because MPNSTs are dependent on angiogenesis to achieve their typically large presenting size (Ref. Reference DuBois and Demetri128). Angiogenesis, the formation of blood vessels to supply the needs of a growing tumour, is mainly dependent upon regulatory proteins released by the tumour. Among these proteins, VEGF appears to be key in sustaining tumour growth (Ref. Reference Hicklin and Ellis129). Produced by many kinds of cancer cells and also by certain types of normal cells, VEGF is synthesised within tumour cells and then secreted into the surrounding tissue for interaction with its cognate receptors, VEGFRs, located on the outer surface of endothelial cells (Fig. 5). VEGF binding to its receptor activates intracellular signalling, leading to endothelial cell proliferation, survival, migration and invasion. Thus VEGF, through activation of VEGFRs on endothelial cells, promotes vascularisation and growth of primary MPNST and may play a major role in MPNST metastatic progression (Ref. Reference Harper and Bates130).
Considerable evidence suggests that MPNSTs overexpress VEGF (Ref. Reference Wasa131). Several studies have demonstrated significantly higher VEGF expression levels in MPNST compared with neurofibroma (Ref. Reference Wasa131). Targeting the VEGF/VEGFR pathway confers several important potential advantages, including possibly decreased therapeutic resistance (endothelial cells are relatively stable genetically), improved drug access to targets (especially in large, hypoxic MPNST where the tumour per se may not be as accessible as tumour surface neovascularity), and (hopefully) modest toxicities. In a preclinical model a small-molecule inhibitor (SU5416) of VEGFR2 had no effect on MPNST cell lines in vitro; however, growth of human tumour explanted xenografts was reduced more than 50% compared with control (Ref. Reference Angelov132). Reduction in tumour growth was due to decreased tumour angiogenesis, leading to reduction of tumour cell proliferation and increased apoptosis. Sorafenib, an inhibitor of VEGFRs and other TKRs (discussed above), resulted in significant anti-MPNST effects in preclinical studies. However, a preliminary report of a Phase II trial indicated that it failed to show improvement in MPNST patients (Ref. Reference Maki80). Perhaps the most utilised (and studied) anti-VEGF treatment is bevacizumab, a humanised monoclonal antibody targeting the VEGF molecule. Bevacizumab has shown disappointing results in several soft tissue sarcoma subtypes. For example, when combined with doxorubicin in a Phase II trial, bevacizumab did not improve response rates in 17 patients, most of whom had metastatic leiomyosarcoma, compared with historic controls treated with single-agent doxorubicin (Ref. Reference D'Adamo133). A recent report discussed bevacizumab in a Phase I/II study of combination gemcitabine and docetaxel therapy for previously untreated soft tissue sarcoma patients (N = 27) (Ref. Reference Verschraegen134). Although the regimen appeared very active, with a 44% objective response rate, the relative benefit of bevacizumab is difficult to discern in that gemcitabine and docetaxel have significant activity in sarcoma (Refs Reference Verschraegen134, Reference Hensley135). To the best of our knowledge bevacizumab has not been examined in MPNST, and it is possible that combined targeting of both angiogenesis and direct soft tissue sarcoma cell inhibition will yield results for MPNST that are more favourable to those described above.
Conclusions
Low response rates of MPNST to conventional cytotoxic chemotherapy and radiation have shifted the interest towards novel biological drugs. However, several obstacles may impede the process.
First, MPNST tends to be studied through the simultaneously resolving and distorting lens of NF1, mainly because much more is known about the molecular pathobiology of NF1 than sporadic MPNST. Studying NF1 as a parent disease entity facilitates patient bioresource acquisition in that the NF1 patient population is much larger than the MPNST cohort. However this basis of understanding runs the risk of not identifying relevant biology that might be best discernable in sporadic rather than NF1-related MPNST, despite the difficulty in defining and reproducibly diagnosing sporadic MPNST.
Second, following the ‘bench to bedside’ paradigm, drugs are first tested in the research laboratory setting utilising cell lines and cell strains; after in vitro confirmation of activity, a candidate agent is advanced to in vivo animal model studies. All too often, despite substantial positive preclinical efficacy data, these novel compounds fail to demonstrate substantive antitumour activity in early clinical trials. The reasons for this gap in efficacy are varied, but tumour resistance (inherent or acquired), the presence of a human microenvironment compared with a typically murine preclinical microenvironment, and/or perhaps the administration of drugs at concentrations insufficient to ensure bioavailability may all play a role in lacklustre therapeutic responses.
Third, MPNST, as a rare disease, is especially challenging regarding optimal selection of patients for trial accrual and completion in a timely fashion. The small number of MPNST patients actually treated in most individual medical centres versus the problem of potentially competing trials for which a given patient may be eligible pose an additional set of challenges. And while having several potential trials may benefit individual patients, it runs the risk that no definitive answer will emerge from underpowered trials with slow accrual where the novel therapeutic under study may rapidly become yesterday's drug. Interest can be lost because a new finding raises an even more tantalising therapeutic prospect, if only enough patients can be accrued, and so the vicious cycle is perpetuated. Against the backdrop of new drugs in the development pipeline, the ‘warning shot across the bow’ of a future typified by smaller, lengthier and less conclusive trials must be actively worked against if it is to be avoided. To make the needed advancements on behalf of MPNST patients everywhere, patients and bioresources must be coalesced, and the wide spectrum of interested investigators persuaded to work together for common goals. Entities such as SARC (Sarcoma Alliance for Research through Collaboration) may represent examples of the needed aegis and play a role in constructing accrual linkages between academic consortia and the community, which is where the majority of MPNST patients are still treated.
Looking to the future, we need targeted drugs and smart clinical trials that take into account known genetic defects of tumours in a given small MPNST patient population. In so doing, the prospect of offering improved therapies to patients will be enhanced.
Acknowledgements and funding
This manuscript was supported by a National Foundation for Cancer Research (NFCR) Hope Fund seed grant (to D.L.), the M.D. Anderson Physician-Scientist Program (A.J.L), a Fellowship Grant from the Stanford and Joan Alexander Foundation, and the American Physician Fellowship for Medicine in Israel (to D.K.). We sincerely thank the four anonymous reviewers whose careful and comprehensive review significantly improved the quality of this manuscript.