Introduction
Organic standards emphasize the maintenance or improvement of the soil resource by building soil organic matter and increasing soil biological activity1. Organic management practices are intended to satisfy plant nutritional needs without drawing down soil reserves or polluting adjacent air or water resources. Several studies comparing organic and conventional agriculture have suggested that use of organic practices increases soil organic matter, soil biological activity and plant available nutrient stocksReference Scow, Somasco, Gunapala, Lau, Venette, Ferris, Miller and Shennan2–Reference Melero, Madejon, Herencia and Ruiz8. Most comparisons have been of conventional-tilled cash-grain systems with more diverse organic rotations amended with compost or animal manuresReference Bending, Turner and Jones6, Reference Bulluck, Barker and Ristaino9, Reference Watson, Atkinson, Gosling, Jackson and Rayns10. Less is known about the ability of organic vegetable-cropped systems or systems that are not amended with animal waste to build soil organic matter and increase fertility and biological activity. Results from horticultural systems have been mixed and appear to vary with disturbance intensity and amendments appliedReference Nelson, Lynch and Boiteau11, Reference Briar, Miller, Stinner, Kleinhenz and Grewal12. Systems relying exclusively on plant-based fertilityReference Knight, Buhler, Leeson and Shirtliffe13 may deplete soils through nutrient removal and lack of input, particularly for P and K. Appropriate testing tools would help growers evaluate the status of their soils and tailor management to maintain soil quality and yield without causing environmental harmReference Salmeron, Cavero, Quilez and Isla14, Reference Sydorovych, Raczkowski, Wossink, Mueller, Creamer, Hu, Bell and Tu15.
To make standard soil tests attractive to organic growers, approaches need to be modified. Standard testing protocols are used to determine whether available nutrient stocks will satisfy crop requirements with the goal of maximizing yieldReference Black16, Reference Havlin, Tisdale and Nelson17. The ‘basic soil test’ typically measures pH, total soil organic matter, available P, exchangeable K, magnesium (Mg), calcium (Ca) and sulfur (S) in soils collected from the surface depth only (0–15 cm) and before planting. Additional services frequently include determination of micronutrients if soils are naturally deficient. Accepted measurement techniques vary by region, with soil type and cropping complexityReference Black16. For example, soil testing methods in Illinois have been adopted following recommendations by the North Central Regional Soil Testing CommitteeReference Brown18 and their interpretation is guided by recent scientific research and delivered through Extension outlets. To serve organic growers, the basic soil test could be broadened to include soil quality measures that have the potential to provide insight into soil functions regulated by organic matter and microbial activityReference Knight, Buhler, Leeson and Shirtliffe13. Some of the most promising candidates for organic soil testing include labile fractions of soil organic matter and N availabilityReference Sydorovych, Raczkowski, Wossink, Mueller, Creamer, Hu, Bell and Tu15, Reference Sequeira, Alley and Jones19, which are often enriched compared to conventionally managed controlsReference VandenBygaart, Gregorich, Angers and McConkey20–Reference Nissen and Wander22. Soil testing for organic systems might also be improved by sampling organic matter and nutrient stocks contained within the full management zone, which extends beyond the current norm for soil testing in the top 15 cm of soil profile.
To develop an interpretive framework to evaluate standard and biologically based indicators within organic systems, upper and lower boundaries related to environmental and production concerns are needed. By establishing clear upper boundaries we can help growers avoid situations where nutrient concentrations are in excess and could degrade adjacent resources, such as waterReference Edmeades23, or have negative feedbacks on forage qualityReference Snyder, Leep and Barnes24. Relationships between multiple desired outcomes and soil test values can be established using non-linear scoring curvesReference Karlen, Stott, Doran, Coleman, Bezdicek and Stewart25. These types of curves (more is better, less-is-better and mid-point optimum) are commonly used for utility functionsReference Norgaard, Meffe and Carroll26, multi-objective decision makingReference Yakowitz, Stone, Lane, Heilman, Masterson, Abolt and Imam27 and systems engineeringReference Wymore28. Efforts to develop and adapt these basic curve shapes for soil applications have relied on literature review with indicator selection being based on statistical reduction and expert opinionReference Andrews, Karlen and Cambardella29. Functional relationships and associated weighting factors have been established using expert judgment based on indicator sensitivity to management, inherent soil properties and climate factors. The scoring curve for soil organic matter, for example, is an ascending logistic S-curve, or more-is-better function with a plateau, based on the contributions organic matter makes to fertility, water partitioning and structural stabilityReference Andrews, Karlen and Cambardella29. It might be appropriate to modify this function and others to include optimum values and associated declines in function with further increases in organic matter to protect the environment and encourage efficiency. For example, organic matter levels are thought to reach a maximum or saturation point that represents a dynamic equilibrium that is soil and system dependentReference Chung, Ngo, Plante and Six30. Setting appropriate maximum threshold values based on this understanding could prevent over-application of manures and composts and prevent unwanted waste or pollution. Similar ideas apply to organic fractions in soils, which cannot accumulate to unlimited levels without becoming problematicReference Seiter, Horwath, Magdoff and Weil31. Reviews by Watson et al.Reference Watson, Atkinson, Gosling, Jackson and Rayns10 and Nelson and JankeReference Nelson and Janke32 showed how both P and K increased to high levels in organic systems when surplus manure was applied. To avoid depletion or ‘mining of nutrients’ from soil (e.g., Andrist-Rangel et al.Reference Andrist-Rangel, Edwards, Hillier and Oborn33), lower limits need to be established. Studies have shown that both soil P and K test levels decline in some organic cash grain systemsReference Mäder, Flieβbach, Dubois, Gunst, Fried and Niggli5, Reference Gosling and Shepherd34, but it is not clear when and how those levels would limit productivity over time.
The goal of this study was to contribute to the development and application of soil tests for organic farming systems. The research was conducted in a study established at the University of Illinois at Urbana–Champaign with three different farming systems or strategies to transition to organic certification. Field plots managed under a perennial ley, row crop and vegetable system each received three types of organic amendments (cover crops + raw manure, cover crops + composted manure and cover crops only) applied at times and rates appropriate to the system. We expected soil resource status, estimated through conventional soil tests, to decline in the intensive vegetable and row crop-systems that received no manure or compost during transition. Additionally, we expected to detect soil test increases in systems with the lowest disturbance frequency and greatest amount of organic matter addition.
Our specific objectives were to evaluate: (1) changes in soil nutrient status and organic matter resulting from three distinct farming systems used in transition to organic production; (2) changes in soil properties expressed at two soil depths and (3) the commercial potential of biologically based test methods. Finally, we wanted to outline a framework for test interpretation and application to organic farming systems using a scoring curve approach. This method was selected because it was considered well suited to growers seeking to balance economic and environmental performanceReference Snyder, Leep and Barnes24, Reference Sparling, Schipper, Bettjeman and Hill35, Reference Andrews and Carroll36.
Materials and Methods
Site and treatment description
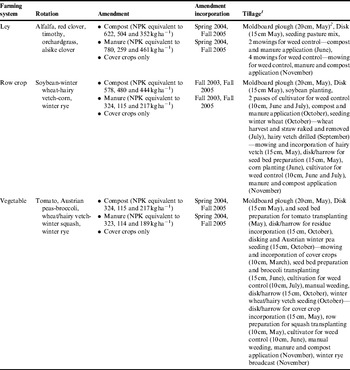
The Windsor Organic Research Trial occupies a 2.5 ha site on Catlin silt loam (moderately well drained, fine-silty, mixed, superactive, mesic Oxyaquic Argiudolls) and Drummer silty clay loam (poorly drained, fine silty, mixed, superactive, mesic Typic Endoaquolls) soils located at the University of Illinois at Urbana-Champaign campus. During the 4 years preceding the start of this study, the areas had been used for conventional soybean (Glycine max (L.) Merr.) production with inputs based on soil tests. In the spring of 2003, 36 experimental plots (33 × 13 m) were established to begin a 3-year transition period to meet the certification criteria for the National Organic Standards1, 37. Treatments were arranged in a split-plot design randomized in four blocks, in which farming systems were randomized to whole plots and organic matter amendments were randomized to split plots. The experiment compared three transitional farming systems used by growers in the US Midwest, varying in their need for inputs and cash flows. These farming system treatments were selected after consultation with an advisory board comprised of Illinois growers who had been farming organically for a decade or more. The treatments were: (1) ley fallow (low intensity); (2) row crop (intermediate intensity) and (3) vegetable (high intensity) systems. Organic matter inputs were: (A) cover crops + composted dairy manure; (B) cover crops + raw dairy manure, and (C) cover crops only. Each split plot was 372 m2. Applications of organic amendments were made on a system basis to satisfy N requirements, and timed to reflect practices commonly used by producers. Details on management practices are summarized in Table 1. Inclusion of a ‘conventional control’ that continued the previous practice for purposes of comparison was not appropriate for an organic transition study for several reasons, including restrictions by the granting agency and certification requirements that prohibit exposure to agrichemicals.
Crop rotation and field management summary at the Windsor Organic Research Trial during the three-year transition period.

1 Growing seasons are separated by em dashes.
2 Indicates the depth and month of cultural practice.
The entire experimental area was disked once and winter rye (Secale cereale L.) was seeded in the fall of 2002 before treatments were initiated in the spring of 2003. At that time, the plots assigned to the ley system were planted with a hay and pasture mix (untreated non-organic): alfalfa (Medicago sativa L. ‘Big Sky’; 29.5%), red clover (Trifolium pratense L. ‘Arlington’; 19.9%), timothy (Phleum pratense L. ‘Climax’; 19.9%), orchardgrass (Dactylis glomerata var. ‘Potomac’, 19.5%) and Alsike clover (Trifolium hybridum L.; 9.9%). This mixture was consistent with the transition and rotation strategies used by our collaborating farmers who were not limited by land availability. To prevent the establishment of perennial weeds, these plots were mowed to 15 cm two times in 2003, four times in 2004 and once in 2005 and all residues were left in place. A similar effect would have been achieved had we harvested the forage as hay. The row crop system was seeded to soybeans, followed by winter wheat (Triticum aestivum L., Gleason Grains, Bridport, Vermont) in 2003. When wheat was harvested in the following year (2004), straw was baled and removed from the field plots. After a brief fallow period, plots were planted with a hairy vetch (Vicia villosa Roth) green manure cover crop, which was followed in 2005 with corn (Zea mays L.) and winter rye. The vegetable system was planted in 2003 with tomato (Lycopersicon esculentum Miller) on raised beds. After harvest crop residues were incorporated and no winter cover crop was used. In the late winter of 2004 plots were disked and seeded with Austrian winter peas (Pisum sativum spp. arvense (L.) Poir.) as a green manure that was followed by broccoli (Brassica oleraceae L. ‘Gypsy’). After harvest, plant residues were flail mowed and incorporated before planting a mixture of winter wheat/hairy vetch cover crop followed by winter squash (Cucurbita maxima Duchesne ssp. andreana (Naudin) Filov) in the last year of transition. After harvest, winter rye cover crop was seeded.
Soil sampling and analyses
Soil samples were taken using soil testing protocols that are common in the North Central region. Soil samples taken in Spring 2003 before treatments were established were used as the baseline against which post-transition samples taken in Spring 2006 were compared to evaluate whether use of organic practices improved soil quality as is required by the National Organic Program standards1. To avoid edge effects, soil samples were collected from the center region of each split plot (11 m length) by avoiding 11 m along the outside length and 3 m along the width of each sampling area. Two cores (5 cm in diameter) were taken and divided in two depths (0–15 and 15–30 cm). The use of a larger core than the standard (2 cm in diameter) for soil testing was expected to reduce variability. In preliminary work (unpublished data), we have been able to achieve similar estimates of nutrient and labile fraction concentrations within plots by pooling two large cores (5 cm) as with six to eight small-sized 2.25 cm cores.
Samples from each depth were combined for use as a composite sample. In the laboratory, field moist samples were passed through a 25 mm sieve, then air-dried and ground to pass through a 2 mm sieve. A subsample was analyzed for P, K, Ca and Mg, total organic carbon (SOC), total nitrogen (TN) and pH by the Iowa State University Soil and Plant Analysis Laboratory. Phosphorus, K, Ca and Mg were determined for samples from the top 15 cm of depth as recommended on standard soil testing protocols. For P determination, Bray-1 P solution extractant was usedReference Bray and Kurtz38. Exchangeable K, Ca and Mg were extracted with an ammonium acetate solution. Soil pH was measured in a solution with a 1∶1 soil to water ratio. SOC, TN and pH were determined for the 0–15 and 15–30 cm depths. SOC and N were evaluated by dry combustion analysis in a Costech ECS 4010 Elemental Combustion System.
Particulate organic matter C (POM-C), fluorescein diacetate (FDA) hydrolysis (a measure of soil heterotrophic activity), potentially mineralizable N (PMN) and hydrolysable amino N + NH4 (IL-N) were determined in samples from 0 to 15 and 15 to 30 cm depths in the University of Illinois Soil Ecology Laboratory. For POM fractionation, we modified the method described in Marriott and WanderReference Marriott and Wander7. Briefly, 10 g air-dried soil was weighed into a 30 ml Nalgene plastic bottle. To the sample, 30 ml 10% (w/v) sodium hexametaphosphate solution was added and allowed to sit overnight to facilitate dispersion. The mouth of the 30 ml bottle was then covered with a 53-μm-mesh fabric and placed into a 250 ml Nalgene centrifuge bottle to which an additional 120 ml sodium hexametaphosphate solution was added. Samples were then shaken in a reciprocal shaker to allow separation of the mineral fraction from POM. After 1 h, the fine particles and sodium hexametaphosphate were discarded, and 150 ml tap water was added. Samples were shaken for 10 min to rinse the excess sodium hexametaphosphate and fine particles smaller than 53 μm. This rinsing procedure was repeated five times. The sample remaining in the 53 μm mesh fabric was considered POM. Using tap water, the POM was transferred to another piece of 53-μm-mesh fabric and oven dried at 50 °C for 24 h. Dried samples were ground in a disk mill and analyzed for their C and N content (dry combustion analysis in a Costech ECS 4010 Elemental Combustion System).
Microbial enzymatic activity was evaluated with a modified version of the FDA hydrolysis method described by Schnurer and RosswallReference Schnurer and Rosswall39 as improved by othersReference Adam and Duncan40, Reference Green, Stott and Diack41 and optimized in our laboratory to achieve maximum color development for our soils. Briefly, 1 g air-dried soil (ground <2 mm) was placed in a 50 ml Nalgene centrifuge tube. Twenty milliliters of sodium phosphate buffer (60 mmol l−1, pH 7.6) were added, followed by 0.50 ml FDA stock solution (4.8 mmol l−1). Bottles were tightly capped and shaken in an orbital shaker for 5 h at 200 rpm and 20 °C. Then, 20 ml acetone was added and swirled to stop the reaction before the solution was vacuum-filtered through Whatman No. 4 filter paper. Controls were prepared for each soil type in the experiment following the same procedure as for FDA hydrolysis except that 0.50 ml acetone was added instead of 0.50 ml FDA stock solution. Blanks containing only the solutions were used to adjust the absorption curve for color development not associated with the soil samples. The concentration of FDA was estimated based on spectrophotometric readings of absorbance at 650 nm.
PMN was determined by anaerobic incubation with the method described by Drinkwater et al.Reference Drinkwater, Cambardella, Reeder, Rice, Doran and Jones42 with small modifications. Two sets of 5 g samples of air-dried soil (ground <2 mm) were placed in 50 ml centrifuge tubes. Fifty milliliters 2 mol l−1 KCl were added to the first set to quantify the amount of NH4+ originally present in the soil. Samples were shaken for 1 h on a reciprocal shaker and vacuum-filtered through Whatman No. 42 filter paper. To the second set, 10 ml deionized water were added and incubated for 7 days at 40 °C. After 1 week, samples were mixed with 40 ml 2.5 mol l−1 KCl solution, shaken, and the solution filtered in the same manner as the first set of samples. Ammonium concentrations in both sets were colorimetrically determinedReference Rhine, Sims, Mulvaney and Pratt43.
Hydrolysable amino N + NH4 was estimated using the Illinois-N (IL-N) procedure described by Khan et al.Reference Khan, Mulvaney and Hoeft44. Air-dried soils (ground <2 mm) were treated with 2 mol l−1 NaOH in a tight glass jar and heated to 48 to 50 °C for a 5-h period to liberate NH4+ and amino sugar-N as NH3. Ammonia was collected in a 4% H3BO3 solution and its concentration was determined by semi-automated titration with 0.01 mol l−1 H2SO4 solution.
Statistical analysis and interpretation
Results from this experiment were analyzed in a split-split plot arrangement with farming systems as the main plot and the organic amendment and time in transition as the split plots using the PROC MIXED procedure45. A split–split–split plot design was used to evaluate the effect of depth (0–15 and 15–30 cm). The influence of soil variability was captured using four blocks that were treated as random effects. Variables that did not meet the assumptions of normality and homogeneity of variances were transformed prior to analysis. Potassium, Ca, Mg, pH, SOC, POM-N and POM C:N were log-transformed whereas TN, POM-C, FDA and PMN were square-root transformed. Two- and three-way interaction terms with P values >0.25 were dropped from the model and were not reported. Significant mean effects were separated with a least-squared means post hoc test adjusted with the Tukey adjustment to control type I error (α = 0.1). Means of transformed variables were back-transformed for presentation. A CV was generated for each variable based on field replicates among experimental units. To evaluate the power of the analysis, we evaluated the minimum detectable difference as proposed by Yang et al.Reference Yang, Drury, Wander and Kay46 and StroupReference Stroup47.
Indicators of biologically based fertility (SOC, TN, C:N ratio, POM-C, POM-N, POM C:N ratio, FDA, PMN and IL-N) were evaluated for their suitability for routine soil testing. We considered the time required for processing, costs for required laboratory equipment and the environmental/health risks associated with analyses. Evironmental/health risk assessment was based on the toxicity specifications for handling and disposal of chemical suppliesReference Lide48.
To support indicator interpretation we adapted existing scoring functions for pH, available P, SOC and PMN from Andrews et al.Reference Andrews, Karlen and Cambardella29 which are described by the following equations:
For pH:
 $$y = \displaystyle{{a \times \exp [ - (\,pH - b)^2} \over {2 \times c^2}} $$
where a = 1.0 and  $b,c = \int {{\rm (crop)}} $
For available P:
If P ⩽ max (for crop and method)⇒
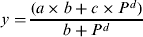 $$y = \displaystyle{{(a \times b + c \times P^{\hskip0.8pt d} )} \over {b + P^{\hskip0.8pt d}}} $$
If P > max (for slope and method)⇒
 $$y = a - b\exp ( - c \times P^{\hskip0.8pt d} )$$
Else y = 1, where a = 9.26 = 106; c = 1.0; d = 3.06 and  $b = \int {{\rm (crop, SOC, texture, method)}} $
For SOC:
 $$y = \displaystyle{a \over {1 + b \times \exp ( - c \times {\rm SOC})}}$$
where y is the indicator score,  $a = 1;b = 50.1$ and
 $c = \int {{\rm (iOM, texture, climate)}} $
For PMN:
 $$y = \displaystyle{a \over {1 + b \times \exp ( - c \times {\rm PMN})}}$$
where a = 1; b = 50.1 and  $c = \int {{\rm (iOM, texture, climate)}} $
We set agronomic thresholds using recommendations for horticultural and agronomic crops grown within our regionReference Egel, Weinzierl, Taber, Bauernfeind, Hutchison and Gu49. Environmental thresholds were based on the scoring functions suggested by Andrews et al.Reference Andrews, Karlen and Cambardella29, where the indicator concentration was transformed to a unitless scale from 0 to 1. A value closer to zero indicates that the system is functioning at lowest capacity, whereas values closer to one approach the system's maximum capacity. In addition, we compiled reports from the scientific literature for soils managed using organic and, when necessary, conventional cropping practices. Our literature survey was limited to studies conducted on silt and clay loam soils in regions with temperate climates.
Results and Discussion
Management effects on soil test values and indicators of biologically based fertility
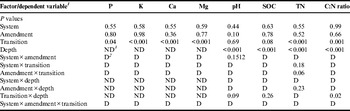
Our prediction that soil quality would be most improved where disturbance was low and organic additions were high was not met. Furthermore, no significant differences were detected among systems, but significant increases were detected in the concentrations of all nutrients and labile organic matter fractions after the 3-year transition (Tables 2 and 3). Even though the vegetable-based system was tilled 6 times more frequently than the ley-based system and 1.5 times more frequently than the row crop system, there was no evidence of significant difference in soil quality among systems. This may have been due to the lack of power in our statistical design to detect significance. Cumulative compost and manure additions (which on average contained 545, 448 and 364 kg of N, P and K ha−1 , and 476, 163 and 289 kg N, P and K ha−1, respectively) did not significantly increase soil reserves over those found in the untreated plots, which relied on N derived from N fixation and on P and K recycling from residues or captured/remobilized by roots. Based on estimates of nutrients removed in harvested crops, which were ranked row-crop > vegetable > ley, reductions in K (and to a lesser extent P) concentrations in unfertilized plots had been expected. Instead, the average concentrations of available P, K, Ca and Mg in baseline (pre-transition) samples were 51, 162, 2186 and 233 mg kg−1 soil, respectively. After transition, nutrient concentrations in the 0–15 cm depth had increased to 62, 247, 3041 and 311 mg kg−1 soil, respectively. Soil pH (0–15 cm) did not change significantly during transition but trended upward even though no lime was applied (Tables 2 and 3). All test values excluding pH, were in the ‘very high’ soil test range on both sampling datesReference Hoeft, Peck and Picklesimer50. Concentrations were similar to those reported by Delate and CambardellaReference Delate and Cambardella51 in a four-year-old organic row crop system that was also conducted on an inherently productive prairie soil. Their work, and that of Clark et al.Reference Clark, Howarth, Shennan and Scow52, which was conducted on vegetable-based systems, reported increased nutrient contents in soils after organic transition in systems amended with compost or manure and reductions when amendments were not applied. Declining test values have also been reported in several European studies when systems did not include application of manure or compostReference Mäder, Flieβbach, Dubois, Gunst, Fried and Niggli5, Reference Gosling and Shepherd34, Reference Oehl, Oberson, Tagmann, Besson, Dubois, Mäder, Roth and Frossard53. Smukler et al.Reference Smukler, Jackson, Murphree, Yokota, Koike and Smith54 reported slight reductions in P and K test values during a 3-year transition period in systems amended annually with compost and manure. That study considered a more intensive rotation that allowed for at least two crop harvests per growing season. We attribute our results to intensive nutrient recycling and active rooting by cover crops that increased nutrient availability and recovered nutrients from the subsoil to enrich the surface. This kind of increase in availability in the rhizosphere or where organic amendments are applied has been widely observedReference Richardson, Barea, McNeill and Prigent-Combaret55, Reference Krey, Caus, Baum, Ruppel and Eichler-Lobermann56. Root-based nutrient concentration has been observed by others, including Thorup-Kristensen et al.Reference Thorup-Kristensen, Magid and Jensen57, Reference Thorup-Kristensen, Cortasa and Loges58 who found that by adding cover crops to a wheat system they were able to capture and recover enough nutrients to offset losses from crop removal. Several reports of root-based concentration of nutrients within the soil surface appear in studies conducted on inherently fertile soilsReference Kone, Tondoh, Angui, Bernhard-Reversat, Loranger-Merciris, Brunet and Bredoumi59, Reference Crews60.
The influence of management system, organic amendment, depth of sampling and time under transition on soil attributes used for soil testing and soil organic matter. In the table are P values for main effects and interaction terms in an analysis of variance (ANOVA).

1 P, = available P; K, exchangeable K; Ca, calcium; Mg, Magnesium; SOC, total organic C and TN, total N.
2 Interaction terms with P value >0.25 were dropped (D) from the model.
3 P, K, Ca and Mg were only determined in the 0–15 cm depth.
Changes in standard test values of available P, exchangeable K, Ca, Mg and pH during the three-year transition period toward organic certification. Values represent means across all systems and amendment types (n = 4). Samples were collected at the Windsor Organic Research Trial in the spring of 2003 and 2006.

1 Samples were analyzed at the 0–15 cm depth for P, K, Ca and Mg. In the case of pH it was quantified at the 0–15 and 15–30 cm of depth.
2 Means followed by different letters in the same row are significantly different at α = 0.1.
3 Time by depth (transition × depth) interaction was not significantly different at α = 0.1.
4 Coefficient of variation for the concentration of hydrogen ions [H+].
Although SOC increased slightly over time (P < 0.1), increases were not significantly different when the interaction effects with system, amendment regime or depth were taken into consideration (Table 2). Despite the lack of statistical significance, the overall increase (see Table 5) is consistent with other works showing gains in organic matter under organic managementReference Marriott and Wander7, Reference Delate and Cambardella51, Reference Clark, Howarth, Shennan and Scow52, Reference Smukler, Jackson, Murphree, Yokota, Koike and Smith54, Reference Wander, Traina, Stinner and Peters61. Increased concentration in TN was most pronounced in the deeper soil depth and contributed to a reduced post-transition soil C:N ratio (Tables 2 and 5). This change in soil C:N ratio suggests N addition to the subsurface, rather than solely organic matter decay, and may reflect inputs from leguminous species with more readily decomposable substratesReference Marriott and Wander7.
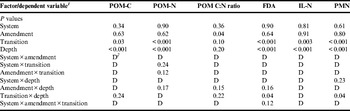
The influence of management system, organic amendment, depth of sampling, and time under transition on attributes of labile soil organic matter. In the table are P values for main effects and interaction terms in an analysis of variance (ANOVA).

1 POM-C, particulate organic matter C; POM-N, particulate organic matter N; FDA, fluorescein diacetate hydrolysis; IL-N, Illinois N test and PMN, potentially mineralizable N.
2 Interaction terms with P value >0.25 were dropped (D) from the model.
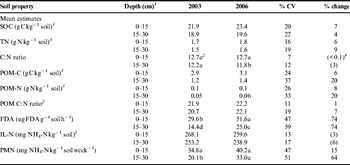
Changes in SOC, TN, C:N ratio and measures of biologically based fertility (POM-C, POM-N, POMC:N ratio, FDA, IL-N and PMN) as affected by time of organic management and sampling depth (n = 4). Samples were collected at the Windsor Organic Research Trial at two sampling depths.

1 Samples were collected at the 0–15 and 15–30 cm of soil profile.
2 Means followed by different lower case letters within the same variable are significantly different at α = 0.1.
3 Time × depth (transition × depth) interaction was not significantly different at α = 0.1
4 Numbers in parentheses mean a negative change over time.
The similarity among soils transitioned under different organic production systems was surprising given that the more dynamic properties are known to be quite responsive to manure and compost additions. The statistical separation between pre- and post-transition soils was greater for labile soil organic matter fractions than for total SOC (Tables 4 and 5). This illustrates why these assays are used as indicators of change and is consistent with other works showing that statistically significant differences will emerge more rapidly within labile soil organic matter fractions than in whole soil C or N stocksReference Wander, Magdoff and Weil3, Reference Haynes62, Reference Koutika, Hauser and Henrot63. Sensitivity of indicators will be discussed later. The magnitude of increase in POM concentrations observed was comparable to those seen in other US organic systemsReference Marriott and Wander7. In a comparison of organic and conventional systems, Marriot and WanderReference Marriott and Wander7 found that POM-C contents were similar in manure- and legume-based systems and low in conventional systems. We found POM C:N ratios varied only slightly after transition (P = 0.1), and were similar in the compost amended and cover cropped plots (22) but greater than POM C:N ratios observed in plots amended with manure (20). In general, POM C:N ratios exceeding 20 reflect inputs from carbonaceous plant residues and indicate use of soil-building practices; ratios approaching 15 are commonly associated with an abundance of decayed organic matter but can briefly occur after incorporation of fresh legume-derived residuesReference Wander, Magdoff and Weil3, Reference Koutika, Hauser and Henrot63. To evaluate the relationship between management practices and POM one must consider both the quantity and quality of the fraction.
Increases in FDA hydrolysis rates and PMN concentrations paralleled those of POM and were positively related. The increase in FDA activity after transition (74%) was more pronounced than for POM or PMN (13 and 40%, respectively) (Table 5). Drinkwater et al.Reference Drinkwater, Letourneau, Workneh, van Bruggen and Shennan4 also found FDA to be positively related to measures of available N and argued that this showed how organic practices increase N supply by promoting microbial activity. Unlike PMN, the IL-N, which is a biochemically based method used to estimate mineralizable N, declined during transition. In their multi-site study of organic systems, Marriott and WanderReference Marriott and Wander7 found that the IL-N was not as sensitive to different organic management practices as POM-N and was more closely related to clay content than these other estimates of mineralizable N. That result agrees with the findings of Spargo et al.Reference Spargo, Alley, Thomason and Nagle64 who found that the IL-N was closely related to TN. In this work, IL-N declined with time, whereas TN increased, suggesting that the proportion of N in the hydrolysable fraction was reduced during transition but converted to another, possibly more resistant form. According to Kwon et al.Reference Kwon, Hudson and Mulvaney65, the IL-N test detects N in only some components of the microbial biomass. They showed that the IL-N recovered 95% of monomeric amino sugars contained in bacterial cell walls and 55% of amides abundant in fungi and concluded that the assay did not recover alpha amino acids or chitin. Further, they showed that the IL-N test was more sensitive to changes in bacterial amino sugars than to fungal amides and noted that this would complicate interpretation in systems that promote fungal biomass. This might suggest that the proportion of N in amides increased with transition and provided indirect evidence of an increased importance of fungal biomass in these post-transition soils.
Significant depth-by-date interactions revealed important changes in soil quality (Tables 4 and 5). As expected, all variables were more concentrated in the surface than subsurface depths; however, the degree of stratification for most indicators of biologically based fertility (SOC, POM-C, POM-N and PMN) decreased during transition (Table 5). Stratification by depth was less pronounced for pH than for other variables (Table 3). The depth distribution of soil organic matter in the ley system was similar to that found in the tilled row crop- and vegetable-based systems even though it was not tilled after seeding; that occurred within a month of our baseline sample collection. Other works have shown that use of perennial mixtures or cover crops and manure increase the depth of soil organic matter enrichmentReference Teasdale, Coffman and Mangum66, Reference Wander, Yun, Goldstein, Aref and Khan67. We attribute study-wide reductions in soil organic matter stratification to active C additions principally associated with diversification of the crop rotation. According to Kong and SixReference Kong and Six68, it is likely that the presence of active roots in the systems is more important for soil organic matter accumulation than the incorporation of above-ground residue and/or organic amendments. These results suggest organic farmers should sample more deeply than the current norm (0–15 cm), at least in Mollisols in Illinois, to allow them to better manage the active rooting zone.
Sensitivity of soil organic matter attributes to changes in soil resource condition
The relative utility of the indicators of biologically based fertility depends on each measure's responsiveness to management, inherent variability, costs and environmental risks associated with each method. We assessed indicator sensitivity by considering the relative change in soil organic matter fractions with respect to baseline samples (control samples collected before any organic management was established). Soil FDA, PMN, POM-N and POM-C contents were the variables with the greatest percent change observed during transition (Table 5). The consistency of each soil organic matter fraction was assessed using its variability and represented by the coefficient of variation (CV, %). Coefficients of variation for FDA, PMN and POM fractions observed in both depths ranked FDA > PMN > POM-C and POM-N. The lowest CVs were found for SOC, TN, IL-N and the POM and soil C:N ratios (SOC > TN > IL-N > POM C:N ratio > soil C:N ratio). Even though FDA, and hence heterotrophic activity, was quite responsive to management, this parameter was also highly variable and this decreased the power of the test to around 20% for the farming system by transition interaction. Based on FDA's variability we would have needed to collect ten composite samples per management system in order to detect treatment differences with a 90% confidence level. Clearly, this is impractical given the limited amount of resources devoted to establishment of replicated field experiments, sampling and testing. The POM fraction and SOC were less variable than FDA and so would have required about six and eight replicate samples to be taken per treatment to document differences at the 90% confidence level. The variability of soil organic matter fractions in both depths was similar to that observed for chemical test variables in the 0–15 cm depth. This suggests that testing regimes that incorporated indicators of biologically based fertility would not need to modify sampling intensity even if they were altered to increase sampling depth. Further work is needed to explore indicator variability in other soils and organic cropping systems.
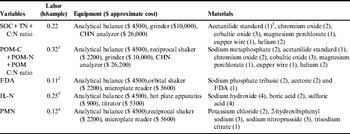
The potential for commercial use of biologically based indicators was assessed using the costs associated with labor and equipment and the health-risk-hazard of chemical use. All measurements considered in this study were affordable (<0.5 h of labor per sample) and so deemed suitable for use in commercial soil testing laboratories. Determination of indicators like FDA, IL-N and PMN does not require specialized equipment. Labor requirement was 0.1–0.3 h per sample (Table 6) assuming that sets of multiple samples could be processed simultaneously. Soil FDA hydrolysis rate was the least—and POM was the most—labor-intensive methods described here. We note that methodological improvements could reduce time required to recover the POM fraction. These labor requirements are similar to those needed for determination of conventional chemical soil tests (G. Steffen, Illinois Soil Testing Association, pers. comm., 2008). The chemical supplies used during processing would fall into the moderate health rating hazardReference Egel, Weinzierl, Taber, Bauernfeind, Hutchison and Gu49. Concentrations of those compounds that rank under the high health risk hazard were used in very small quantities and very low concentrations; thus, safety would not be a concern with the use of normal laboratory precautions for protection and handling and with proper disposal.
Estimates of labor and cost of laboratory equipment needed to process soil samples for SOC, TN, C:N ratio, POM-C, POM-N, POM C:N ratio, FDA, IL-N and PMN.

1 Labor estimates assuming samples were processed in sets of 30 for POM fractionation and sets of 35 for CN analysis.
2 Labor estimates assuming samples were processed in sets of 80.
3 Labor estimates assuming samples were processed in sets of 33.
4 Labor estimates assuming samples were processed in sets of 50.
5 Numbers in parenthesis refer to the health risk hazard from the material safety data sheets for each compound. Being 1, slight; 2, moderate; 3, severe and 4, extreme.
Interpretation of soil testing values
To evaluate the influence of organic transition on soil quality at our site we used conventional testing and then sought to adapt interpretation guides developed for conventional agriculture and included appropriate scoring functions. Currently, there are no critical values or proposed methodologies of interpretation for most indicators of biologically based fertility with exceptions for SOCReference Andrews, Karlen and Cambardella29, PMNReference Andrews, Karlen and Cambardella29 and IL-NReference Khan, Mulvaney and Hoeft44.
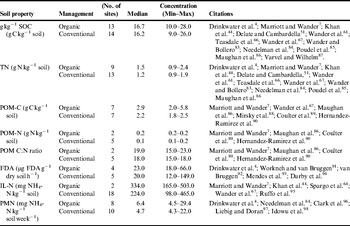
Table 7 includes a summary of the median, maximum, and minimum values for variables found in the relevant literature. These values describe the general range of concentrations one could expect to find in medium- to fine-textured soils under organic and conventional management practices. Data from organic systems represent a wider range of tillage and fertilization practices applied in cash grain and vegetable production systems; this probably accounts for the wider range of values found for SOC, TN, POM and PMN fractions. The small number of reports for FDA and IL-N in organic systems explains the relatively narrower range. In general, concentrations of indicators used in our study approached the upper limit for reported values. As previously noted, standard soil test values were also in the high-to-very-high range. This suggests that nutrients and probably energy reserves were abundant or in surplus at this site. Concentrations of PMN (40 mg NH4–N kg−1 soil week−1) were significantly higher than those reported in the literature and our mean IL-N was above the value (235 mg NH4–N kg−1) Khan et al.Reference Khan, Mulvaney and Hoeft44 found to be a critical limit beyond which corn would not respond to additional N fertilization. The IL-N critical limit should be relevant to other N-demanding crops such as tomato or broccoliReference Egel, Weinzierl, Taber, Bauernfeind, Hutchison and Gu49.
Reference values for indicators of soil organic matter found in the organic literature.

Figure 1 presents some of our data using the soil scoring curves proposed by Andrews et al.Reference Andrews, Karlen and Cambardella29. Both pre- and post-transition observations fell on the asymptote of the scoring functions for pH, available P and PMN and on the ascending portion of the SOC curve. Based on standard interpretations, the high scores suggest that these soils were functioning near their maximum capacity for productivity. It may be appropriate, however, to reduce the level of the plateau used in the functions when applied within organic systems or to apply an optimum-shaped function, which declines past some maximum because the presence of high levels of available nutrients could suppress plant–microbe associations contributing to tight nutrient cyclingReference Bodner, Himmelbauer, Loiskandl and Kaul69, Reference Morgan, Bending and White70. The shape of the P curve already takes environmental excess into account and reduces scores when threats to water quality emerge. It is not clear whether this is an appropriate model for available N, which in our study is in the high-to-very-high range for both PMN and IL-N compared to other published works. Organic matter stocks were low compared to the site's potential as a result of the history of cultivationReference Verbruggen, Roling, Gamper, Kowalchuk, Verhoef and van der Heijden71. Values on the ascending section of the SOC curve suggest that further increases in SOC would enhance soil function by enhancing soil physical properties and nutrient availability but further increases in the concentration of labile N, estimated by PMN or IL-N would not be desirable from an environmental perspective. There is not a simple linear relationship between C inputs and SOC accumulationReference Six, Conant, Paul and Paustian72, and soil N status can alter decay dynamicsReference Wander, Yun, Goldstein, Aref and Khan67, Reference Henriksen and Breland73. Ideally our soils could continue to accumulate organic C and with it, N in forms less prone to undergo nitrification and subsequent loss, but these forms would be difficult to separate and quantifyReference Frank and Groffman74. The small increase observed in the concentrations of POM-C, which was from 7.5 to 13% of SOC, could be due to positive priming of C caused by high levels of available NReference Kuzyakov, Friedel and Stahr75. Limitation of SOC accrual has been observed in systems where liberal or chronic applications of N are made in the form of manureReference Wander, Yun, Goldstein, Aref and Khan67, Reference Angers, Chantigny, MacDonald, Rochette and Cote76 or inorganic fertilizers (e.g., Shen and BarthaReference Shen and Bartha77, Gerzabek et al.Reference Gerzabek, Pichlmayer, Kirchmann and Haberhauer78, Bol et al.Reference Bol, Ostle, Friedrich, Amelung and Sanders79, Van Lauwe et al.Reference Van Lauwe, Dendooven and Merckx80 and Blagodatsky et al.Reference Blagodatsky, Yevdokimov, Larionova and Richter81 as reviewed by Kuzyakov et al.Reference Kuzyakov, Friedel and Stahr75 and Khan et al.Reference Khan, Mulvaney, Ellsworth and Boast82). This is why we propose changing the plateau function to an optimal scoring function for PMN with reductions in scores occurring when levels exceed an optimum. To account for the microbial contribution to N availability, the scoring function should consider both C and N status. If we are correct in our theory that reductions in IL-N accompanied by increases in PMN signal a shift in microbial N explained by increased fungal importance, then we have moved left along the curve toward a more optimal condition. This ability to decline or maintain available N even while total N increases might indicate greater potential for the IL-N or other amino-sugar-based assays to be used as indicators. It is doubtful that PMN would fall unless SOC and TN levels fell too.
Scoring functions illustrating the change in scores affected by organic transition. Dotted lines represent the expected values for soils classified as Catlin silt loam and Drummer silty clay loam in Champaign, IL using the algorithms presented in Andrews et al.Reference Andrews, Karlen and Cambardella29. Symbols within the curve represent the mean average scores for each indicator computed in our study on soils collected pre- and post-transition. Black circles are the means for samples collected in 2003 before organic transition started; gray diamonds are the means for samples collected in 2006 after organic transition ended. Indicators were: pH, available P, SOC and PMN at the Windsor Organic Research Trial. Scores for PMN and SOC assume a more-is-better relationship, with no reduction for environmental concerns after they reach a plateau. Soil pH is an optimum function that depends on the crop in place.

Conclusions
In general, organic management increased standard and biological soil test values observed in soils under organic perennial ley-, row crop- and vegetable-based production. Regardless of management intensity, organic practices improved/maintained soil resource condition in the plow layer. Increases in resource abundance in the 15–30 cm depth were notable and suggest that deeper sampling might be needed to better track changes in the soil resource caused by organic practices.
Data were used to demonstrate how indicators of biologically based fertility could have practical and therefore commercial application, and outline a strategy to use scoring functions to create an interpretive framework for assessment of performance in organic cropping systems. By revising established norms and values published in the literature, we concluded that soil nutrient stocks were at or beyond optimum agronomic levels and may be too high from an environmental perspective. Intermediate scores for SOC and modest rates of SOC and POM-C accrual suggest that reductions in labile N may be needed. The results suggest that scoring functions for biologically based indicators of soil quality should be optimum functions and seek to account for feedbacks influencing biotic interactions.
Acknowledgements
Many thanks to Dr Edmond Zaborski and the members of the Windsor Organic Research Team for developing and maintaining the experimental site, and to Dr Susanne Aref for statistical advice. This work was supported by the Cooperative State Research, Education, and Extension Service (CSREES) Program under award no. ORG 2003-51106-02086.