Introduction
Water scarcity is one of the major constraints of plant growth, productivity and adaptation in arid and semi-arid regions in the world. The lack of water resource and irregularity of precipitation had significantly impacted the sustainability of the crops production. In regions with scarce freshwater resources and increasing food demand for ever-growing populations, water management along with production of climate-proof crops become key factors for a sustainable agriculture (World Water Assessment Programme (WWAP) Reference WWAP2012). The cultivation of drought- and salt-tolerant crops such as quinoa has the potential to enhance farm-level productivity and livelihoods in drought- and salt-prone areas (Yazar and İncekaya, Reference Yazar and İnce Kaya2014).
Quinoa (Chenopodium quinoa Willd.) is a genetically diverse Andean crop that has earned special attention worldwide due to its nutritional and health benefits and its ability to adapt to contrasting environments, including nutrient-poor and saline soils and drought stressed marginal agro-ecosystems (Bazile et al., Reference Bazile, Jacobsen and Verniau2016; Murphy et al., Reference Murphy, Bazile, Kellogg and Rahmanian2016; Jacobsen, Reference Jacobsen2017; Maliro et al., Reference Maliro, Guwela, Nyaika and Murphy2017; Hinojosa et al., Reference Hinojosa, González, Barrios-Masias, Fuentes and Murphy2018). In view of its exceptional nutritional quality and ability to grow under marginal environments, the Food and Agriculture Organization of the United Nations has identified quinoa as one of the crops that will play an important role in ensuring future food security and designated the year 2013 as the ‘Year of Quinoa’ (Bazile et al., Reference Bazile, Bertero and Nieto2015; Choukr-Allah et al., Reference Choukr-Allah, Rao, Hirich, Shahid, Alshankiti, Toderich, Gill and Ur Rahman Butt2016). Quinoa is well adapted to grow under unfavorable soil and climatic conditions. Its robust character is due to a high tolerance level of frost, soil salinity and drought (Adolf et al., Reference Adolf, Jacobsen and Shabala2013; Ruiz et al., Reference Ruiz, Biondi, Oses, Acuña-Rodríguez, Antognoni and Martinez-Mosqueira2014, Reference Ruiz, Biondi, Martínez, Orsini, Antognoni and Jacobsen2016; Hinojosa et al., Reference Hinojosa, González, Barrios-Masias, Fuentes and Murphy2018). The quinoa production could contribute to food security, and has a great potential to increase food security in the Mediterranean region and in other parts of the developing world (Hirich et al., Reference Hirich, Choukr-Allah, Jacobsen and Benlhabib2012, Reference Hirich, Choukr-Allah and Jacobsen2013; Jacobsen et al., Reference Jacobsen, Jensen and Lui2012; Hinojosa et al., Reference Hinojosa, Kumar, Gill and Murphy2019).
Deficit irrigation (DI) is the most important irrigation strategy to increase water use efficiency and crop water productivity (WP) (Hirich et al., Reference Hirich, Jelloul, Choukr-Allah and Jacobsen2014). Water management by proper scheduling of irrigation with improved crop water management techniques is a potential option to save water and increase WP. Therefore, the efficient utilization of limited available fresh water resources in irrigated agriculture necessitates the use pressurized irrigation systems such as surface and subsurface drip (SSD) systems for increasing yield and quality (Bozkurt Çolak et al., Reference Bozkurt Çolak, Yazar, Gönen and Eroğlu2018). SSD has proven to be an efficient irrigation method with potential advantages of high WP, fewer weed and disease problems, less soil erosion, efficient fertilizer application, maintenance of dry areas for tractor movement at any time, flexibility in design and lower labour costs than in a conventional drip irrigation system (Lamm and Camp, Reference Lamm, Camp, Lamm, Ayars and Nakayama2007; Irmak et al., Reference Irmak, Djaman and Rudnick2016).
Innovations for saving water in irrigated agriculture and thereby improving WP are of paramount importance in water-scarce regions. The increasing global shortage of water resources and high costs of irrigation have resulted in development of precise water-saving irrigation strategies that lead to minimize water use in crop production (Jones, Reference Jones2004). Water-saving irrigation strategies reduce crop water consumptions and among these strategies are DI, partial root-zone drying (PRD) irrigation and regulated deficit irrigation (RDI) that have been developed for limited irrigation managements. Conventional DI is a well-accepted practice to optimize water use, thereby saving cost, by allowing crops to withstand mild water stress with no or only marginal decreases in yield and quality (English et al., Reference English, Musick, Murty, Howell, Solomon and Hoffman1990). PRD is a further development of DI. PRD is an irrigation technique based on alternately wetting and drying opposite parts of the plant root system (Marsal et al., Reference Marsal, Mata, Arbones, Del Campo, Girona and Lopez2008). Recently, RDI has been identified as one of the key water-saving technologies in agriculture. RDI is generally defined as an irrigation practice whereby a crop is irrigated with an amount of water below the full requirement for optimal plant growth in non-critical growth stages without causing significant yield reduction (Chai et al., Reference Chai, Gan, Zhao, Xu, Waskom, Niu and Siddique2016). DI is a well-accepted practice to optimize increase water use, thereby saving cost, by allowing crops to withstand mild water stress with no or only marginal decreases in yield and quality. Quinoa has responded well to DI that was highly beneficial in various experimental locations where grain yield was hardly affected by DI (Costa et al., Reference Costa, Ortuño and Chaves2007; Geerts and Raes, Reference Geerts and Raes2009; Pulvento et al., Reference Pulvento, Riccardi, Lavini, Iafelice, Marconi and d'Andria2012; Razzaghi et al., Reference Razzaghi, Plauborg, Jacobsen, Jensen and Andersen2012; Yazar et al., Reference Yazar, İnce Kaya, Sezen and Jacobsen2015). RDI is generally defined as an irrigation practice whereby a crop is irrigated with an amount of water below the full requirement for optimum plant growth; this is to reduce the amount of water used for irrigating crops, improve the response of plants to the certain degree of water deficit in a positive manner, and reduce irrigation amounts or increase the crop's water use efficiency (WUE). The principle behind this approach is that the response of plants to RDI induced water stress varies with growth stages and that less irrigation applied to plants at non-critical stages may not cause significant negative impact on plant productivity even though it may reduce normal plant growth (Chai et al., Reference Chai, Gan, Zhao, Xu, Waskom, Niu and Siddique2016). Quinoa's flowering and milk grain stages have been established as the most drought sensitive (Geertz et al., Reference Geerts, Raes, Garcia, Vacher, Mamani, Mendoza, Huanca, Morales, Miranda and Cusicanqui2008). Several studies have been conducted to understand the quinoa plant's physiology under drought stress (Jensen et al., Reference Jensen, Jacobsen, Andersen, Andersen, Mogensen, Núñez and Rasmussen2000; Jacobsen et al., Reference Jacobsen, Liu and Jensen2009; González et al., Reference González, Bruno, Valoy and Prado2011; Yang et al., Reference Yang, Akhtar, Amjad, Iqbal and Jacobsen2016).
A number of studies were carried out on the response of quinoa to drought and salinity in different geographic locations in the World: Garcia et al. (Reference Garcia, Raes and Jacobsen2003) and Geertz et al. (Reference Geerts, Raes, Garcia, Vacher, Mamani, Mendoza, Huanca, Morales, Miranda and Cusicanqui2008) in Bolivia; Martinez et al. (Reference Martinez, Veas, Jorquera, San Martin and Jara2009) in Chile; Razzaghi et al. (Reference Razzaghi, Plauborg, Jacobsen, Jensen and Andersen2012) in Denmark; Pulvento et al. (Reference Pulvento, Riccardi, Lavini, Iafelice, Marconi and d'Andria2012) and Lavini et al. (Reference Lavini, Pulvento, d'Andria, Riccardi, Choukr-Allah, Belhabib, Yazar, Ince Kaya, Sezen, Qadir and Jacobsen2014) in Italy; Yazar and İnce Kaya (Reference Yazar and İnce Kaya2014), Yazar et al. (Reference Yazar, İnce Kaya, Sezen and Jacobsen2015) in Turkey; Hirich et al. (Reference Hirich, Jelloul, Choukr-Allah and Jacobsen2014) in Morocco; Alvar-Beltran et al. (Reference Alvar-Beltran, Saturnin, Dao, Marta, Sanou and Orlandini2019) in Burkina-Faso. Quinoa has an exceptional capacity to grow in water-deficient soil due to its inherent low water requirement and the ability to resume its photosynthetic rate and maintain its leaf area after a period of drought (Jensen et al., Reference Jensen, Jacobsen, Andersen, Andersen, Mogensen, Núñez and Rasmussen2000; Jacobsen et al., Reference Jacobsen, Liu and Jensen2009).
Few studies concluded that full irrigation (FI) increases quinoa grain yield and biomass compared to DI (Fghire et al., Reference Fghire, Wahbi, Anaya, Issa Ali, Benlhabib and Ragab2015; Yazar et al., Reference Yazar, İnce Kaya, Sezen and Jacobsen2015; Walters et al., Reference Walters, Carpenter-Boggs, Desta, Yan, Matanguihan and Murphy2016). However, very little information is available about quinoa response to RDI, PRD and conventional DI applied with SSD irrigation system. Therefore, the primary objective of this study is to evaluate the yield and water use efficiency response of quinoa to RDI, PRD and conventional deficit and FI applied with surface drip (SD) and SSD systems under the Mediterranean climatic conditions.
Materials and methods
Experimental site and soil
This research was conducted in the experimental farm of Cukurova University in Adana, Turkey. The site has a latitude of 36o59′N, longitude of 35o18′E and is 50 m above mean sea level. The soil of the experimental site is classified as the Mutlu soil series (Palexerollic Chromoxeret; Jahn et al., Reference Jahn, Blume, Asio, Spaagaren and Schad2006), with clay texture throughout the soil profile, and has a pH range 7.61–7.87, electrical conductivity of the saturation extract (ECe) 0.32–0.35 dS/m, organic matter content of 1.23% and volumetric soil-water contents (SWCs) at field capacity and permanent wilting point of the root zone 37–41% and 24–26%, respectively. Mean bulk density varies from 1.14 to 1.30 g/cm3. Available water-holding capacity of the soil is 110 mm in the top 60 cm soil depth.
Irrigation treatments and experimental design
In this study two irrigation systems, namely SD and SSD systems; and five irrigation regimes (full irrigation, FI; deficit irrigation, DI50; deficit irrigation, DI75; partial root-zone drying, PRD50 and regulated deficit irrigation, RDI) and a rainfed treatment (RF) were considered. Experiment was designed in split plot with four replications. Irrigation systems (SD and SSD) are assigned to the main plots, irrigation strategies (FI, RDI, DI75, DI50, PRD50 and RF) are assigned to the sub-plots. FI in which soil-water deficit was replenished to field capacity when 50% of available water at effective root-zone depth of 60 cm was depleted. DI treatments (DI75 and DI50) received 75 and 50% of FI, respectively. PRD50 plots received 50% of FI, but from alternative laterals in each application. RDI received 50% of FI until flowering growth stage, and then received 100% of water requirement. Rainfed (RF), in which no irrigation was applied except during emergence and crop establishment period. Irrigation duration for FI treatment was estimated using average emitter flow rate and number of emitters and then duration for DI50 and DI75 was determined. Each subplot had a length of 10 and 3.0 m (six plant rows) in width.
Irrigation systems
In the SD irrigation plots, laterals of 16 mm in diameter with in-line emitters spaced 0.33 m apart, each delivering 2.0 l/h at an operating pressure of 100 kPa. One drip lateral was placed at the centre of adjacent crop rows 0.50 m apart in the experimental plots. In PRD50 plots, two drip laterals were placed on both sides of the crop row at 25 cm from the crop row. One lateral provided water during one irrigation, the other lateral supplied water in the next irrigation. A locally produced drip-irrigation system (Betaplast, Adana, Turkey) was used in the study.
SSD irrigation system laterals were buried under 25 cm of the soil surface by means of a chisel plow. In-line emitters with discharge rate of 2.0 l/h spaced at 0.33 m intervals on the lateral line were used in SSD treatment plots except in PRD50 (Geoflow Corte Madera, CA, USA). A totalizing flow meter was installed at the control unit to measure total flow distributed to all replications in each treatment. Water was supplied from an open-channel irrigation network in the vicinity experimental site with a pump. Electrical conductivity of water, sodium absorption ratio and pH was 0.67 dS/m, 0.82 and 7.1, respectively.
Agronomic practices
Quinoa (Chenopodium quinoa Willd cv. Titicaca) seeds were sown by hand 3–4 cm apart in the row and at 50 cm row spacing on 25 March 2016 and 21 March 2017. At planting, a composite fertilizer (N : P2O5 : K2O, 20 : 20 : 0) was broadcast at a rate of 75 kg/ha of each of N and P2O5, and incorporated into the soil. The additional of the N was applied in urea form at a rate of 25 kg/ha with fertigation at three consecutive irrigations on 12, 19 and 26 May 2016; and 1, 12, 23 May 2017 during vegetative growth stage using a bypass system. All treatment plots received a total of 150 kg/ha N.
Measurements and observations
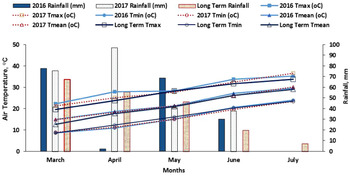
The experimental area is located in a semi-arid climate. Weather data were collected from an automatic recording meteorological station located about 60 m from the experimental site. Precipitation, maximum and minimum air temperatures, air humidity, wind speed and solar radiation measured on a daily basis, and summarized for each growing season along with long-term mean climatic data from 1950 to 2015 are shown in Fig. 1.
Colour online. Mean monthly weather data in the experimental years along with long-term historical means (1950–2015).

Plant and soil-water measurements were started after plant establishment, and terminated on the harvest date. Measurements of SWC were made from one day before irrigations until harvest in four replications for all treatments.
Soil moisture content were monitored in traditional (gravimetric) in 0–60 cm and innovative manners (TDR) in 0–40 cm. SWC sensors (SM-150, Delta T Devices, UK) were placed between the two plants in the crop row at 20 and 40 cm depth at one replication for each irrigation treatment with data loggers.
Seasonal crop water use or evapotranspiration (ET) was calculated with the water balance equation:

where ET is evapotranspiration (mm); P is the precipitation (mm); I is the amount of irrigation water applied (mm); Cp is the contribution through the capillary rise from ground water; ΔS is the change in the SWC (mm) at planting and at harvest in 60 cm soil depth; Dp is deep drainage and Roff is run off (mm). Since the amount of irrigation water was controlled Dp and Roff were assumed to be negligible. Water table depth was about 5 m below the soil surface Cp was also neglected.
WP and IWP were calculated using the following equations:


where WP is water productivity (kg/m−3) in terms of yield per unit of water used; GY is grain yield (kg/ha); IWP is irrigation water productivity (kg/m3) in terms of yield per unit of irrigation water applied; GYi is grain yield of irrigated treatment and GYd grain yield of RF (kg/ha); ET is evapotranspiration (mm); I is irrigation water applied (mm).
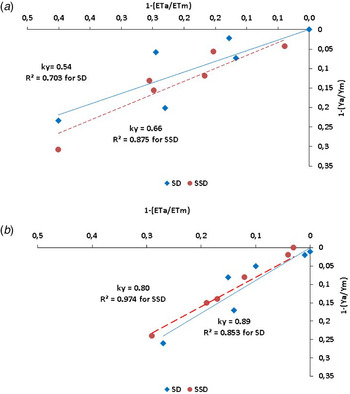
The water use–yield relationship was determined by Eqn (4) using the Stewart model in which dimensionless parameters in relative yield reduction and relative water ET are used (Doorenbos and Kassam, Reference Doorenbos and Kassam1979);

where Ya is the actual yield (kg/ha), Ym the maximum yield (kg/ha), Ya/Ym the relative yield, 1 − (Ya/Ym) the decrease in relative yield, ky yield response factor, ETa the actual crop evapotranspiration (mm), ETm the maximum crop evapotranspiration (mm), ETa/ETm the relative evapotranspiration, 1 − (ETa/ETm) the decrease in relative evapotranspiration.
In order to determine dry matter (DM) yield, all plants within a 0.5 m row section in each plot were cut at ground level at 14-day intervals until harvest. Plant samples were dried at 65°C until constant weight was achieved. Harvest index (HI) was calculated as the ratio of grain yield to above ground biomass yield. Leaf area was measured with an optical leaf area meter at 2-week intervals throughout the growing season (LI-2000 Canopy Analyzer; LICOR Biosciences, Lincoln, NE, USA).
Phenological stages were monitored during the crop cycle in the field using the indications of Jacobsen and Stolen (Reference Jacobsen and Stolen1993) for quinoa. Yield was determined by hand harvesting all the plants in the 8 m long sections of the four center rows in each plot to avoid border effects. The harvest was carried out on 14 July 2016 and 12 July 2017 in the experimental years. The panicles, separated from the rest of the plant, were dried in the sun, and then, the cleaned seeds were removed. The 1000 grain weights were determined on ten plants per plot.
Statistical analysis
Analysis of variance was performed to evaluate the statistical effect of irrigation treatments on yield and yield components, WP and ET using the JMP Statistical software developed by SAS (SAS Institute, Inc., Cary, NC, USA). Treatment means were compared using Least standard deviation (LSD) test (Steel and Torrie, Reference Steel and Torrie1980).
Results
Irrigation and ET
The climatic conditions during the experimental years indicated that mean temperatures were similar to long-term means as depicted in Fig. 1. Monthly rainfalls fluctuated during and between the growing seasons. In general, the 2017 growing season was relatively wet during April (97.2 mm) compared to previous year (2.2 mm), which was the drier experimental year. Rainfall was more evenly distributed in 2017 than in 2016. In 2016, less rainfall was received (98.5 mm) compared with 2017 (182 mm), in which rainfall recived in May–June period was greater than the long-term means. The length of growing periods of quinoa was 111 days in 2016 and 113 days in 2017 growing season.
Irrigation quantity and ET values for the different irrigation treatments and two irrigation methods for the experimental years are summarized in Table 1. In 2016 growing season, the amount of irrigation applied to SD irrigation plots varied from 99 mm in DI50 and PRD50 to 149 mm in FI treatment; the corresponding values for SSD plots varied from 95 to 140 mm. SD plots received slightly more water but the difference was not significant. The RDI and DI75 plots in SD plots received 114 and 125 mm, respectively; in SSD plots, RDI and DI75 treatments received 110 and 118 mm, respectively, in 2016. In the 2017 growing season, the amount of irrigation water in SD plots varied from 51.5 mm in DI50 and PRD50 to 103 mm in FI treatment; the corresponding values for the SSD plots 46–92 mm. RDI plots received the same amount of water with FI in the second year due to rainy season until flowering. In general, less amount of irrigation water was applied to all treatments in 2017 than in 2016 growing season due to greater quantity of rainfall received in the second year.
Quinoa irrigation, actual crop evpotranspiration (ET), grain yield, water productivity (WP), irrigation water productivity (IWP), 1000 grain weight, dry matter yield and harvest index (HI) values under different treatments in the experimental years

Values followed by different small letters (a, b and c) indicate significant differences at P < 0.05; **LSD grouping at 1% level.
Crop ET values ranged from 169 mm in RF to 282 mm in FI in SD, and varied between 169 mm in RF and 271 mm in FI in SSD plots in 2016 growing season. ET values varied from 254 mm in RF to 350 mm in FI in SD plots; and 254 and 339 mm in SSD plots in 2017. Quinoa under SD plots used slightly more water than SSD plots for the same treatments due to reduced surface evaporation from the SSD plots. In the first experimental year, ET values in DI75 and RDI treatments in SD system were 246 and 217 mm, respectively. The corresponding values for the SSD were 235 and 212 mm, respectively. In the 2017 growing season, ET values were generally greater than those in 2016 due to greater amounts and favorable distribution of rainfall during the second season.
Variation of SWC
SWC at 20 cm soil depth in FI and RDI treatment remained between 35 and 40% until 22 June 2016 then as the season advanced SWC slightly decreased and remained between 32–35% during rest of the growing season. Thus, these two treatments did not cause any water stress throughout the quinoa growing season. SWC in the DI75 treatment also is maintained relatively high as compared to DI50, PRD50 and RF treatments, in which SWC variation were the greatest among the treatments, and water stress gradually build up towards the end of growing season. SWC in RF treatment reached wilting point towards the end of growing season. Similar trends were observed for the SWC variation at 40 cm soil depth for the treatments considered. Again SWC values in FI, RDI and DI75 treatments remained relatively higher as compared to DI50, PRD50 and RF. SWC in the 40 cm soil depth was greater than SWC values in the 20 cm depth in the corresponding treatments. It can be concluded that quinoa consumed most water from the top 40 cm soil depth under different treatments.
Variation SWC at 20 and 40 cm depths under the different treatments under the SSD had similar trend to those under the SD system in 2016. However, SWC in 20 cm depth under SSD was greater than those under the SD system, especially early in the season the difference was larger. This difference can be attributed to elimination of surface evaporation losses that occur under SD irrigation. Thus, more water was remained at 20 cm soil depth under SSD, and SWC decreased in all treatments as the season progressed. SWC towards the end of growing season reached below the wilting point in DI50, PRD50 and RF treatments. SWC at 40 cm soil depth in different treatments under the SSD irrigation posed a similar trend those in SD irrigated treatments. SWC decreased in all treatments gradually as the season progressed, and reached their lowest values at the end of growing season.
Fluctuations in SWC in experimental treatments under the SD and SSD systems followed similar trends in the second experimental year. FI and RDI treatments received the same amount of water in 2017 due to sufficient rainfall during the vegetative growth stage. These two treatments maintained higher SWC values than all other treatments considered. The SWC values in the 20 and 40 cm soil depths remained slightly greater in 2017 than those in 2016. In DI50 and PRD50 treatments, SWC had slightly different SWC profiles throughout the growing season. In FI and RDI treatments, SWC values remained above 32% in most of the growing season except towards the late grain filling stage during which SWC values decreased considerably. In DI75, SWC curves took place below the FI and RDI throughout the growing season but SWC values in this treatment remained greater than PRD50 and DI50. More information regarding SWC variations in the different treatments in the experimental years have been given in previous publication by Bozkurt Çolak et al. (Reference Bozkurt Çolak, Yazar, Alghory and Tekin2020).
Grain yield
Grain yield values for the different irrigation treatments and two irrigation methods in the experimental years are summarized in Table 1. Statistical analysis results are given in Table 2. There was no significant difference in grain yields between the two drip irrigation systems in the experimental years. However, irrigation treatments resulted in significantly different yields (P < 0.01) as shown in Table 3. Since there was no significant difference between the two drip systems regarding the grain yield values, statistical comparisons of the mean grain yields were made on yields averaged over the two drip systems. Quinoa grain yield values in the first year were greater than those in the second year due to more favorable weather conditions prevailed in the first year. In 2016 growing season, FI, DI75, and RDI treatments resulted in similar yields and significantly greater yields than DI50 and RF. Although PRD50 and DI50 treatments received the same amount of irrigation water, PRD50 resulted in higher yields than DI50. In the 2017 growing season, FI and RDI treatments resulted in significantly greater yields than other treatments followed by DI75. PRD50 treatment produced significantly higher yield than DI50 in the 2017.
Statistical analysis results on grain yield, 1000-grain weight, dry matter yield, harvest index (HI), water productivity (WP) and irrigation water productivity (IWP) of quinoa under different treatments in the experimental years

Values followed by different small letters (a, b and c) indicate significant differences at P < 0.05; **LSD grouping at 1% level, *LSD grouping at 5% level.
Comparison of mean grain yield, 1000-grain weight and mean water productivity (WP) values averaged over two drip systems for the different treatments in the experimental years

Values followed by different small letters (a, b and c) indicate significant differences at P < 0.05; **LSD grouping at 1% level, *LSD grouping at 5% level.
DM yield
DM yield values for the different irrigation treatments and two irrigation methods in the experimental years are summarized in Table 1. Statistical analysis results are given in Table 2. Irrigation method and irrigation treatment interaction was significantly different with regard to DM yields (P < 0.05). FI under the SSD produced significantly greater DM yield than other treatments followed by FI under SD plots in the 2016 growing season. PRD50 treatments under both drip systems produced significantly greater biomass yield as compared to DI50 treatments. RDI resulted in higher DM yield than DI75 under both drip systems.
Irrigation method and irrigation treatment interaction was significantly different with regard to DM yield in 2017 (P < 0.05). FI and RDI under SSD produced significantly greater DM yield than other treatments and followed by FI and RDI under SD plots. Subsurface PRD50 produced significantly greater DM yield as compared to surface PRD50, DI75 and DI50 treatments. Subsurface RDI resulted in higher DM yield than surface RDI and DI75. RF produced the least DM yield.
Leaf area index
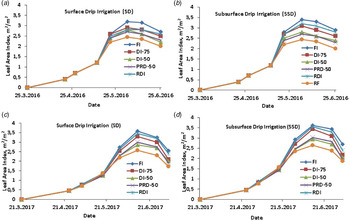
Variation of leaf area index (LAI) for different treatments under SD and SSD systems in the experimental years are depicted in Figs 2(a)–(d). As shown in Figs 2(a)–(d), LAI values under the SD and SSD systems had similar trends throughout the growing seasons. FI treatments under both systems resulted in greatest LAI values followed by RDI and DI75 treatments. FI treatment under SSD reached the maximum LAI value of 3.4 and FI under SD system had maximum LAI of 3.1 during flowering stage in the first year. In the second year, the corresponding values were 3.55 and 3.52 for SSD and SD, respectively. RF had the least LAI value among the treatments in the experimental years. LAI values in all treatments decreased towards the end of season due to leaf senecensence.
Colour online. Leaf area index (LAI) variation during the 2016–17 quinoa growing season in all treatments under surface and subsurface drip irrigation: (a) SD-2016; (b) SSD-2016; (c) SD-2017; (d) SSD-2017 (vertical bars represent standard errors).

1000 grain weight
1000 grain weight values for the different irrigation treatments and two irrigation methods in the experimental years are summarized in Table 1. Statistical analysis results are given in Table 2. There was no significant difference in 1000 grain weight between the two drip irrigation systems in the experimental years. However, irrigation treatments resulted in significantly different yields (P < 0.01) as shown in Table 3. Irrigation systems resulted in similar 1000 grain weight values in both experimental years. However, irrigation treatments produced significanly different 1000 grain weight values in the study years. The 1000 grain weight values were slightly greater in the first year than those in the second year. In 2016, the greatest 1000 grain weight value was observed in FI treatments followed by RDI and DI75. As the amount of irrigation water applied increased 1000 grain weight values also increased. RF produced the least 1000 grain weight value. In 2017, again FI treatment produced the greatest 1000 grain weight value than all other treatments followed by RDI and DI75. PRD50 resulted in significantly greater 1000 grain weight value than DI50 in the experimental years.
Harvest index
SD treatments produced slightly greater HI values than SSD treatments in the 2016 growing season, however, HI values were similar between the two drip systems in 2017. HI values under the different treatments varied from 45.9% in DI50 to 50.6% RF in SD treatments; and changed between 43.8% in PRD50 and 50.6% in RF in SSD in 2016. In the second year, HI values varied between 35.4% in DI50 and 39.9% in RDI in SD treatments; and varied from 34.0% in PRD50 to 38.9% in RDI in SSD. Greater DM yield and lower grain yield values in the second year resulted in lower HI values than those in 2016.
WP and IWP
WP and IWP values for the different irrigation treatments and two irrigation methods in the experimental years are summarized in Table 1. RF and PRD50 treatments resulted in significantly greater WP values than other treatments while the FI had the least WP in the 2016 growing season. The WP values ranged between 1.07 kg/m3 in FI and 1.34 kg/m3 in PRD50 under SD, and varied from 1.07 in FI and 1.30 kg/m3 in RF under SSD in the first year, and WP varied between 0.69 kg/m3 in DI50 and 0.77 PRD50 in SD system, and from 0.71 kg/m3 in FI to 0.76 kg/m3 in PRD50 under SSD. There was no significant difference between SSD and SD in the experimental years. WP values were significantly greater in 2016 than those in 2017 due to higher ET and lower grain yield values observed in the second year.
IWP values ranged between 0.21 DI50 and 0.65 kg/m3 in PRD50 under SD treatments, and varied from 0.36 in DI50 and 0.59 kg/m3 in RDI in SSD in 2016. In the second year, IWP values changed between 0.38 in DI50 and 0.82 kg/m3 in PRD50 in SD treatments; and varied from 0.53 in DI50 to 0.68 kg/m3 in FI in SSD. PRD50 resulted in the highest irrigation water use efficiency (IWUE) values, and lowest values were observed in DI50. There is no significant difference between the two drip systems regarding the IWP values. Except PRD50, FI and RDI treatments resulted in greater than other treatments in both drip systems.
The relationships between yield and ET and irrigation water
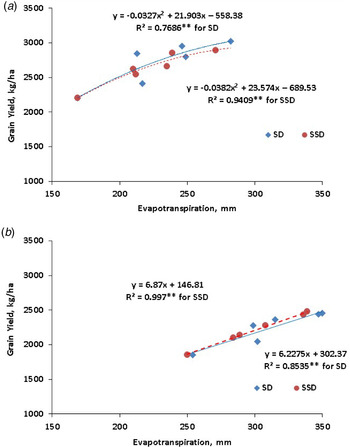
The relationships between grain yield and ET for different treatments under the two drip systems for the experimental years are shown in Figs 3(a) and (b). Significant second-order polynomial relations were found between yield and ET (P < 0.01). The equation for the yield–ET relations for SD and SSD systems in 2016 is as follows:


Colour online. The relationships between grain yield and crop evapotranspiration (ET) (a) 2016 and (b) 2017.

Significant linear relationships were obtained between yield and ET for drip systems in the 2017 growing season (P < 0.01). The following equations were developed for these relations:


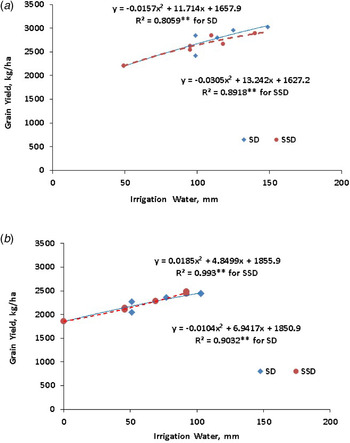
Significant second-order polynomial relations were developed between grain yield and irrigation water for experimental years as shown in Figs 4(a) and (b).
Colour online. The relationships between grain yield and irrigation water (a) 2016 and (b) 2017.

Yield response factor (ky)
The slope of the relationship between relative yield reduction and relative ET deficit is called yield response factor (ky). The yield response factor for SD and SSD treatments are depicted in Figs 5(a) and –(b), and ky values for SD and SSD systems for quinoa are found to be 0.54 and 0.66 in 2016 growing season. The corresponding values for the 2017 growing seasons are 0.89 and 0.80 for SD and SSD systems, respectively.
Colour online. The yield response factor (ky) for surface and subsurface drip treatments (a) 2016 and (b) 2017.

Discussion
In arid and semi-arid agroecosystems, drought is the main abiotic stress damaging the potential yield and causing yield instability in quinoa (Fuentes and Bhargava, Reference Fuentes and Bhargava2011 and Razzaghi et al., Reference Razzaghi, Ahmadi, Adolf, Jensen, Jacobsen and Andersen2011). The findings of the current research revealed that quinoa under SD plots used slightly more water than SSD plots for the same treatments most probably due to reduced surface evaporation from the SSD plots. SWC was similar for the FI, RDI and DI75 treatments, and was relatively higher compared to the DI50, PRD50 and RF treatments. SWC in the 40 cm soil depth was greater than SWC values in the 20 cm depth in the corresponding treatments. Application of water balance equation to 0–20 cm, 0–40 cm and 0–60 cm soil depth indicated that quinoa consumed most water from 0–20 cm soil depth followed by 20–40 cm depth under different treatments.
There was no significant difference in grain yields between the two drip irrigation systems in the experimental years. However, irrigation treatments resulted in significantly different yields (P < 0.01). Quinoa grain yield values in the first year were greater than those in the second year, due to more favorable weather conditions that prevailed in the first year. Maximum air temperatures in 2016 were (22.3, 27.9, 28.3, 33.7 and 35.3°C in March, April, May, June and July, respectively) several degrees higher than those in 2017. Especially, occurrence of high air temperatures (over 35°C) for several days in a row during the flowering period in late April 2017 could be the reason for relatively lower yields in the second year. Other parameters were similar, therefore this is probably the reason for greater yield in 2016 then in 2017. A high temperature during flowering and seed set can significantly reduce the yield (Hinojosa et al., Reference Hinojosa, González, Barrios-Masias, Fuentes and Murphy2018). Although not evaluated in the current study, the genetic ability of quinoa might be another cause for lower yields in 2017.
RDI appeared to be good alternative to FI since it produced statistically similar yield to FI treatment in both experimental years. RDI resulted in water saving of 23 and 21% for SD and SSD systems, respectively, in the first year and no saving occurred in the second year since FI and RDI received same amount of irrigation water, and no irrigation was applied during the vegetative growing stage in 2017 due to sufficient enough rainfall received. DI75 treatment produced similar grain yield with FI in the first year but significantly lower yield in the second year due to differences in amount and distribution of rainfall between the two growing seasons. DI75 treatment resulted in water savings of 16% for both drip methods in the first year and 10 and 25% for SD and SSD systems, respectively, in the second year. Average grain yield reductions of 3 and 8% occurred in DI75 in comparison to FI were determined for the first and second experimental year, respectively. Therefore, DI75 can be considered as an alternative to FI in water scarce regions.
The yield reductions changed between 24 and 27%, respectively, for SSD and SD under the rainfed (nonirrigated) conditions in 2016; and the corresponding decreases were 24 and 25%, for SD and SSD in 2017. Quinoa is highly resistant to a number of abiotic stresses (Jacobsen et al., Reference Jacobsen, Mujica and Jensen2003). Several drought resistant mechanisms are present in quinoa. Drought in early vegetative stages may prolong its life cycle, allowing the plant to make up for growth lost during the early drought if water becomes available later. Drought stress during the vegetative growth stage leads to deep root development, and without stress conditions for the rest of the growing season allowed the plant to be able to optimize its photosynthesis and carbon translocation (Geertz et al., Reference Geerts, Raes, Garcia, Vacher, Mamani, Mendoza, Huanca, Morales, Miranda and Cusicanqui2008; Jacobsen et al., Reference Jacobsen, Liu and Jensen2009; Hirich et al., Reference Hirich, Jelloul, Choukr-Allah and Jacobsen2014). Greater midday leaf water potential (LWP) values were observed in FI treatment plots than the DI treatment plots under both drip systems (data are not shown, details can be found in Bozkurt Çolak et al., Reference Bozkurt Çolak, Yazar, Alghory and Tekin2020). RDI and DI75 treatments had greater LWP values than DI50 and PRD50 treatments since RDI and DI75 received more irrigation water than DI50 and PRD50 treatment. We also observed slightly higher LWP values in SSD plots than in the SD plots, however, the difference between the two irrigation systems was not significant. Generally, LWP values decreased towards the end of season in comparison to the beginning of the season (Bozkurt Çolak et al., Reference Bozkurt Çolak, Yazar, Alghory and Tekin2020). Towards the end of the growing season, SWC reached closer to the wilting point in DI50, PRD50 and RF treatments. Gradual build up of water stress as indicated by lower SWC and lower LWP, resulted in reduced grain yields in DI50, PRD50 and RF treatments in the experimental years. These findings are in line with the results reported by Lavini et al. (Reference Lavini, Pulvento, d'Andria, Riccardi, Choukr-Allah, Belhabib, Yazar, Ince Kaya, Sezen, Qadir and Jacobsen2014), and Razzaghi et al. (Reference Razzaghi, Plauborg, Jacobsen, Jensen and Andersen2012) who stated that water stress during grain filling stage significantly decreased the seed yields of quinoa Titicaca. Cocozza et al. (Reference Cocozza, Pulvento, Lavini, Riccardi, d'Andria and Tognetti2012) suggested that a certain amount of water supplied during flowering and grain filling is enough to stabilize quinoa yield even for severe DI. Geerts et al. (Reference Geerts, Raes, Garcia, Vacher, Mamani, Mendoza, Huanca, Morales, Miranda, Cusicanqui and Taboada2007) found that drought stress during pre-flowering, flowering and early grain filling had a strong negative effect on grain yield and WP when compared to drought stress in the vegetative stage or FI. DI can stabilize yields at a level that is significantly higher than under rainfed cultivation (Geerts et al., Reference Geerts, Raes, Garcia, Taboada, Miranda, Cusicanqui and Vacher2009). In this study, RDI treatment allowed water stress during the vegetative growth stage, produced grain yield almost the same as that produced with FI. Hirich et al., (Reference Hirich, Jelloul, Choukr-Allah and Jacobsen2014) reported similar findings to RDI that for quinoa treatment receiving 50% of FI during vegetative growth stage recorded the highest yield and WP in Morocco.
The grain yield of quinoa cv. Titicaca ranged between 2.0 and 3.0 t/ha under non-stressed conditions in the Mediterranean region of Turkey (Yazar and İnce Kaya, Reference Yazar and İnce Kaya2014). Pulvento et al. (Reference Pulvento, Riccardi, Lavini, Iafelice, Marconi and d'Andria2012) found that yields for ‘Titicaca’ ranged between 2.30 and 2.70 t/ha whether grown under high irrigation (300–360 mm) or DI (200–220 mm) in Italy. In Denmark, Razzaghi et al. (Reference Razzaghi, Ahmadi, Adolf, Jensen, Jacobsen and Andersen2011) obtained 3.3 t/ha yield from quinoa cv. Titicaca under non-stressed conditions while it was reported that total grain yield of same variety ranged from 1.9 to 3.3 t/ha in Italy (Lavini et al., Reference Lavini, Pulvento, d'Andria, Riccardi, Choukr-Allah, Belhabib, Yazar, Ince Kaya, Sezen, Qadir and Jacobsen2014). In Bolivia 3.7 t/ha (Garcia et al., Reference Garcia, Raes and Jacobsen2003); in Chile 2.6 t/ha (Martinez et al., Reference Martinez, Veas, Jorquera, San Martin and Jara2009) and in Morocco 3.3 t/ha (Hirich et al., Reference Hirich, Jelloul, Choukr-Allah and Jacobsen2014) grain yields have been obtained from different quinoa varieties.
Alvar-Beltran et al. (Reference Alvar-Beltran, Saturnin, Dao, Marta, Sanou and Orlandini2019) obtained the highest yield of Titicaca (1.9 t/ha) from the November sown quinoa irrigated at 60% potential ET and with 25 kg N/ha in Burkina Faso. Ahmadi et al. (Reference Ahmadi, Solgi and Sepaskhah2019) evaluated the plant density response of quinoa to FI in Iran and reported the grain yields varied between 2.86 and 3.65 t/ha. Praveen Kadam et al. (Reference Praveen Kadam, Suneetha Devi, Hussain and Uma Devi2018) studied the effect of DI applied with SD and SSD systems in India and they found that the highest grain yield and stalk yield was recorded with 1.0 Epan (Class A pan evaporation) throughout cropping period in India. According to these results, grain yields of quinoa under non-stressed conditions vary depending on plant cultivars, sowing date and environmental conditions such as soil and climate. The results of this study revealed that both RDI and DI75 treatments appeared to be suitable irrigation strategies under the Mediterranean climatic conditions.
In general, as the amount of irrigation water increased DM yield also increased, except for PRD50 under SSD. The DI treatments caused a significant reduction in above ground plant DM yield. Thus, water stress resulted in lower DM yield in the RF, DI50, PRD50 treatments in comparison to RDI, DI75 and FI treatments. Several researches showed that DI application during vegetative growth stage induced root system growth and development for quinoa (Jensen et al., Reference Jensen, Jacobsen, Andersen, Andersen, Mogensen, Núñez and Rasmussen2000; Geerts et al., Reference Geerts, Mamani, Garcia and Raes2005; Jacobsen et al., Reference Jacobsen, Liu and Jensen2009). Pulvento et al. (Reference Pulvento, Riccardi, Lavini, Iafelice, Marconi and d'Andria2012) reported that the treatment with a reduction in the irrigation water to 25% of full irrigated treatment caused an increase in WP and a reduced DM accumulation in the leaves in Italy. Hirich et al. (Reference Hirich, Jelloul, Choukr-Allah and Jacobsen2014) observed the highest DM accumulation under FI conditions and the highest HI was recorded when quinoa was subjected to water stress during vegetative growth stage.
In general, LAI index values increased with increasing irrigation water. FI treatments under both systems resulted in greatest LAI values followed by RDI and DI75 treatments. RF had the least LAI value among the treatments in the experimental years. LAI values increased continuously until grain filling stage in all treatments, and then decreased towards the end of season due to leaf senecensence. Since the leaf area of plants is reduced under stress, the water used for transpiration is reduced; efficiency of water use is remarkably higher in these plants compared to FI and RDI. The increase in LAI of quinoa with irrigation has also been reported by Garcia et al. (Reference Garcia, Raes and Jacobsen2003). The deficit treatments (DI50, PRD50) caused a significant reduction in leaf surface. Yazar et al. (Reference Yazar, İnce Kaya, Sezen and Jacobsen2015) determined LAI values for fresh and saline irrigation water treatments varying from 1.4 in RF and DI25 to 2.9 in FI with fresh water for drip-irrigated Titicaca variety in Turkey. Ince Kaya (Reference İnce Kaya2015) reported the maximum LAI value of 2.5 for FI for Titicaca cultivar in Turkey. They concluded that water and salinity stress together reduced LAI considerably compared with FIs with fresh water. Lavini et al. (Reference Lavini, Pulvento, d'Andria, Riccardi, Choukr-Allah, Belhabib, Yazar, Ince Kaya, Sezen, Qadir and Jacobsen2014) found the highest LAI value of 2.8 for full irrigated treatment and the least LAI in severe stress treatment in Southern Italy. Fghire et al. (Reference Fghire, Anaya, Issa Ali and Wahbi2017) evaluated the effect of water stress on LAI which increased significantly and a continuously and peaked at grain filling stage for all water treatments and there after the LAI started to decrease in Morocco. Similar results are reported by Praveen Kadam et al. (Reference Praveen Kadam, Suneetha Devi, Hussain and Uma Devi2018) that LAI reached peak at grain filling stage and declined at maturity due to drying and senescence of foliage. The non-stressed treatment reported significantly higher LAI at all stages of the crop, it is followed by non-stressed treatments at grain filling stages in India.
As the amount of irrigation water applied increased 1000 grain weight values also increased. RF produced the least 1000 grain weight value while FI treatment had the greatest 1000 grain weight value than all other treatments followed by RDI and DI75. PRD50 resulted in significantly greater 1000 grain weight value than DI50 in the experimental years. The research findings indicated that water stress caused a decrease in 1000 grain weight in RF and DI50 treatments in comparison to FI, RDI and DI75 treatments. Razzaghi et al. (Reference Razzaghi, Plauborg, Jacobsen, Jensen and Andersen2012) determined the 1000-grain weight values for titicaca varying from 3.1 and 3.2 g for different soil textures in Denmark. Pulvento et al. (Reference Pulvento, Riccardi, Lavini, Iafelice, Marconi and d'Andria2012) found 1000-grain weight values changing between 2.44 and 2.67 g for Titicaca in Italy. Yazar et al. (Reference Yazar, Sezen, Bozkurt Çolak, Ince Kaya and Tekin2017) reported 1000-grain weight values ranging from 3.03 g in FI to 3.29 g in RF under normal planting time; and varied from 2.62 g in FI to 2.79 g in RF in late planting in Turkey. The findings in the present study are contradictory to findings reported by Yazar et al. (Reference Yazar, Sezen, Bozkurt Çolak, Ince Kaya and Tekin2017). Alvar-Beltran et al. (Reference Alvar-Beltran, Saturnin, Dao, Marta, Sanou and Orlandini2019) determined the 1000-grain weight values varying between 1.75 and 2.41 g for Titicaca variety in Burkina-Faso under different irrigation treatments.
There was no significant difference among the irrigation treatments regarding the HI. Greater DM yield and lower grain yield values in the second year resulted in lower HI values than those in 2016. The DI treatments caused a significant reduction in above ground plant DM and grain yields. Thus, water stress resulted in lower DM yield and grain yield in the RF, DI50, PRD50 treatments in comparison to RDI, DI75 and FI treatments. Razzaghi et al. (Reference Razzaghi, Plauborg, Jacobsen, Jensen and Andersen2012) found HI values for sandy-loam, sandy and clay loam soils, respectively, as 46, 47 and 43% for titicaca variety in Denmark. Pulvento et al. (Reference Pulvento, Riccardi, Lavini, Iafelice, Marconi and d'Andria2012) reported HI values for titicaca ranging from 40 and 41% in Italy. Yazar et al. (Reference Yazar, İnce Kaya, Sezen and Jacobsen2015) found HI values varying between 44 and 47% for titicaca variety in Turkey. Yazar et al. (Reference Yazar, Sezen, Bozkurt Çolak, Ince Kaya and Tekin2017) reported HI values ranging from 30.9% in FI to 36.6% DI25 under normal planting time; and varied from 28.7% in FI to 30.1% in RF in late planting in Turkey. Alvar-Beltran et al. (Reference Alvar-Beltran, Saturnin, Dao, Marta, Sanou and Orlandini2019) found HI values varying between 35 and 40% for titicaca variety under different irrigation treatments in Burkina Faso.
Regarding the WP, there was no significant difference between SSD and SD in the experimental years. WP values were significantly greater in 2016 than those in 2017 due to higher ET and lower grain yield values observed in the second year. RF and PRD50 treatments resulted in significantly greater WP values than other treatments while the FI had the least WP. As a C3 crop, quinoa's WP is generally low, lying between 0.3 and 0.6 kg/m3 in the Bolivian Altiplano while exceeding 1 kg/m3 in Morocco and Italy (Geerts et al., Reference Geerts, Raes, Garcia, Taboada, Miranda, Cusicanqui and Vacher2009; Hirich et al., Reference Hirich, Jelloul, Choukr-Allah and Jacobsen2014; Lavini et al., Reference Lavini, Pulvento, d'Andria, Riccardi, Choukr-Allah, Belhabib, Yazar, Ince Kaya, Sezen, Qadir and Jacobsen2014; Riccardi et al., Reference Riccardi, Pulvento, Lavini, d'Andria and Jacobsen2014). Geerts et al. (Reference Geerts, Raes, Garcia, Vacher, Mamani, Mendoza, Huanca, Morales, Miranda and Cusicanqui2008) reported that drought stress conditions at key phenological stages (pre-flowering, flowering and pasty grain formation) had a negative effect both on grain yield per plant and WP. Yazar et al. (Reference Yazar, İnce Kaya, Sezen and Jacobsen2015) found WP values varying between 0.48 and 1.39 kg/m3 for Titicaca variety in Turkey. Yazar et al. (Reference Yazar, Sezen, Bozkurt Çolak, Ince Kaya and Tekin2017) reported WP values ranged from 1.00 kg/m3 in RF to 1.57 kg/m3 in DI25 treatment under normal planting time (early April) and from 0.53 (RF) to 0.75 kg/m3 (DI50) under the late planting (late April) treatments using drainage water applied with sprinkler line source system in Tarsus, Turkey. Patil et al. (Reference Patil, Kothari, Bhakar and Singh2018) recorded the maximum WP as 0.96 kg/m3 under the treatment IW/E-Pan ratio of 0.6 in India. Ahmadi et al. (Reference Ahmadi, Solgi and Sepaskhah2019) reported WP values for three planting densities varied between 0.25 and 0.39 kg/m3 in Iran. Alvar-Beltran et al. (Reference Alvar-Beltran, Saturnin, Dao, Marta, Sanou and Orlandini2019) found WP values for different planting times and different irrigation in Burkina-Faso changing from 0.17 to 1.69 kg/m3 for November planting; and varying from 0.23 to 0.81 kg/m3 for December planting. Yazar et al. (Reference Yazar, İnce Kaya, Sezen and Jacobsen2015) found IWP values varying between 0.88 and 1.0 kg/m3 for titicaca variety in Turkey. It can be concluded that higher WP should be associated with greater yield in order to recommend a suitable irrigation strategy for producers. In this study, RDI and DI75 treatments were recommended for farmers producing quinoa under semi-arid conditions.
Significant second-order polynomial relations were found between grain yield and crop ET in the first year but significant linear relationships were obtained in the second year. Yazar et al. (Reference Yazar, Sezen, Bozkurt Çolak, Ince Kaya and Tekin2017) determined significant linear relationship for normal planting time (April 11), and second-order polynomial relations were found between the seed yield and ET under the normal and late planting times (April 30) in Tarsus, Turkey (R 2 = 0.912 and 0.899 for normal and late planting, respectively). Patil et al. (Reference Patil, Kothari, Bhakar and Singh2018) derived second degree polynomial relationship between grain yield and total water applied with correlation coefficient of 0.89 in India. Our findings are in agreement with the above-mentioned studies. The high correlation between grain yield and ET in this study indicates that grain yield is strongly influenced by the pattern of water use during the course of the season and emphasizes the importance of adequate water supply during all growing season for higher yield and WP.
The yield response factor for SD and SSD treatments were <1.0 in both experimental years that means that quinoa is drought resistant crop. ky values were greater in the second year due to higher yields compared to the first year. Ince Kaya (Reference İnce Kaya2015) developed yield response factor (ky) for differentially irrigated quinoa cv. titicaca as 0.96 in the Mediterranean region of Turkey. Garcia et al. (Reference Garcia, Raes and Jacobsen2003) found ky of 0.67 for quinoa in Bolivia. Our findings are inline with these study results.
Conclusions
The results of the current study demonstrated that various DI strategies such as regulated deficit, PRD, and conventional DI applied with SD and SSD systems had significant effect on grain and DM yields of quinoa, and WP under the Mediterranean climatic conditions. However, the two drip systems performed similary regarding the grain and DM yields. RDI resulted in water saving of 23 and 21% for SD and SSD systems, respectively, but produced similar yield as I 100. DI75 treatment resulted in water savings of 16% for both drip methods in the first year and 10 and 25% for SD and SSD systems, respectively, in the second year. Average grain yield reductions of 3 and 8% occurred in DI75 in comparison to FI. Thus, RDI and DI75 treatments appear to be good alternative to FI in the Mediterranean environmental conditions. RF and PRD50 treatments resulted in significantly greater WP values than other treatments while the FI had the least WP.
Therefore, RDI, in which applying irrigation water by reducing the crop water requirement by 50% at the vegetative growth stage has a significant contribution for sustainable and efficient irrigation water utilization in water stress areas without any loss of grain and DM yield is recommended along with conventional DI (DI75) in the semi-arid Mediterranean area.
Financial support
The authors would like to thank the Turkish Scientific and Technical Research Council (TUBITAK) for its financial support for the project TUBITAK ERA-NET-215O951.
Conflict of interest
None.
Ethical standards
Not applicable.