As the 2020 U.S. elections loomed, North Carolina was widely presumed to be the southern state most likely to flip from red to blue. But when the November votes were tallied, the North Carolina GOP held on in both the presidential and Senate races, while Democrats shockingly claimed Georgia's sixteen electoral votes for the presidency. Additional surprises soon followed. In a January 2021 runoff election triggered by the failure of Georgia's GOP Senate contenders to reach 50 percent, two Democratic candidates, Jon Ossoff and Reverend Raphael Warnock, defied their party's traditional dismal performance in Georgia runoffs to score dual wins, thereby altering congressional control at the start of the Biden presidency.
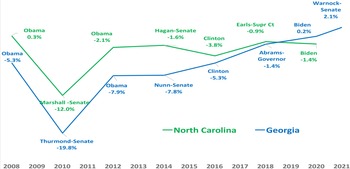
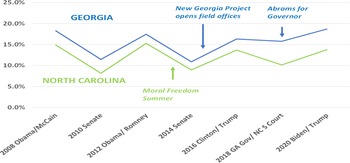
That Democrats had higher hopes for North Carolina in 2020 is understandable because Georgia was a longtime Republican stronghold. When Barack Obama won a narrow presidential victory in North Carolina in 2008, he lost Georgia by more than 5 points.Footnote 1 Furthermore, as Figure 1 shows, in ensuing top-of-the-ticket statewide races Georgia Democrats fell even further behind their North Carolina counterparts. Only after 2014 did the trajectories shift and diverge. Thereafter, North Carolina Democrats basically plateaued, eking out a hair-thin gubernatorial victory in 2016 but otherwise unable to win presidential or U.S. Senate contests. Meanwhile, Georgia Democrats closed their two-party gap cycle by cycle through the 2021 Senate runoffs.
Gaps between Democratic and Republican Vote Shares in Key Statewide Elections in Georgia and North Carolina, 2008–2021.
Note: Gaps are calculated by subtracting state-level two-party Republican vote shares from state-level two-party Democratic vote shares. Negative percentages indicate a Republican victory, and positive percentages indicate a Democratic victory. Sources: Georgia Secretary of State Current and Past Election Results, accessed March 27, 2021, https://sos.ga.gov/index.php/Elections/current_and_past_elections_results; North Carolina State Board of Elections Historical Election Results Data, accessed March 27, 2021, https://www.ncsbe.gov/results-data/election-results/historical-election-results-data.

In response to the southern surprises of 2020–21, analysts who only months before had predicted that Democratic contenders for statewide federal offices would do better in North Carolina than in Georgia provided reasons why opposite outcomes happened—usually following the standard pattern of emphasizing recent national party actions or sociodemographic trends.Footnote 2 As we will show, some of these post hoc explanations are factually wrong, while others are insufficient. To improve our understanding of shifts in 2020–21, our research instead tracks the organizational capacities and strategies of social justice campaigns over the past decade and a half that have aimed to shift public policies and balances of political power in these two socioeconomically dynamic states. Led by two charismatic Black leaders, the Reverend William Barber II in North Carolina and Stacey Abrams in Georgia, these campaigns have pursued parallel goals and fashioned statewide alliances of nonprofit civic associations aiming to shift public policies and power balances. Using newly collected, detailed organizational data and a comparative-historical research design, we show that recent electoral shifts in these states are, in significant part, due to variations in the organization-building and coalitional efforts of the years-long social justice campaigns. Georgia civic activists moved toward closely aligning their policy goals and electorally relevant activities with Democratic candidacies, while North Carolina activists repeatedly pursued more nonpartisan morally framed goals.
Our analysis lies squarely in the field of American political development, where scholars have demonstrated that contemporary as well as past outcomes of interest can be partly due to gradually unfolding factors and intersections of separately developing processes. One pertinent example of such an analysis is Daniel Galvin's probe of Republican and Democratic efforts at presidential party building from the 1950s to the early 2000s. In his Presidential Party Building, presidential inputs to party organizational capacities are understood not as mere synchronic responses to election-year challenges but as multicycle developments that may (or may not) cumulate into new capacities that contribute to apparently sudden electoral shifts.Footnote 3 Another example is Eric Schickler's dissection of the decades-long subnational civic and electoral roots of partisan realignment around civil rights, a shift that other analysts had previously seen as rapidly occurring in the mid-1960s.Footnote 4 The subject matter and political outcomes we explore here are different from such earlier studies, but the logic of our empirical and explanatory approach is similar. We show that long-term, gradually fashioned organizational configurations, in interaction with the intended and unintended effects of tactical choices by organizational coalitions pushing for racial and economic justice in state politics, have ultimately contributed to what look like sudden electoral tipping points. Like Galvin in particular, we show that apparently lagging organized political actors (in this case Georgia racial reformers and Democratic candidates) can end up overtaking apparent front-runners (in this case North Carolina counterparts) if shifting political opportunity structures and organization-building choices allow for payoffs from previously cumulated new capacities. Come-from-behind Democratic victories in Georgia compared to North Carolina thus resemble other comparisons in which historical-institutional scholars have shown that early successes can lead to a plateau for a leading country or organization while spurring and leaving room for innovations by the laggard. There can be advantages to backwardness, as economic historian Alexander Gerschenkron once argued.Footnote 5
In the next two introductory sections, we first explain the insufficiency of both demographic-determinist and short-term political accounts of the 2020–21 election outcomes in North Carolina and Georgia. We then set up a comparative-historical analysis of a decade and a half of previous developments in social justice campaigns whose differences, despite many similarities, fed into the recent electoral surprises. Although some may wonder whether a comparison of “just two” states matters for comprehension of broader U.S. politics, we think the answer is a definitive yes. The fact that Georgia as a longtime bedrock of GOP and conservative electoral strength has become highly competitive and delivered statewide victories to Democratic presidential and senatorial contenders much sooner than most observers expected has already made a difference in national U.S. governance—allowing President Joe Biden to eke out congressional votes for major socioeconomically redistributive policy responses to the Covid-19 pandemic. In addition, the southern surprises of 2020–21 are inspiring new voter outreach approaches on the left and fueling fierce right-wing backlashes against minority and metropolitan voter access. No matter what happens next in Georgia and North Carolina, the long-brewing shifts registered in the 2020–21 elections are likely to reverberate in U.S. politics for years to come.
1. Insufficient Explanations
After the 2020–21 votes were counted, media and scholarly analysts turned to short-term resource shifts and gradual demographic trends to explain the Georgia and North Carolina results. Campaign spending is widely presumed to sway elections, and the years just before 2020 did see shifts in some infusions of political money into the Tar Heel and Peach states. From 2011 to 2017, the Democratic Party of Georgia raised only $9 million, while the North Carolina Democratic Party raised $23.5 million.Footnote 6 However, Jon Ossoff's unsuccessful 2017 run for the House of Representatives and Stacey Abrams's 2017–18 near-miss bid for the governorship brought significant flows of political money into Georgia—with Ossoff notably raising almost $30 million in the most expensive House race prior to 2018.Footnote 7 Although some new donations continued to flow into Georgia Democratic campaigns after 2018—and donations spiked again just before the January 2021 Georgia runoffs—Democrats funneled more money into North Carolina than Georgia leading into November 2020.
After Barack Obama won North Carolina in 2008, Democrats doggedly considered the state closer to tipping and channeled larger shares of resources for presidential and Senate contests into the state.Footnote 8 For 2020 as well as 2016, presidential candidates also targeted North Carolina more than Georgia for television ads and visits.Footnote 9 Democrats, in particular, did not visit Georgia until shortly before November 2020, because the Biden ticket was presumed to have little chance to carry that state.Footnote 10
Another point to keep in mind is that candidates who raise and spend more short-term money do not always prevail. Although very well-funded, the 2017 Ossoff and 2018 Abrams campaigns did not win. Furthermore, short-term multimillion-dollar infusions often go toward advertising and organizing in metropolitan regions. This seems to have been the case for most of the multimillions raised and spent for the Georgia Senate runoffs between November 2020 and early January 2021, as we were told in a confidential interview with an experienced organizer who felt that less well-resourced efforts in southwest Georgia depended on years of previous ground-level organizing in local communities. Evidence we have assembled for this article offers some substantiation for this claim.
Beyond campaign spending, most Monday-morning quarterback analyses of these 2020–21 results stress demographics. Some observers argue that metropolitan Atlanta fueled Georgia Democratic victories, because population in that region has grown rapidly—and because metropolitan-area college-degreed voters have shifted toward Democrats across the country during the Donald Trump era. Such swings indeed mattered in Georgia—yet they mattered in North Carolina as well. Tellingly, eligible voters with bachelor's degrees or higher constitute almost exactly the same share of the electorate in both states.Footnote 11 Democrats currently benefit from growing ranks of college-degree holders around the major metropoles, but—crucially—they cannot win statewide in either North Carolina or Georgia unless they also attract reasonable shares of support from disproportionately less college-degree-holding voters in smaller cities or exurban areas.Footnote 12 As we will stress in this article, since 2014 Georgia reformers have gotten better—both over time and compared to North Carolina reformers—at reaping Black votes from smaller cities and some rural counties. Although demographic trends and disparities do matter, they are not determinative in and of themselves. To realize demographic potentials, organizational efforts are also necessary—and we will show in this article that sustained efforts are especially important.
This brings us to a core underlying puzzle: Given that Georgia has long had a larger Black population share, why has it taken so long for Peach State Democrats to realize the putative electoral payoffs? To consider an often-invoked factor, could changing voter registration rules be at work? Georgia and North Carolina do not have parallel histories of voter registration rule changes. North Carolina instituted inclusive reforms (including same-day voter registration) in 2007; after Republicans took unified control of the North Carolina state legislative and executive branches in 2012, they passed laws to make voting and registration more difficult.Footnote 13 By contrast, Georgia established automatic voter registration in 2016. Nevertheless, throughout this period, Black voter registration levels have remained consistently higher in North Carolina than in Georgia.
A crucial point is that voter registration and actual turnout are two different things, and they may diverge. This reality is driven home by the last decade and a half of elections in North Carolina and Georgia. Since 2008, even though Black registration rates have remained higher in North Carolina than in Georgia, actual Black turnout has stalled or fallen off in North Carolina. In Georgia, the 2016 adoption of automatic voter registration no doubt facilitated recent increases in Black registration (compared to earlier years in that state and compared to North Carolina), but this reform also boosted white and GOP voter registration. Once registered, both white and Black Georgians had to actually go to the polls for their votes to matter. As we will stress throughout this article, Georgia Black turnout improvements have been crucial in recent years, and these cannot be attributed merely to Black population shares or voter registration levels.
Last, we cannot overlook that many observers attribute recent developments to personalities, stressing that North Carolina “does not have a Stacey Abrams.” The idea seems to be that a charismatic Black candidate is both necessary and sufficient to harvest demographic potential. But we know this cannot be the whole story, because Abrams did not win her 2018 governor's race, while two years later the much-less-exciting Joe Biden was able to claim Georgia's Electoral College votes. More important, we cannot conceptualize Abrams in merely individual terms. For years, Abrams has worked with others to build constellations of allied political and civic organizations capable of transforming policy outcomes and power balances in Georgia. Our analysis will dissect how, exactly, those organizations contributed to post-2014 Democratic electoral gains.
Nor has Abrams been the only prominent African American reform leader at work in the South. During the same decade and a half during which Abrams and her allies labored in Georgia, North Carolina's Reverend William Barber II and his allies developed their own dynamic social justice crusade. After winning the North Carolina NAACP presidency in late 2005, Barber launched the Forward Together Moral Movement and built alliances between NAACP chapters and dozens of advocacy organizations. By 2013, the Forward Together alliance was mounting massive protest marches widely touted as likely to push the Tar Heel state into the blue column—especially since, in the summer of 2014, the Barber alliance mounted its own electoral efforts in a Moral Freedom Summer campaign, which we will dissect below.
2. Growing States with Parallel Reform Coalitions
Similar trends in Georgia and North Carolina make this pair ripe for close comparative-historical analysis designed to pinpoint potentially causally relevant divergences. These two states have many important similarities. On the socioeconomic side, North Carolina and Georgia have long grown in parallel ways, starting with just under three million residents in 1920 and arriving at around 10.5 million by 2019. For the 2020 election cycle, eligible voting-age populations stood at 7.7 million for Georgia and 7.8 million for North Carolina.Footnote 14 These states currently boast fast-growing economies and are magnets for newcomers, including immigrants and college-educated migrants (some of them African Americans returning to their ancestral South). Georgia's larger Black population share potentially helps liberal reformers and Democrats. But any state with greater shares of poor and historically disenfranchised people can also lag both in registering such potential voters and persuading registered people actually to go to the polls in any given election. As noted earlier, Black turnout lagged for years in Georgia—because, understandably, after decades of exclusion, disadvantage, and defeats, many Black Georgians were not easily convinced their votes would matter.
Beyond socioeconomic circumstances, early twenty-first-century social justice campaigns in these two states have also evolved in ways similar enough to allow comparisons to pinpoint specific differences. During their formative periods, the campaigns spearheaded by William Barber in North Carolina and Stacey Abrams in Georgia similarly focused on building new organizational clout and coalitions to persuade state legislatures and governors to address the needs of low-income and Black residents. Both campaigns were originally efforts to shift public policies—and both initially went about this by beefing up preexisting organizations and constructing new network connections in service of statewide public outreach beyond metro areas. Prior to 2014, both sets of undertakings worked to achieve more equitable governance without much attention to direct voter engagement at the grassroots—especially not outreach to people who had previously not registered or voted. Only after it became evident that Republicans in full control of both North Carolina and Georgia state governments would not budge did both social justice coalitions mount new efforts to engage low-income, minority voters through nonprofit organizational actions. For somewhat different reasons, as we will learn, that turn toward field organizing happened especially during the lead-in to the November 2014 elections. From those early efforts, in turn, the two social justice campaigns learned different lessons, diverged in their next moves, and thereafter achieved different results from 2016 through 2020–21.
Overall similarities between North Carolina and Georgia and their respective social movements sharpen the paradox tackled here: How and why have the Georgia Democrats and allied social justice reformers—like the tortoise in the classic fable—recently caught up and edged ahead of their North Carolina counterparts, the “hare” that seemed ahead just a few years ago? Our comparative-historical analysis fleshes out hypotheses grounded in freshly collected empirical data about the arrays of organizations, mostly nonprofit civic groups in both cases, created or drawn into the Barber and Abrams coalitions. As scholars have long recognized, movements for change are not driven solely by the personal outlooks of leaders or the actions of masses of individual participants. Sociopolitical movements for change are always grounded in congeries of loosely connected organizations pushing together for the same overall transformations. Although these underpinnings are acknowledged, systematic data are difficult to find, so scholars often do not discover all they might about how organizational constellations come together and, in turn, channel ongoing movement efforts, tactical choices, and accomplishments, including results at the ballot box as well as through other means. We show that organizational data can be assembled—in our case, from public documents and lists preserved on the Internet Wayback machine—and then used to test hypotheses about movement dynamics and impacts. We show that early organizational choices and configurations tend to structure later goals and tactics. We reference specific sources of data on organizational forms and activities as we lay out findings in the sections to follow. In addition, we have been able to fill in data gaps and gain insights about tactics at critical junctures from interviews with knowledgeable, well-placed civic organizers in North Carolina and Georgia.
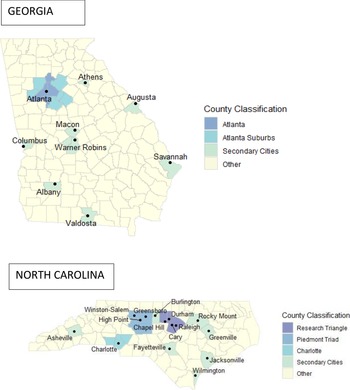
The spatial political geographies laid out in Figure 2 are front and center in our analyses. In Georgia, the massive metropole of Atlanta and its suburbs now accounts for more than 45 percent of the state's population. The Peach State also has eight regional secondary cities with populations of 50,000 and above, most located toward the South and some growing slowly if at all. North Carolina has more rural areas and small towns, and—importantly for our analysis—seven secondary cities spread across the state. North Carolina's fast-growing metropoles are in separate regions. The largest metropolitan complex around Charlotte stretches down into South Carolina, while the second largest Research Triangle complex (spanning Durham–Chapel Hill and the state capital, Raleigh) is situated in the center of the state. A third, less economically flourishing metro cluster consists of High Point, Greensboro, and Winston-Salem in the central Piedmont Triad region.
Metro Areas, Secondary Cities, and Nonurban Counties in Georgia and North Carolina.
Source: Authors’ coding, based off the U.S. Department of Agriculture's Rural-Urban Continuum Codes.

The following sections track the emergence and organizational accomplishments of the social justice campaigns orchestrated by Barber and Abrams and then assess their likely political effects, including recent electoral impacts, with particular focus on areas beyond major metropolitan centers and on Black eligible voter populations. We use statistical techniques as well as mapping to probe for associations between organizational activity and the outcomes of recent statewide electoral contests. Because of data availability limitations, our statistical analyses cannot pinpoint causal effects; nevertheless, the mapping exercises and statistical probes reinforce our broader comparative-historical findings about the electoral contributions of these two statewide social justice campaigns.
3. Organization Building in Two Social Justice Campaigns
Sustained modern social justice campaigns started in 2005 in North Carolina and between 2007 and 2011 in Georgia. These campaigns began during junctures when Reverend William Barber II and attorney Stacey Abrams entered new leadership roles and started assembling organizational coalitions to reorient state government. The centers of gravity of both organizational arrays ended up in nonprofit civil society, but they evolved from different directions. The Barber-orchestrated organizational constellations formed outside of government and party politics to try to exert transpartisan moral influence, while the Abrams-orchestrated constellations extended from avowedly partisan-leaning spaces, pushing outward from state government and the Democratic Party into adjacent civil society.
3.1 The North Carolina NAACP and Coalition Building for Moral Advocacy
In 2005, William Barber II, the 42-year-old pastor of the Greenleaf Christian Church in Goldsboro, decided to contest the presidency of the North Carolina Conference of NAACP branches. Barber had spent his childhood in Washington County, North Carolina, a poor, rural area in the eastern part of the state where his “father was preacher, and organizer and a teacher, his mother a school secretary.”Footnote 15 From high school on, Barber was active in student government and NAACP youth activities, commitments he continued while studying for his BA at North Carolina Central University, a historically Black college; a Master of Divinity Degree from Duke University; and a doctorate in Public Policy and Pastoral Care from Drew University. After a brief pastoral stint in Durham, Barber was appointed by Democratic Governor Jim Hunt to serve as the executive director of the state's Human Rights Coalition. In 1993, congregants in Goldsboro asked Barber to serve as their pastor, and a decade later, people impressed with his leadership urged a run for state NAACP president.
“New hands take NAACP reins” was the headline of an October 2005 article published after Barber decisively defeated incumbent president Melvin “Skip” Alston, a businessman and Guilford County commissioner.Footnote 16 The two men had “presented delegates with a contrast” of personalities and strategies for propelling social change.Footnote 17 Alston was someone who “looks at home in a business suit and usually speaks one on one in measured, carefully chosen phrases.” Barber's speaking style, by contrast, “is littered with inflections and phrases that give him away as a preacher” pledging to “speak truth to power” like “the man he quotes most frequently, the Rev. Martin Luther King, Jr.”Footnote 18 The two advocated different tactics to influence state government. Alston was proud that he had “made the organization more politically potent” by “working with state legislators” whose presence meant that the “NAACP does not have to jump up and holler anymore.”Footnote 19 But Barber and his allies criticized the NAACP's “banqueting and socializing culture” and propensity for “fawning over politicians who had regularly used the NAACP's infrastructure to get elected, and then went to Jones Street [where the General Assembly is located] and compiled perfect vote records of betrayal of the interests of poor and working people.”Footnote 20 He promised a return to 1960s-style civil rights activism that would “stand on our principles” and no longer “check with … [legislators] to negotiate what's most politically acceptable.”Footnote 21
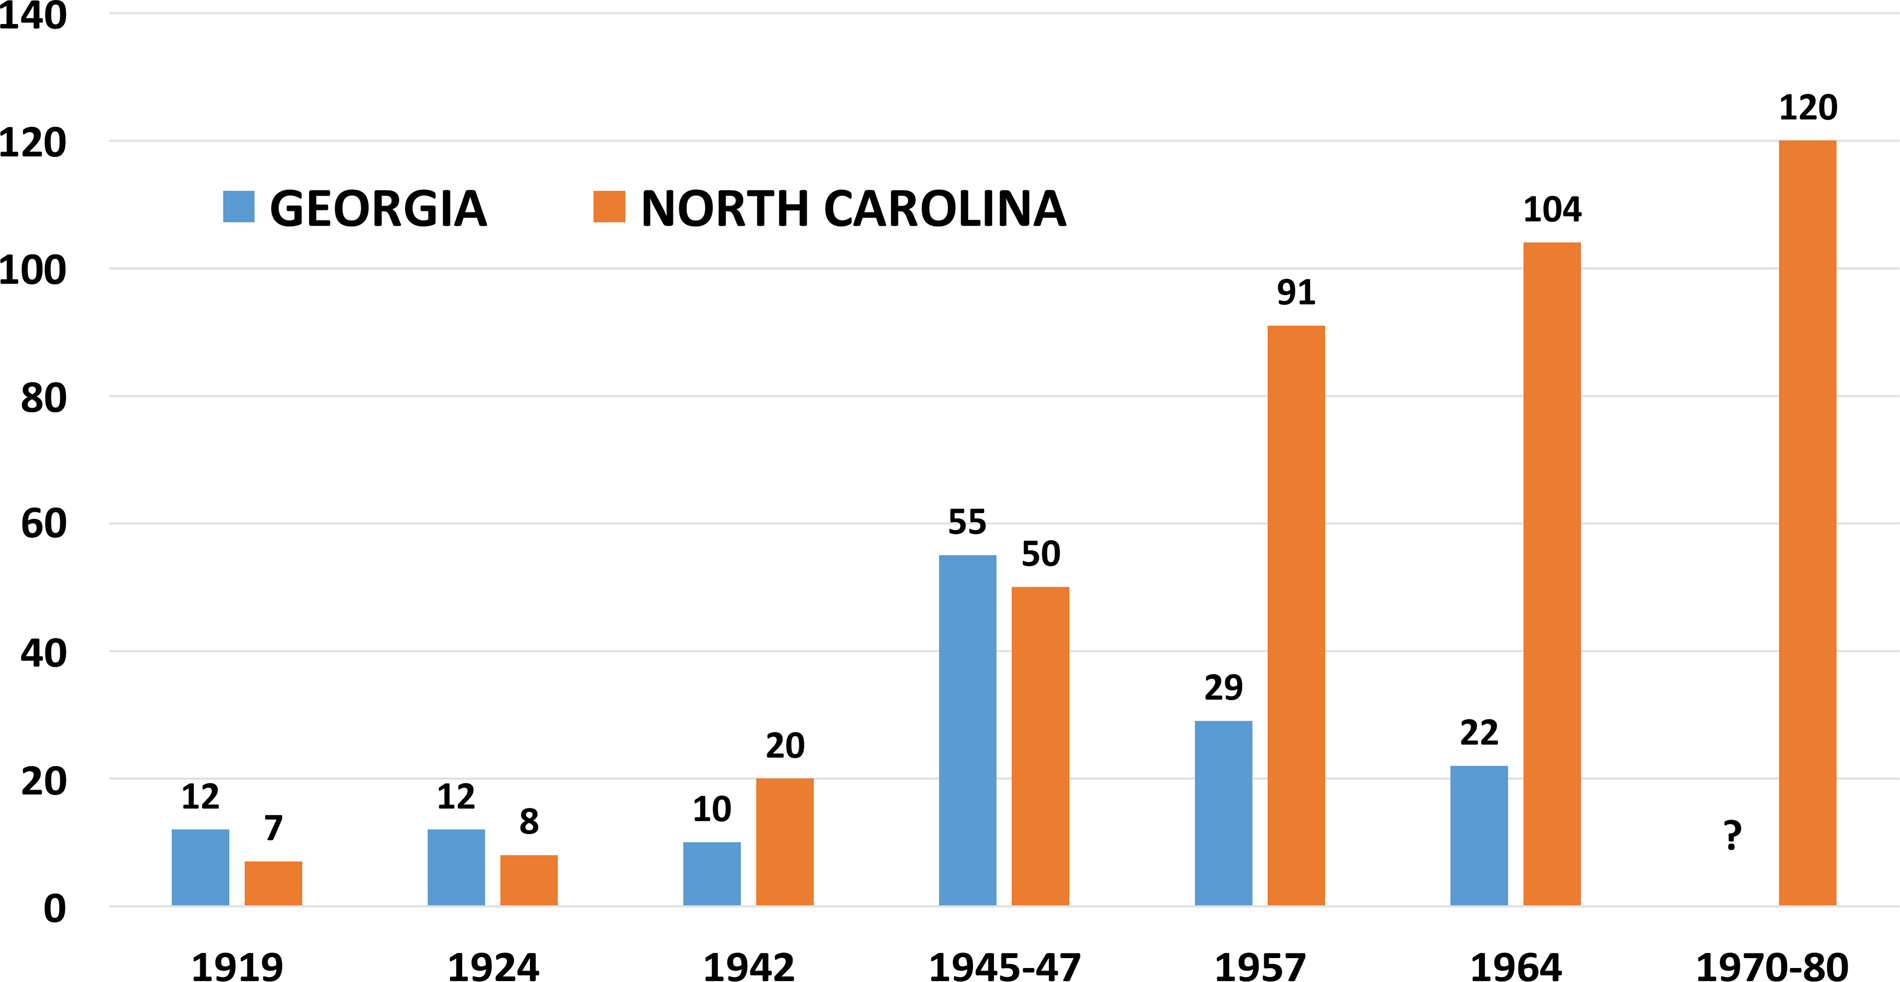
Barber took charge of a well-established NAACP federation with about a hundred local branches: “by far the best-known civil rights group both nationally and at the state level,” its “state president is one of the most recognized leaders in North Carolina who does not hold statewide political office.”Footnote 22 A look back tells us how this came to be. Founded in 1909, the NAACP quickly reached both North Carolina and Georgia, with pioneering units in place by 1919. Across the South, the NAACP reached a crescendo during and after World War II, after which many states faced rollbacks, as happened in Georgia under the sway of the Ku Klux Klan–backed governorships of Eugene and his son Herman Talmadge.Footnote 23 But growth continued in North Carolina (see Figure 3), where membership peaked between the 1960s and 1980s.Footnote 24 Statewide actions were undertaken long before the Barber era. Apart from the NAACP, no other association, including the Black teachers’ association and church conventions, “expressed public opposition to Jim Crow… on behalf of a statewide constituency.”Footnote 25
NAACP Branches in Georgia and North Carolina.
Sources: Most estimates come from the Mapping American Social Movements Project, University of Washington; additional North Carolina estimates come from Raymond Gavins, “The NAACP in North Carolina during the Age of Segregation,” in New Directions in Civil Rights Studies, ed. Armstead L. Robinson and Patricia Sullivan (Charlottesville: University of Virginia Press, 1991), 105–25; and Raymond Gavins, “National Association for the Advancement of Colored People,” in Encyclopedia of North Carolina, ed. William S. Powell (Chapel Hill: University of North Carolina Press, 2006).

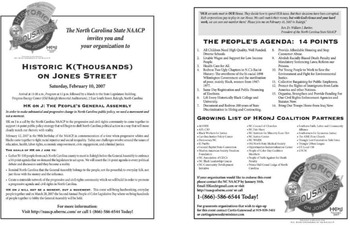
After Reverend Barber took the helm in 2005, he traveled more than 50,000 miles to speak at more than two dozen local branches.Footnote 26 In addition, Barber teamed up with white progressive activist and attorney Al McSurely to form “a coalition that extended beyond the base of the NAACP to include others who were concerned about justice and the good of the whole,” including many “progressive organizations that were predominantly white.”Footnote 27 In McSurely's later telling, “our aim was radical. To put forth a People's Agenda that would challenge the lawmakers’ entrenched habit of doing business for business.” After debate, “the NAACP leadership voted unanimously to sponsor the ‘Historic Thousands on Jones Street People's Assembly’”; the flyer for the first 2007 iteration appears in Figure 4.Footnote 28 The title was soon shortened to “HKonJ,” which became the moniker for annual repetitions of this coalition-sponsored march to the General Assembly in Raleigh. In this and subsequent flyers, “thousands” was deliberately left vague to leave room for misestimates and growth, while still signaling that this “wasn't just a couple of lobbyists … with policy papers, begging for some crumbs for poor people. This was a People's Lobby. Marching on the People's House.”
The North Carolina NAACP Coalition: Flyer for First March and the 14-Point People's Agenda.
Source: NC Policy Watch, accessed March 1, 2021, https://perma.cc/W8VB-GRPJ.

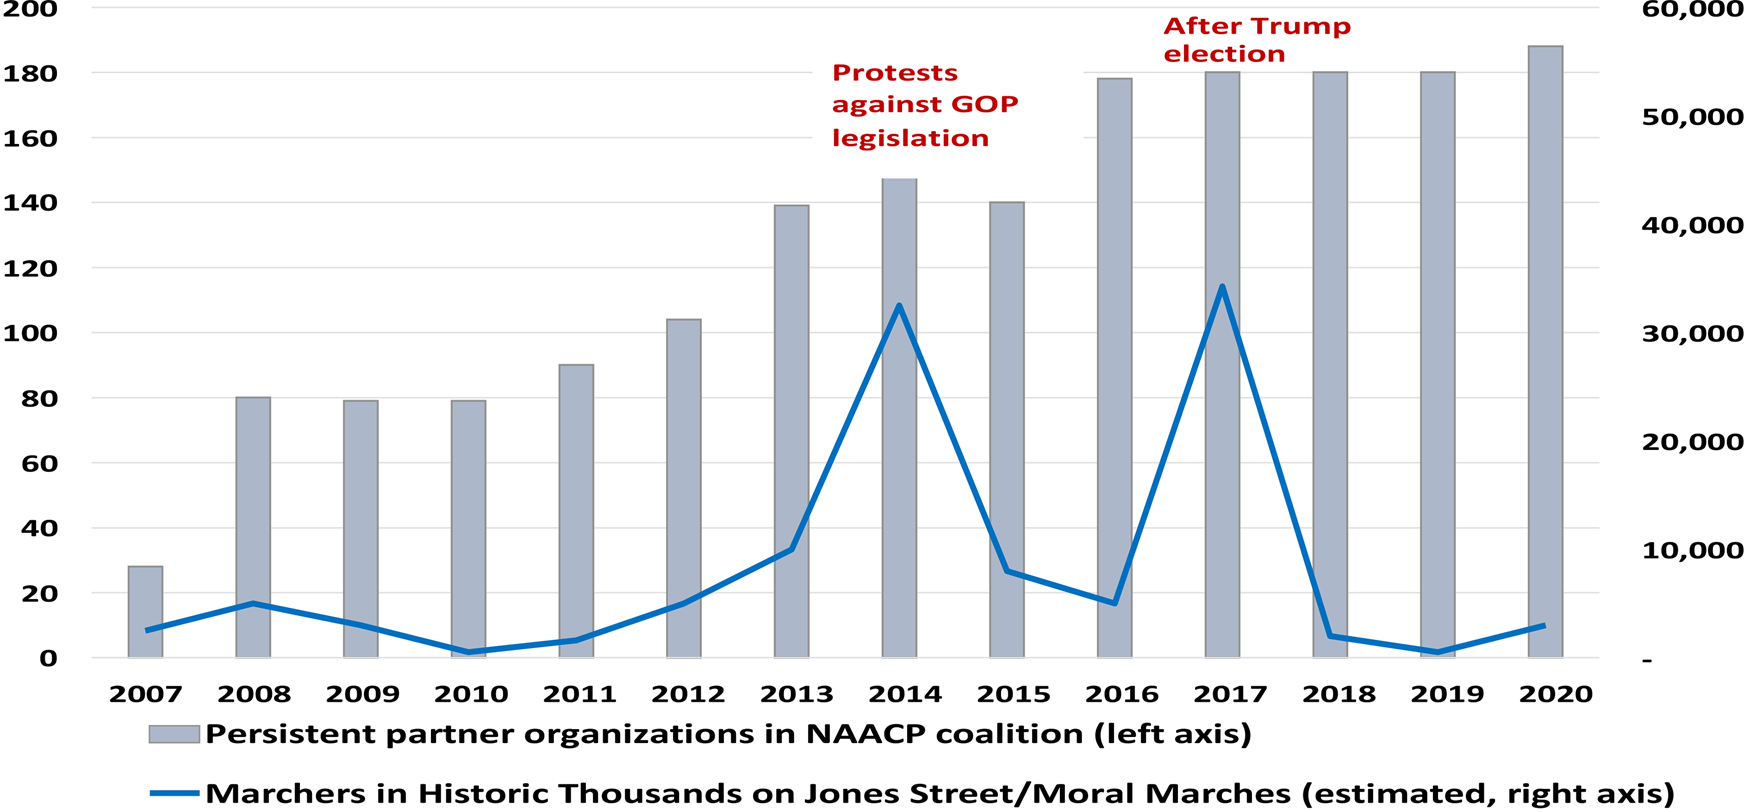
Initially the NAACP-led coalition brought together sixteen policy organizations focused on a variety of issues and constituencies. Yet as tracked in Figure 5, it soon added other advocacy groups, unions, and religious congregations, totaling more than two dozen by early 2007, 86 by 2008, and dozens more in later years. The coalition of NAACP “partners” was called a “Black-Brown-White” “transformative moral fusion” alliance, where each group would embrace other partners’ causes, ranging from educational development to civil rights, from unionization to social services, from gay rights to reproductive freedom. “Every issue was equally important,” in Barber's view. “Our most directly affected members would always speak to the issue closest to their own hearts. But they would never speak alone.”Footnote 29 Each year brought community events and advocacy projects leading into, and following up from, the annual HKonJ March in Raleigh—and causes could get extra emphasis, such as to respond to particular circumstances or rotate support for partner issues.
North Carolina NAACP's Partner Organizations and Annual Marchers in Raleigh, 2007–2020.
Sources: HKonJ partner organization figures from authors’ tally of dated lists, accessed via Wayback archives of the state NAACP website (https://web.archive.org/web/*/https://naacpnc.org/); crowd estimates from Raleigh News & Observer reporting.

During the early years when Democrats controlled state government, activism for a deliberately nonpartisan “moral” agenda gained some traction. Same-day voter registration enacted in 2007 may have facilitated the vote surge for Obama in 2008.Footnote 30 Movement leaders took early credit for state budgetary adjustments and union recognition for Smithfield pork-processing workers, and legal observers credited Barber's coalition with helping to pass laws to reduce racial bias in the death penalty.Footnote 31 But according to one 2008 report, more than half of eighty-three bills backed by the Moral Movement failed to get out of committee.Footnote 32 Although legislators in left-leaning districts praised the full 14-point agenda, Republicans and many Democrats pigeonholed it as a laundry list of far-left causes.Footnote 33
After 2010, insufficient responsiveness from Raleigh Democrats was no longer the chief obstacle. That November, Republicans flipped control of the General Assembly, and in 2012, GOP contender Pat McCrory won the governorship. Unlike the business-oriented moderates who had long held sway in the state GOP, the newly ascendant Republicans included ultra-free-market ideologues backed by Koch network allies, along with many Christian conservatives and Tea Party supporters fiercely opposed to Obama-era Democrats.Footnote 34 This rapid right-wing takeover hit both the state Democratic Party and the NAACP-led movement like a hurricane—and both would face ongoing dilemmas about how to respond. The myriad Raleigh-based left advocacy organizations, which were accustomed to lobbying state government for policy priorities, suddenly found no powerholders to whom they could turn. Prospects for the defeated North Carolina Democrats were especially dire. After several years of scandals and controversies, the state leadership was so decimated that Senator Kay Hagan and the national Democratic Senatorial Campaign Committee chose to run her 2014 reelection campaign through the Wake County party organization.Footnote 35
Meanwhile, the NAACP coalition channeled street demonstrations against “extremists”— Barber's nonpartisan euphemism for the new GOP trifecta. As the newly ascendant hard-right legislature and governor gutted aid to workers and the poor, slashed educational and social spending, attacked reproductive freedoms and gay rights, and rolled back voting access, liberal and progressive organizations went on full defense. Most that were not already part of the NAACP partnership signed on. Tens of thousands of newly activated people turned out for the Raleigh marches in 2013 and 2014 (see Figure 5).Footnote 36
During the legislative session from April to July 2013, activists launched “Moral Mondays” civil disobedience sit-ins at the General Assembly, during which close to a thousand people were arrested.Footnote 37 Throughout that summer and into the fall, Barber toured the state to allow NAACP branches and others beyond the Triangle to participate in the protests. In 2014, a new “Moral Freedom Summer” campaign deployed paid field organizers to do voter registration and canvassing as the state headed into a pivotal U.S. Senate contest between Democratic incumbent Kay Hagan and GOP legislative leader Thom Tillis, who had driven right-wing changes in Raleigh.Footnote 38 This was a peak moment for both Moral Movement protests and electoral efforts; before we assess the impact, we describe the development of a different kind of social justice campaign in neighboring Georgia.
3.2 Building the Georgia Democratic Party and Statewide Voter Engagement
Around the same time as North Carolina's Forward Together coalition took shape, the seeds of another statewide equity campaign were planted in Georgia, when 32-year-old Atlanta lawyer Stacey Abrams decided to run in 2006 for a seat in that state's House of Representatives. After winning, Abrams served on the Ways & Means and Appropriations committees and orchestrated party fundraising. Following her second reelection in 2010, she made a successful bid for minority leader, becoming the first woman and African American in that post. Her personal triumph came as Georgia Democrats lost dozens of seats and suffered nine defections from members who switched party affiliations to the GOP, leaving it just one seat short of supermajority control.
Leadership of a beleaguered caucus might not seem the best perch from which to build a new campaign for racial and economic justice, but statewide extraparty civil rights networks were relatively weak in Georgia, because earlier efforts to do such organizing had repeatedly faltered in the face of repression.Footnote 39 Abrams was young but accomplished when she set out to organize and fundraise for what grew into an intertwined network of Democratic Party and nonprofit projects. One of six children of librarian mother and a dockworker father who later became ministers, she was born in 1973 and raised mostly in Gulfport, Mississippi.Footnote 40 After her family moved to Atlanta, Abrams was her high school's valedictorian and graduated magna cum laude from Spelman College with a BA in economics, sociology, and political science. She earned a Master of Public Affairs from the University of Texas, Austin, and a JD from Yale Law School, before returning to Georgia to do nonprofit tax law at a prestigious Atlanta firm and serve as Deputy City Attorney. The energetic Abrams was always frankly politically ambitious and initially aimed toward running for the Atlanta mayorship. But established political players in the metropole were not so welcoming, and she soon reset her sights, reasoning that state government has “tremendous capacity to help people unlock their own potential” by improving conditions and opportunities for disadvantaged families.Footnote 41
As minority leader, Abrams raised modest funds from outside donors to bolster messaging and help reelect threatened House Democratic incumbents. She also traversed the state to meet Democrats who still held many posts in local governments, and to engage with “county party chairs, … people who wanted to run for office, grassroots leaders and activists, all on their home turfs.”Footnote 42 “Georgia Democrats seeking a road back” was the title of a January 2011 article about her early tour with House Caucus Chairman Brian Thomas, a white Democrat from Lilburn, to visit the cities of Albany, Columbus, Valdosta, and Macon. At every stop, Abrams promised Democrats would “hold the majority accountable” and focus on “three themes: economic security, educational opportunity, and individual freedom.”Footnote 43 She aimed to “connect … with lonely Democrats and ‘people who don't know they're Democrats yet.’” Speaking in June 2011 “before a joint meeting of the Middle Georgia Democratic Women's Club and the Houston County Democratic Committee,” Abrams noted the 250,000-vote gap between the two parties in the most recent election was “a difference Democrats could turn around. ‘It's time we make it known that it's safe to be a Democrat again.’”Footnote 44
In the initial phases of her statewide efforts, Abrams could be seen as an especially energetic and widely networking regular party politician—reenergizing the sort of insider tactics that Barber and his allies were repudiating in North Carolina. What set her apart from other standard Georgia Democrats at that early stage was ambition reaching far beyond her safe Atlanta district. Trips to spread hope and make contacts—especially with already engaged Democrats and aligned civic leaders across the state—peaked in Abrams's first years as House leader. Abrams claimed 156 “per diem” reimbursements for traveling on state business in 2011, 144 in 2012, and 141 in 2013 greatly surpassing the average of 60 per year from 2008 to 2010 claimed by preceding House leader DuBose Porter.Footnote 45 With the Georgia GOP aiming to restrict Democrats to concentrated Black areas in Atlanta and a few districts beyond, Abrams worked to maintain a multiracial party by promoting white as well as Black candidacies and doing sustained outreach to the state's growing Hispanic and Asian American constituencies. Intern programs she helped launch deliberately recruited young people from all parts of the state, some of whom went on to run for office.Footnote 46 In Atlanta and beyond, Abrams's travel calendars reveal attendance at events celebrating Asian, Hispanic, and Black leaders, as well as speeches at business and professional conventions.Footnote 47
In 2011 Abrams also became her party's de facto chief strategist, teaming up with Lauren Groh-Wargo, an experienced state elections organizer who had previously worked in labor campaigns and had most recently run an Ohio battleground campaign.Footnote 48 That alliance laid the basis for bolder, more innovative voter engagement efforts in later years—as together Abrams and Groh-Wargo drafted an election-by-election ten-year plan to expand Democratic electoral appeal and seeded civic organizing efforts that went well beyond established party committees. The 2010 defeats and defections of many longstanding Georgia Democratic Party honchos created a pressing need to rebrand Democratic and liberal causes—and arguably opened more space for fresh thinking in Georgia than in other southern state parties where racial and generational changes unfolded more slowly.
More gradual party change was certainly the story for North Carolina Democrats. After white Democrat and former attorney general Roy Cooper narrowly became governor in 2016, his party-building efforts focused on gaining legislative seats and securing his own reelection. In the North Carolina legislature, meanwhile, preexisting ranks of mostly white Democratic solons tied to business interests in Charlotte and the eastern parts of the state gave way bit by bit to Black legislators and lawyers and nonprofit leaders from the Raleigh- and Durham-centered Research Triangle.Footnote 49
Despite the different party contexts, both the Barber coalition in North Carolina and the Abrams network in Georgia spent years trying to move legislators and governors in egalitarian directions—although of course they pushed for policy changes in different ways. While Reverend Barber orchestrated marches to urge state officials to act on a large agenda that added together the diverse policy priorities of dozens of preexisting advocacy groups, Minority Leader Abrams engineered bipartisan compromises where possible and, when the GOP would not budge, worked with fellow politicians to articulate broadly popular oppositional stances that might attract more support from already engaged voters.Footnote 50 Subtle but telling differences resulted. Where the Barber Forward Together movement advocated for local school desegregation, for instance, the Abrams-led Georgia Democrats spoke about enhancing support for “community schools” and using education to “expand opportunities.”Footnote 51 Where North Carolina advocates stressed antiracism and antipoverty policies, the Georgians spoke more generally about creating better jobs and expanding access to health care.
Peach State reformers also placed a high priority on finding ways to leverage redistributive Obama-era federal measures that could boost poor residents of all races in urban and rural communities. Not coincidentally, the full flowering of Georgia's social justice campaign came via the tellingly labeled “New Georgia Project—Affordable Care Act” (NGP-ACA), a project devoted to implementing President Obama's 2010 health care reform. Launched in 2013 after Georgia Republicans not only blocked federal funding to expand Medicaid to the near-poor but also imposed hard-to-meet rules on “navigators” who were supposed to encourage sign-ups for subsidized private insurance, that first New Georgia Project hired “local community members to knock on more than twenty thousand doors and make more than 180,000 phone calls” across thirty-nine nonurban and urban counties to “explain health insurance to families who'd never had the option before.”Footnote 52 Once deployed, field workers generated fresh political insights as well as insurance enrollments.
On the ground, the NGP-ACA field workers learned that many people did not understand the state government's role. Confused that Obama might be denying them access to his own reform, people lacked information about how the GOP-run state government distorted implementation and why it might matter to vote specifically for Democrats who championed full implementation of health reforms along with other issues of concrete relevance to people on the ground. Bitter prior experiences had led many Black Georgians to conclude that elections were futile; and in some districts, constituents who knew representatives through local reputations or personal ties might not have noticed when some of them switched party affiliations to become Republicans. Organizers learned a crucial lesson lost to many national professional consultants who presume that poor Black people will automatically support Democrats. As feedback arrived from field workers, Abrams and others learned that Georgians needed trusted people to connect the dots between partisan control of government and policy changes—not just once or during a single election cycle, but again and again.Footnote 53
This was a critical juncture in the turn of the Abrams coalition toward the on-the-ground efforts to involve new voters for which it is now known. No one should assume that elected politicians of any background come naturally or automatically to the idea of investing in long-term outreach to formerly uninvolved and/or “low information” potential voters. Such efforts are expensive in money and especially time—and they pay off only gradually, usually not for the “next elections” that understandably preoccupy and incentivize officeholders or newly declared candidates. Yet at the 2013–14 juncture, the New Georgia Project's efforts to implement an already existing federal health care reform led to the conclusion that longer-term investments had to be made.
By the end of 2013, the mission of the New Georgia Project was enlarged to include voter registration and education, and thereafter Abrams's well-honed penchant for seeding new projects proceeded on two parallel (if often interconnected) tracks.Footnote 54 In addition to continuing efforts to beef up specific capacities of the state Democratic Party, Abrams helped found, inspire, and fund a bevy of nonprofit civic organizations, some 501c3s devoted to nonpartisan voter registration and issue education and others 501c4s or political action committees (PACs) that could engage in frank partisan outreach, including ongoing leadership training and voter contacting. Abrams-linked organizational vehicles and resource flows are complex, and compilations in the supplementary material represent our best effort to summarize undertakings ordered chronologically, starting before the New Georgia Project and moving through Abrams's efforts during and after her 2018 run for governor.
Our findings show that Abrams and her advisors repeatedly updated tactics or launched new efforts to engage potential voting constituencies. In addition to repurposing the NGP in 2014, Abrams set up the Voter Access Institute to mobilize voters about Medicaid expansion and build partnerships with local issue organizing. This institute later became the nonprofit framework for the assorted “Fair Fight” projects launched after Abrams fell short of winning the governorship in 2018. Nonprofit organizations founded or run by Abrams and close associates have been intertwined with one another and at least loosely aligned with Democratic Party organs or campaigns.Footnote 55 In some instances, these relationships are more direct—NGP employs some individuals who also serve as volunteer Democratic Party county chairs on their own time.Footnote 56 Good government watchdogs naturally criticized connections between formally separate projects. But Abrams had training and experience as a lawyer specializing in tax-exempt organizations, so she knew how to set up legally compliant projects and keep organizational books and leaderships separate enough to pass muster when Republicans inevitably mounted investigations of these efforts.Footnote 57
Not only did Abrams encourage complementary nonprofit and party-building projects that could push forward analogous policy priorities, she also helped raise the necessary funds, as Table 1 tracks. Although Abrams was relatively unknown in conventional party groups during her 2006 primary campaign, she displayed fundraising prowess, raising $127,000––about ten times the amount of her two opponents combined. Money raised was spent on direct mail and hiring community members to go with her door to door.Footnote 58 Soon after Abrams won her first seat, Georgia House colleagues tapped her to chair “the newly created fund-raising committee for our caucus,” giving her exposure to donors and lobbyists who “normally would have ignored a legislator in her freshman term.”Footnote 59 This experience proved valuable when she ran to lead the caucus just two years later.
Fundraising for Abrams Candidate Campaigns and Nonprofit Voter Projects

Note: Amounts are rounded to nearest dollar. Sources: Georgia Government Transparency and Campaign Finance Commission, authors’ searches of candidate campaign reports filed under Stacey Yvonne Abrams, not including any donations she solicited to the state party or caucus. Total amounts for Abrams's founded nonprofits determined from authors’ searches of IRS 990s for Third Sector Development (later titled Fair Count), the Voter Access Institute, New Georgia Project, and New Georgia Project Action Fund. IRS (Internal Revenue Service), Form 990: Return of Organization Exempt from Income Tax, accessed February 16, 2021, https://www.irs.gov/.
By the time Abrams ran for governor in 2018, the party had expanded from two employees in 2010 to 150 employees, benefitting from “$25 million in the bank.”Footnote 60 Abrams later explained that she “leveraged” her House minority leader title to make appeals to potential rich donors such as Steve Phillips, Susan Sandler, Tom Steyer, George Soros, and other progressives in the Democracy Alliance. “I went national in a way that just had not been done by my predecessors” to boost fundraising “from hundreds of thousands to millions of dollars.”Footnote 61 Although Abrams’ early fundraising drew much less left-leaning donor money into Georgia than the larger totals flowing into North Carolina, her fundraising accomplishments made possible not just party building but also—crucially and increasingly as time passed—growing civic investments in an assortment of nonprofits. Those included organizations Abrams and her partners directly founded, and in due course, contributions went to independent allied groups as well. In just six months during 2014, Abrams herself raised $3.5 million for the New Georgia Project's voter registration efforts, securing donor support even as the project got off the ground in fits and starts. More than $12.5 million was raised for such projects during the critical 2013 to 2016 period before Abrams was on the ticket statewide. For Georgia reformers, Abrams's cultivation of maverick national funders was critical, because (as we noted in the introduction to this article) over many years presidential campaigns and national mainstream Democratic honchos invested little in a state they saw as less flippable than North Carolina.
Before moving to a more thorough dissection of recent electoral trends, let us sum up what we have established so far. Politically ambitious statewide social justice campaigns grew from different origins in North Carolina and Georgia, but in both states these campaigns devoted their earliest efforts to reorienting state government and public policymaking and implementation. By 2014, reformers faced immoveable obstacles from increasingly hard-right Republicans in control of state governments, and in response, both states’ activists launched new efforts to engage voters—especially Black, economically struggling voters beyond as well as within major metro areas. Although they proceeded in different ways, reformers hoped to defeat and bypass extreme GOPers in critical statewide contests and open more space for the social justice gains they sought. Have their electorally relevant endeavors paid off? To what degree, where, and why in each state? Those are the issues to which we now turn.
4. Movement Geographies and Political Payoffs
Deciphering the political impact of social movements is a challenging task. Definitive evidence is hard to come by, true for our study as well, yet we have made progress by linking county-level data about reformers’ organizing activities to electoral shifts. We have also proceeded by differentiating organizing in major metropolitan areas from organizing in secondary cities and rural areas. For North Carolina, our findings suggest that the Barber movement—despite its stress on advancing participation and prospects for lower-income urban and nonurban poor people, especially Black North Carolinians—actually boosted progressive metropolitan liberalism and reinforced increasing Democratic Party reliance on (mostly white) college-educated voters. For Georgia, available evidence suggests that Abrams-orchestrated efforts have been more broadly successful at boosting Black voter registration and turnout and, in turn, improving vote shares for Democrats; we find that this has happened not just around economically booming Atlanta but also in secondary cities and some less prosperous small-town areas with large Black populations.
It is worth stressing that the validity of our assessments does not depend on any assumption that North Carolina or Georgia reformers care only about elections. Our comparison makes sense because both movements have long pursued similar overall missions—to revamp power relations toward African Americans and the economically underprivileged—and both made substantial turns toward electoral organizing in 2014. Social movement studies do not always move beyond noting the likely effects of protests on public agendas to assess the electoral or policy accomplishments and failures of movements that use different tactics and organizational efforts. Often, too, social movement studies examine one movement at a time over a short period—an approach that can prompt the conclusion that every movement uses its own distinctive approach and achieves some success. By contrast, we think close comparisons are important and see ourselves as part of the recently growing branch of social movement research focused, as described by Edwin Amenta, Neal Caren, Elizabeth Chiarello, and Yang Su, on “exploring alternative arguments about the productivity of different actions and characteristics of movements and movement organizations in the various political contexts and institutional settings they face.”Footnote 62 When multiple movements have similar goals, phases, and ongoing efforts—as has been true for social justice campaigns in North Carolina and Georgia—we hold that it is not only valid but also essential to try to measure and compare actual accomplishments to see if those can be related to underlying movement structures and choices made within those structures. We do that here by operationalizing movement structures in terms of organizational constellations put in place, modified, and redirected over many years.
4.1 Dual North Carolina Movement Networks at Cross Purposes
In North Carolina, as we have seen, Barber's Forward Together Moral Movement grew by connecting the state NAACP conference and its more than a hundred already implanted local branches with a newly fashioned coalition of organizations advocating for various causes and constituencies in state politics. This linkage could have strengthened liberal and Democratic Party politics across regions and urban-rural divides, but our analysis suggests that this has not happened in the electoral sphere.
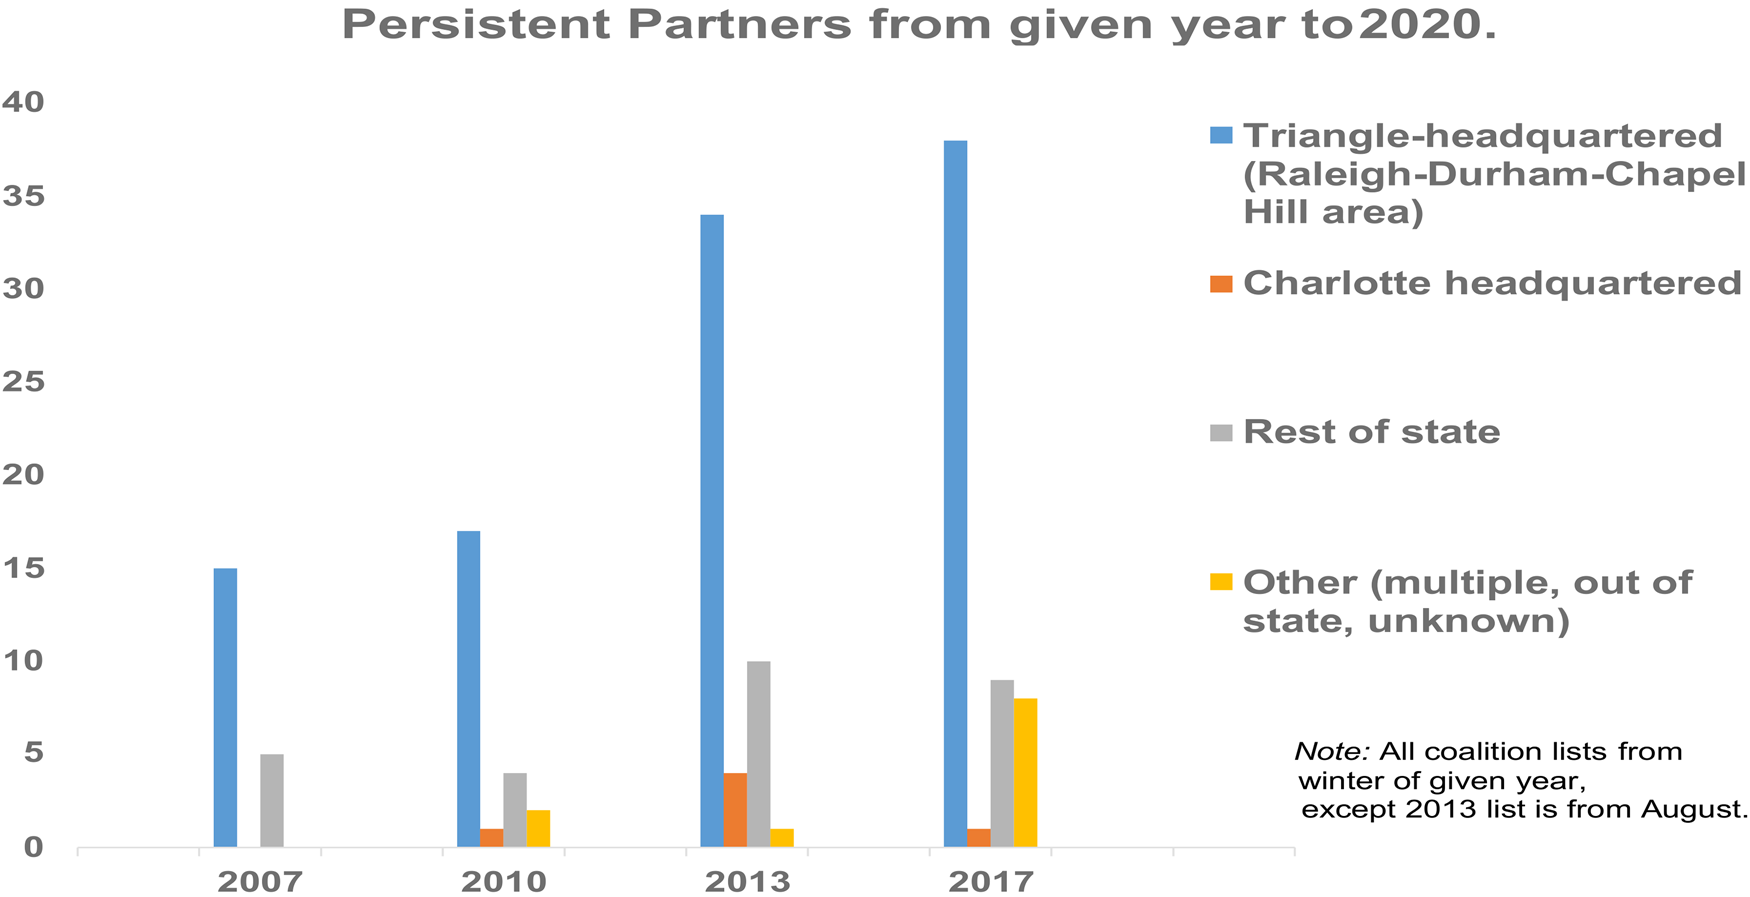
Earlier we tracked the growth of the NAACP-led coalition of left-leaning “partner” groups pledged to jointly cosponsor the annual HKonJ marches and petition the state legislature in Raleigh (see Figure 5). To learn more about this alliance, we gathered the addresses of groups that joined at various junctures. As Figure 6 shows, from the start and increasingly over the years, most coalition partners were headquartered in the Raleigh- and Durham-centered Research Triangle. A minority of partner groups were headquartered in secondary cities, and just a smattering (mostly NAACP branches, church congregations, and union locals) were based in nonurban areas. Even if some groups had branches or sponsored activities throughout the state, the HKonJ partnership had always been most densely networked in the Triangle.
Organizational Partners in the North Carolina NAACP's Advocacy and Annual March Coalition.
Sources: Author analysis of HKonJ partner organizations dated lists, accessed via Wayback archives of the state NAACP website (https://web.archive.org/web/*/https://naacpnc.org/).

By 2012–14, Forward Together efforts reached a new crescendo with swelling participation in the annual marches, media-oriented tours to stage rallies around the state, and nationally publicized civil disobedience sit-ins during the Moral Mondays campaign of 2013. Using social media sources, newspaper articles, and an interview with a knowledgeable leader active in 2014, we have been able to assemble rich locational data for several kinds of Moral Movement efforts, enabling probes of how those efforts relate to Democratic electoral fortunes.
One set of sources documented Moral Mondays protestors arrested during sit-ins at the General Assembly between April and July 2013. The Civitas Institute, a right-wing group, compiled profiles for 820 of the almost 1,000 arrestees, drawing from arrest records and other public sources. Summaries show that arrestees were 57 percent female, 86 percent white, and mostly older (57 percent above the age of 55). Many were active or retired ministers, professors, teachers, business owners, public-sector workers, and nonprofit employees; and at least four-fifths of identified arrestees were registered Democrats. Civitas also found organizational affiliations for 324 arrestees, indicating involvements with NAACP branches, unions, student groups, and civil rights groups—especially ties to organizations that were longtime partners in the Forward Together coalition. Last, home addresses available for most arrestees indicate that more than two-thirds came from the major metropolitan regions—about three-fifths from Triangle counties alone. Another 9 percent of arrestees hailed from eight additional counties with secondary cities, while just 20 percent came from nonurban counties. These arrestee data reinforce the picture of the Barber movement's strong reliance on progressive-minded metropolitan activists.
In the pivotal 2012–14 period, Reverend Barber also conducted statewide tours to publicize issues and visit NAACP branches—including a 27-city “Poverty Tour” in 2012 and a tour of twenty-six places across the state to extend the Raleigh Moral Mondays movement's visibility in 2013. Despite such travel, 46 percent of the stops and rallies were held in secondary-city or major metropolitan areas located in just eighteen of North Carolina's 100 counties. These findings comport with what we have learned about the Barber movement's stress on public moral persuasion, fostered by the sorts of high-profile media coverage likely in metropolitan and city venues.
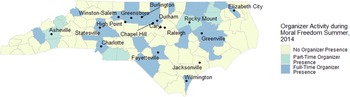
Most important for possible electoral impacts were efforts undertaken through the NAACP's 2014 “Moral Freedom Summer” campaign. After earlier efforts to counter GOP legislation had failed, and as the November 2014 elections loomed, the North Carolina movement briefly turned to field tactics by deploying full- or part-time paid organizers to many counties across the state. This effort had some similarities to those the Abrams alliance would later pursue in Georgia, but it differed because many of the young people recruited as organizers were deployed to counties other than those where they lived or went to college—and we have learned in interviews that deployments also depended on local NAACP chapter willingness to host an assigned organizer (and in at least one case a chapter refused to accept an organizer seen as too discordant in background). Paid Moral Freedom Summer organizers lived and worked in their adopted counties for several months, educating and registering voters and supporting local NAACP branch building.Footnote 63 This was the most consistent and geographically widespread voter registration effort the Barber movement had ever mounted, with full- or part-time deployments in thirty-nine of North Carolina's 100 counties—including in twenty-seven of eighty-two nonurban counties. Even so, organizing tilted toward urban counties, with full- or part-time organizers in seven out of eight secondary-city counties and in five of ten counties in North Carolina's three metropolitan clusters (see Figure 7). Notably, Barber alliance voter outreach was not explicitly tied to Democratic Party building, but instead embodied Reverend Barber's plan to “win by changing the conversation for every candidate and party” and educating “voters about how candidates have voted or committed to vote on issues that are part of our shared moral agenda.”Footnote 64
North Carolina Counties with Moral Freedom Summer Organizers, 2014.
Sources: North Carolina NAACP social media posts, confidential interview.

Moral Freedom Summer outreach did not achieve discernible electoral impacts. New voter sign-ups proved elusive, as a sympathetic reporter explained in a story about efforts in a poor, disproportionately Black rural county, where a young organizer got a polite response but signed up only a few new voters. This was in line with the reported bottom line that Moral Freedom Summer achieved only about 4,000 new registrations overall, far short of the trumpeted 50,000 goal.Footnote 65 Compared to Georgia, North Carolina already had relatively high levels of Black voter registration, because reforms in 2007 had enabled a record number of African American voters to sign up to vote for Barack Obama both times.Footnote 66 As of 2014, many voters of color surely remained unregistered, but the bigger challenge across the state was persuading lower-income, younger, and Black and Hispanic North Carolinians to turn out to vote for Democrats in elections. Yet when November 2014 rolled around, statewide turnout was low and incumbent Democratic Senator Kay Hagan lost to her GOP challenger. Hagan remained just as reliant as Democrats before her on votes from the Raleigh- and Durham-centered Research Triangle; she attracted smaller two-party Democratic vote shares compared to 2012 in both Piedmont Triad and secondary-city counties—the very areas where Barber events and organizing had been most intensely focused.Footnote 67
Our statistical analyses paint the same picture. Using weighted least squares regression, we probed for significant associations between Barber organizing and changes in Black turnout and Democratic margins between 2012 and 2014 in the ninety North Carolina counties beyond the major metropolitan areas of the Research Triangle, Charlotte area, and Piedmont Triad.Footnote 68 We weighted our models using logged 2012 county-level population estimates to account for intercounty variation in population size. We focused on changes between 2012 and 2014 because these were the pivotal years when Barber and his affiliated organizations ventured into seeking to achieve moral goals by mobilizing voters. Secondary-city and nonurban counties are our focus, because we are interested in discerning associations between statewide organizing—which necessarily includes organizing beyond major metropolitan areas—and our outcomes of interest.
We measured our county-level outcome variables by calculating the percent change between Black turnout in 2012 and 2014 and taking the difference between Democratic two-party vote shares for top-of-the-ticket races in 2012 and 2014.Footnote 69 Our independent variables of interest captured the presence of Forward Together Moral Movement organizing; specifically, we used binary indicators for whether counties hosted Moral Freedom Summer organizers in 2014 or hosted Forward Together tour events in 2012 and 2013. The models also controlled for demographic differences between counties, which we captured with 2012 American Community Survey data on county population densities, median incomes, higher education percentages, and Black population percentages.
We did not find statistically significant positive associations between Moral Movement events or organizer deployments and changes in Black turnout or top-of-the-ticket Democratic margins between the 2012 and 2014 elections. As a robustness check, we reran our model using ordinary least squares, excluding the eight secondary-city counties, and examining the period from 2010 to 2014—so as to compare two midterm elections—and in each case found similar results. We also did not find statistically significant associations between Moral Movement organizing and longer-term electoral impacts from 2012 to 2016 and 2012 to 2020. Appendix A presents the base model, and the supplementary material describes these alternative specifications.
Finding suggestive evidence of longer-term impacts would have been surprising because the North Carolina NAACP's summer 2014 foray into electorally relevant field organizing was not sustained for the multiple years it took Abrams's coalition to entice more participation from lower-income, especially minority voters. Instead, after 2014 the Forward Together coalition turned back to urban protests and annual marches pushing for their longstanding progressive policy menu. This may have happened in part because the first field efforts proved unfruitful; and it may have also been the case that Reverend Barber (as he himself recounts in his various books) never developed the sort of big-donor ties we have documented for Stacey Abrams in Georgia. National Democrats, meanwhile, continued their usual pattern of pouring short-term mobilization resources into North Carolina, hoping, but failing, to tip the scales in successive presidential and Senate contests.
Another reason the Barber movement reverted to moral pressure and advocacy strategies may be that the political opportunity structure they faced in Raleigh became slightly more welcoming. In late 2016, Tar Heel Democrats scored one important win as their gubernatorial candidate Roy Cooper eked out a miniscule margin of victory over GOP Governor Pat McCrory. Activists and some observers argue that GOPer McCrory was weakened by Moral Movement protests against his decision to sign into law a nationally controversial antitransgender “bathroom bill” passed by the GOP legislature.Footnote 70 The Forward Together coalition's emphasis on mutual support for various issue causes may have helped to blunt right-wing anti-LBGTQ appeals to Black churchgoers. However, more skeptical observers point to simmering controversies over tolls on an expressway north of Charlotte as the reason McCrory lost more than enough votes in those suburbs to account for Cooper's 10,277-vote margin of victory.Footnote 71 If the Moral Movement plausibly did make a difference in that very close 2016 governor race, we might conclude that a publicity-oriented, mostly metropolitan-centered movement can indeed influence elections by “changing the public conversation.” More basically, whatever tipped the close race, the presence of a Democratic gubernatorial administration after 2016 meant that many advocacy groups in the Forward Together coalition could resume making demands for new administrative and regulatory rulings from power-holding state officials.
No one can conclude, however, that the Forward Together Moral Movement has succeeded in reorienting state government to meet the needs of Black or poor North Carolinians. The ultra-right Republicans who still control the Tar Heel General Assembly have remained unmoved, and Barber activists have been disappointed that Governor Cooper is usually unwilling to meet their criminal justice demands or champion redistributive policy priorities.Footnote 72 Meanwhile, Cooper's relatively good electoral fortunes across the urban-rural divide have not transferred to other statewide Democratic contenders, who are increasingly reliant on metropolitan and college-degreed constituencies that are usually not quite enough to eke out victories. Tellingly, during the very years after 2010 when the Barber-led coalitions gained strength and visibility in North Carolina, Black registration rates and voter turnout rates stalled or receded, especially (as figures in the supplementary material track) in nonurban areas with the highest proportions of eligible Black voters. Democratic vote shares also suffered in key areas.Footnote 73 Whether registered to vote or not, many Black North Carolinians have not received sustained messaging that Democrats are the alternative to the “immoral” extremists so eloquently condemned by Barber and the state NAACP's many networked organizational allies.
4.2 Boosting Democratic Turnout in Georgia
Especially since 2014, social justice campaigners in Georgia's Abrams-orchestrated network have taken a field-organizing approach to empowering Black and lower-income people—and electoral gains for Democrats have paralleled these efforts. In Georgia, as in North Carolina, Black vote shares for Democrats surged in the Obama contests of 2008 and 2012, but thereafter receded. Only since 2014 have both registration levels and turnout moved upward for voting-age Black Georgians—contributing to improved Democratic prospects. The key issue is whether these trends are plausibly specifically related to the new voter outreach undertakings encouraged by the Abrams network.
We should be clear about Georgia electoral trends, which we agree are important but do not ourselves explore in depth. Many pundits have pointed out, accurately, that the biggest swings toward top-of-the-ticket Democratic candidates in Georgia have come among Trump-averse voters in the suburban counties surrounding Atlanta.Footnote 74 Likewise, the suburban swing has been helped by Abrams's appeal as a gubernatorial candidate in 2018 as well as her network's continuing outreach to suburban voters of all races. Setting aside these shifts, we focus here on the rest of the state beyond the nine counties that make up and surround Atlanta. This makes sense for two reasons: Democrats cannot quite win statewide with only votes from the Atlanta region.Footnote 75 Unusually and remarkably, Abrams—although herself from Atlanta—has always prioritized statewide outreach—including in recent years to nonparticipating potential Black voters in secondary cities and small-town and rural counties.
From the end of 2013, Abrams network projects did more voter outreach, but not very successfully at first. Although Abrams has never fully acknowledged it, New Georgia Project efforts leading into November 2014 did not come close to meeting their declared goal of newly registering at least 120,000 voters. Independent observers estimate that at most about 46,000 were actually signed up by then, with perhaps 18,000 more added to the rolls soon afterwards.Footnote 76 In terms of attaining its original bold goals, NGP's first big push was only modestly more successful than simultaneous Moral Freedom Summer efforts in North Carolina—and neither made any immediate electoral difference.
Still, the 2014 Democratic Senatorial debacles in both states mark an analytically interesting fork in the road, because as the North Carolina Barber coalition thereafter pulled back from sustained voter field outreach, the Georgia Abrams network learned from early mistakes and went on to launch waves of revised and expanded efforts. Tellingly, much of NGP's 2014 work was outsourced to paid consultants favored by the national Democratic Party.Footnote 77 After the election, NGP leaders figured out the shortcomings of that approach, allowing the Abrams network to refocus toward raising resources and training community organizers for sustained, in-state voter contacting. Their efforts included new projects to reach Asian Americans and Hispanics as well as outreach to African Americans in regional cities and surrounding rural counties. Such efforts geared up for 2016, gained steam during Abrams's run for governor in 2017–18, and then, crucially, did not stop. In North Carolina, Reverend Barber resigned his NAACP post in 2017 to move “onto the national stage” and lead the Poor People's Campaign advocacy organization with operations in multiple states.Footnote 78 Barber's choice to “go national” made sense given that his favored organizing approach involves coalition-building and public protests to garner media attention. In contrast, Stacey Abrams decided to delve more deeply into community-level voter engagement in Georgia, even after her 2018 gubernatorial campaign elevated her national profile and prompted invitations to move into national civic or electoral politics. Abrams's decision to remain focused on expanding her state's potentially Democratic electorate was fateful for what would later unfold in 2020–21.Footnote 79 When it comes to the hard work of shifting political power toward the previously disengaged and unorganized, persistence matters.
Midcourse corrections after 2014 likely enabled Georgia's in-state organizers to hit future voter registration benchmarks, but registration was far from the only objective, because people must be repeatedly encouraged to actually submit ballots for each election, following shifting procedures as Republicans repeatedly change the rules.Footnote 80 Abrams-inspired organizing therefore stressed weaving continuous, community-level ties. From a bird's eye perspective, this approach seems to have paid off. As Figure 8 shows, Black turnout shares as a percentage of the state voting populations of North Carolina and Georgia tracked one another closely through 2014 (with Georgia's absolute share higher because African Americans are about 30 percent rather than 21 percent of the eligible voter population). But after 2014, the trajectories have diverged, as Black Georgians became considerably more likely to go to the polls and made up a growing share of the overall state electorate.
Georgia and North Carolina Black Turnout as Percent of Voting Age Citizens for Statewide Top-of-Ticket Races, 2008–2020.
Note: Citizen voting-age population estimates are available from 2009 to 2019; 2008 and 2020 estimates are accordingly approximated using figures from 2009 and 2019, respectively.
Sources: Citizen Voting Age Population estimates from the Census Bureau: https://www.census.gov/programs-surveys/decennial-census/about/voting-rights/cvap.html. Black turnout statistics from the North Carolina State Board of Elections’ Historical Election Results Data and the Georgia Secretary of State's Voter Turnout by Demographics data: https://www.ncsbe.gov/results-data/election-results/historical-election-results-data, https://sos.ga.gov/index.php/Elections/voter_turn_out_by_demographics.

The first full-blown test came in the near-miss Abrams run for governor in the 2018 Democratic primary and general election. Door-knocking for that campaign started “more than a year before Election Day,” including in secondary cities and nonurban areas.Footnote 81 Although Abrams did not quite match raw Obama-era vote totals in many key places, not only were new voters registered, but also the Abrams network demonstrated that it could boost the nonwhite share of the statewide electorate to 40 percent.Footnote 82 As political scientist Andra Gillespie concludes, that gubernatorial campaign showed that Southern Democrats do not have to keep nominating “centrist white candidates,” because Black candidates can become fully competitive by engaging new voters.Footnote 83
Two years later, Joe Biden eked out a narrow presidential win over Trump in Georgia, claiming modestly improved vote shares from suburbanites of all races. Because the 2020 election season unfolded amid the Covid-19 pandemic, both media accounts and our research interviews indicate that Democratic voter outreach in Georgia (as well as nationwide) relied more heavily than originally planned on media and virtual contacts—and this may help explain why Biden's Black vote share was not much better than Abrams's in 2018. Still, Abrams-encouraged Democrats did what they needed to do to secure Georgia for Biden and force two Senate runoffs.
By all available indications, Democratic victories in the January runoff were the moment when the previously built Abrams network, centered in extraparty nonprofit organizations, bore fruit—by facilitating extraordinary Democratic turnout, especially by Black voters.Footnote 84 Georgia runoffs usually see sharp turnout drops, with Democrats falling off precipitously and thus allowing Republicans to improve their margins in overtime.Footnote 85 But January 2021 brought a momentous switch. Although GOP turnout carried over from November at an impressive 89.2 percent rate—historically much more than enough to win—Democratic turnout carried over at an unprecedented 92.5 percent rate. For Warnock and Ossoff, even more than for Biden in November, victories were grounded in very strong statewide Black voter engagement beyond as well as within the greater Atlanta metroplex.
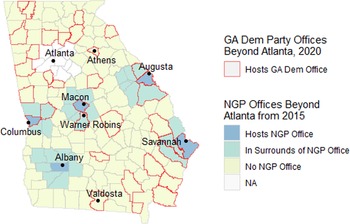
By all accounts, from November 2020 to January 5, 2021, all-hands-on-deck voter contacting occurred—especially through many aligned nonprofits that had been funded or encouraged by the Abrams network and were now ready to magnify, extend, and deepen efforts mounted by the state Democratic Party working with the Raphael Warnock and Jon Ossoff campaigns. First implanted beyond as well as within the Atlanta region in 2015, the NGP's field outreach operations worked in tandem with allied nonprofit and community organizing groups including Black Voters Matter, 1000 Women Strong, the Albany Voters Coalition, Southerners on New Ground, the Southwest Georgia Project for Community Education, the Working Families Party, and a coalition of grassroots groups called ProGeorgia.Footnote 86 For the 2021 Senate runoffs, organizers and volunteers threw off previous pandemic limits and went door to door while also phone banking and engaging on social media. We know that NGP worked not just with allied political operations but also with community-based associations such as those linking Black churches. Outreach to rural areas also took creative forms, such as activating networks of Black funeral home directors in southwest Georgia.Footnote 87 Demographics did not change from November to January, but the intensity of on-the-ground field organizing through previously implanted NGP and community networks certainly did.
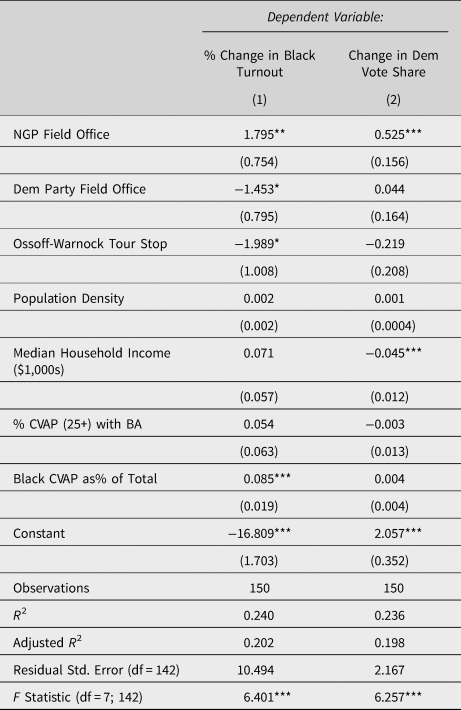
We used weighted least squares regression models comparable to those we described earlier for North Carolina to probe possible associations between organizing activity and shifts between November 2020 and January 2021 in Black turnout and top-of-the-ticket Democratic margins. For these models, our outcomes of interest were the percent change in Black turnout between 2020 and 2021 and the difference in two-party Democratic vote share between Biden's presidential election in 2020 and Warnock's senatorial election in 2021. These variables were measured at the county-level for the 150 Georgia counties beyond Atlanta and its suburbs.Footnote 88 Counties were weighted by logged 2019 population estimates to account for intercounty variation in population.
Our independent variables are county-level indications of both runoff-specific organizing and previously well-established voter outreach capacities stretching beyond the greater Atlanta region (mapped in Figure 9). For runoff-specific outreach variables, we used the Wayback Machine to identify the places candidates Ossoff and Warnock visited on their most-publicized statewide tours.Footnote 89 Likewise, we know where the Democratic Party of Georgia opened field offices for that stretch.Footnote 90 For previously well-established field organizing capacities, our best indications come from the New Georgia Project's “2015–16 Prospectus” prepared for appeals to major donors at the time when the project revamped its plans and capacities following the 2014 shortfalls. This document describes plans for sustained voter outreach from regional field offices headquartered in or near all but two of Georgia's secondary cities. From extensive media searches and job listings, as well as confidential interviews, we know that all the regional NGP field headquarters have remained active hubs, doing outreach in surrounding nonurban counties as well as in the home counties. Accordingly, we designated counties that either house regional NGP offices or are geographically adjacent to them as having an NGP presence. This measure is a plausible proxy for the distinctive Abrams-network ground-level outreach that built on capacities in place well before the 2020–21 runoff sprint. We also controlled for demographic differences between counties in population density, median per capita income, higher education shares, and Black population shares, all measured by the American Community Survey in 2019. The results of the models presented in Table 2 are consistent when we used ordinary least squares, excluded the nine counties with secondary cities, and considered differences in Democratic vote share between Biden's 2020 election and Ossoff's 2021 election (see supplementary material).
Democratic Party and New Georgia Project Offices Beyond Atlanta during the 2021 Georgia Senate Runoffs.

Outreach Beyond Atlanta and Changes in Black Turnout and Democratic Margins in the 2021 Georgia Senate Runoffs

Note: Models present weighted least squares regressions investigating associations between organizing activity in Georgia counties beyond the Atlanta metroplex and two dependent variables: percent changes in Black turnout between the 2020 general and 2021 runoff elections, and changes in Democratic margins between Biden's presidential race and Warnock's senatorial runoff. Organizing measures come from authors’ searches of web pages related to the New Georgia Project and the Democratic Party of Georgia. County-level data on Black turnout and Democratic vote share are from the Georgia Secretary of State. The variance of observations is weighted by log county population from U.S. Census Bureau five-year American Community Survey (ACS) estimates in 2019. Data on population density per square mile, median household income, higher education shares, and Black population shares are from five-year ACS estimates in 2019, the most proximate year with data availability. *p < 0.1; **p < 0.05; ***p < 0.01.
The results in Table 2 indicate that NGP organizing beyond the greater Atlanta metroplex is associated at the α = 0.05 level of statistical significance with factors contributing to Democratic victories in January 2021. We found positive relationships between counties hosting or being in proximity to NGP regional field offices and our two outcomes of interest—namely, Black turnout retention and Democratic vote share changes from November 2020 to January 2021. Holding all other covariates constant, the presence of an NGP field office within or nearby a nonmetropolitan county is associated with a 1.8 percent increase in Black turnout retention and a 0.5 percent increase in Democratic vote share between the 2020 general and 2021 runoff elections.
By contrast, we did not find statistically significant associations (at the α = 0.05 level) between hosting a Democratic Party of Georgia field office for the runoff or hosting a December 2020 stop from the Ossoff or Warnock campaigns and changes in Black turnout or top-of-the-ticket Democratic margins. If anything, Democratic Party field office locations are slightly negatively associated with Black turnout retention between the 2020 general and 2021 runoff elections. One plausible explanation for this finding is that most Democratic Party field offices beyond Atlanta were installed in places with lower shares of Black eligible voters, and very few nonurban Democratic outposts were in counties with or near NGP headquarters—perhaps signaling an informal division of labor between the party and allied nonprofits. We have also obtained data on Georgia Democratic Party operations for the runoffs that show heavy reliance on out-of-state organizers who were usually much less embedded locally than NGP operatives. Party outreach may have been more focused on whiter areas, while nonprofit efforts by the NGP and others were more about engaging potential Black voters.
The opposite directions of the associations between the presence of party and nonparty organizations and Black turnout retention may be less surprising that it seems at first glance. Precisely because Abrams-inspired community-level voter engagement since 2015 has stressed Black potential voters in nonmetropolitan areas as well as the Atlanta region, it has gone beyond usual places for short-term campaign organizing. Our results suggest that such Abrams-orchestrated outreach by networked nonprofits aligned with but formally separate from the Democratic Party may well have furthered Georgia activists’ hopes to tip the arc of history through social justice. Many qualitative and quantitative signs point to the conclusion that this happened specifically by facilitating more robust and persistent Black voter engagement statewide—including regional cities and nearby rural counties where people's concerns and levels of customary political awareness are worlds apart from those in and around Atlanta.
5. Conclusion
Over the last fifteen years, remarkable statewide movements for racial and economic justice grew in North Carolina and Georgia under the guidance of two galvanizing Black leaders prepared to emphasize statewide civic efforts—not just local-metropolitan organizing. In North Carolina, Reverend Barber took charge of an NAACP conference and network of branches and proceeded to link that federation to an alliance of already existing, mostly professionally directed nonprofit, nonpartisan policy organizations. The interlinked organizations involved in North Carolina's social justice movement were previously well-established outside of North Carolina Democratic Party organs, with some overlap of participants. Georgia was not as densely populated with professional nonprofits or statewide NAACP branches, leaving space for a new civil rights champion to build outward from the legislature—first by assembling organizational capacity for Democrats and then by helping nonprofit organizations to register, educate, motivate, and turn out actual voters. Of course, nothing predetermined that a Stacey Abrams would arise to lead such a network. But when biographical ambition met partisan crisis, the Georgia Democratic latticework offered a statewide framework, and the Peach State's demography, including Black residents living beyond as well as near Atlanta, offered a previously underengaged, large constituency of Black citizens who potentially could be engaged to support Democrats visibly committed to social justice reforms.
Contrasting visions of how to build power have animated these reform campaigns. Both before and after its electoral emphasis in 2014, Barber's movement has primarily used marches, protests, and public events to attract media attention, in order to move public opinion and thereby press politicians and leaders of all stripes to aid the poor and minorities by adopting a progressive 14-point policy agenda. As sociologist Kenneth Andrews explains, the Barber movement deploys nonpartisan Biblical rhetoric as the best way “to reclaim the religious high ground” and “blunt the fact that the movement's demands are uncompromising.”Footnote 91 In Georgia, by contrast, Abrams herself and the various organizations and alliances she and her allies encouraged hold that winning elections and changing officeholders are critically important to redirecting government. Although Abrams does not say so outright, the efforts she has led presume that voter outreach and education can be more effective for enacting electoral change over time than mounting big public protests. Formally nonpartisan civic organizations and policy issues matter in the Abrams constellation, just as they do in the Barber movement, but drawing in new voters is crucial. As they seek to newly empower African Americans and other minorities and draw previously uninvolved or erratic voters to the polls, Abrams and her nonprofit allies clearly align with mainstream-liberal Democratic Party campaigns. Their messages and outreach are bold, sustained, and focused on articulating broadly popular partisan goals.
Our findings suggest that the Abrams approach has made more headway in shifting the balance of political power and possibilities. In contrast to what many political activists and some social movement scholars presume, if the goal is to engage formerly excluded or nonparticipating minority citizens and reorient state government, it can pay off to align explicitly civic groups rooted in specific communities with a reformed, well-resourced state Democratic Party and associated candidate campaigns—especially if leaders keep a majoritarian focus, persist for years, and learn from defeats and setbacks along the way. At the same time, however, we need to stress that more than just politician-as-usual efforts are involved here: Persuading nonvoters or inattentive voters into not just registering to vote but also learning ever-changing ballot rules and actually turning out for nonpresidential as well as presidential contests is hard, expensive, long-term work. It does not happen overnight or for just one cycle, even though national party leaders and donors often stress short-term wins. Movement effects in elections are likely to be bigger and more enduring if organizational capacities are persistently deployed on the ground and work through familiar community networks. Bursts of organizing around elections are unlikely to suffice.
This article contributes to scholarship on American political development not only by applying longstanding concepts in the field to illuminate a pivotal contemporary U.S. electoral watershed, but also by showing how detailed geographically coded organizational data can make broad-brush arguments about institutional processes more empirically precise and causally tractable. We have deployed newly collected bodies of organizational data to show how and why these two statewide social justice movements ended up pursuing the tactics that they did, and to what effect—especially in the most recent period since 2014 when both movements responded to blocked avenues in state government by trying to engage downscale voters to shift election outcomes. By tracking and geocoding years of organizational efforts, we have cast new light on movement capacities and trajectories and helped make better sense of the 2020 and 2021 election outcomes that surprised so many pundits. When research explores the electoral impacts of movement organizing, mapping where civic and political organizations do their work matters, because the U.S. electoral and governing systems are federations, where clout and representation grow from the bottom up.
Given what we have found, it is not surprising that, by now, many Democrats and civil rights activists in North Carolina and beyond are trying to learn lessons from recent victories in Georgia. In North Carolina, reformers are mounting a New North Carolina Project that can reach large pockets of rural and urban African Americans and other racial minorities who do not vote regularly or ever.Footnote 92 Democratic National Committee staffers claim to be copying the Abrams organizing model. Voter contacting has also become a more important part of Reverend Barber's transpartisan moral advocacy work through the national Poor People's Campaign he leads, which has sponsored “voter outreach” efforts to contact low-income, irregular voters in sixteen states and encourage them to “get involved with a movement that votes.”Footnote 93 New or intensified efforts along these lines may bear fruit, but our analysis also suggests that it could take time, because the Georgia outcomes in 2020 and 2021 had years of organizing behind them.
Although we believe our research illuminates recent electoral trajectories, we do not proclaim any settled trends. Elections in Georgia and North Carolina remain on the knife's edge and could go either way in coming cycles—especially because Republicans and highly mobilized, predominately white activists are looking for ways to reverse Georgia's Democratic gains and prevent imitations elsewhere. Given the overall slack in U.S. electoral participation, even slight shifts in citizen engagement—through new mobilizations or backlashes against previous mobilizations—can turn election outcomes from losses to wins, from victories to defeats, leading to 180-degree policy shifts in the current polarized environment.
Despite the fact that we cannot predict what will happen next in Georgia or North Carolina, we believe our examination of movement-party trajectories in these key states has added insights beyond instant accounts. Most fundamentally, this historical, institutionally situated, and organizationally operationalized comparison of the social justice campaigns orchestrated by Barber and Abrams highlights reasons for—as well as the high stakes of—sustained movement tactics as well as choices at key junctures about alignments with political parties and campaigns. In the current era of U.S. politics, civic movements on the left and right that frankly and persistently align with revamped and reenergized political parties seem to make more headway than movements devoted to orchestrating protests outside or “above” partisan politics. That may be especially true for social justice campaigns like the two we have examined here, whose overriding purpose is to expand citizen participation, produce sustained shifts in political power, and leverage government to address the needs of long-marginalized citizens.
Supplementary material
To view supplementary material for this article, please visit https://doi.org/10.1017/S0898588X22000050
Acknowledgments
For helpful comments and suggestions on earlier drafts of this manuscript, we thank Anna Duffy, Dana Fisher, Ellen Fitzpatrick, Marshall Ganz, Leah Gose, Hahrie Han, Ira Katznelson, Robert Kuttner, Sally Marsh, Mac McCorkle, Suzanne Mettler, Jennifer Oser, Lara Putnam, Robert Putnam, Daniel Schlozman, Michael Skocpol, William Skocpol, Sidney Tarrow, and Margaret Weir. We are also grateful for feedback from anonymous reviewers and from participants at the 2021 American Political Economy Research Conference. Of course we have drawn insights in more general ways from a much wider range of colleagues and students; if we overlooked any who shared specific reactions to this analysis, we apologize. Finally, we are especially grateful to our confidential interviewees, who took the time to speak with us about their important work.
Appendix A: Outreach Beyond North Carolina Metropolitan Areas and Changes in Black Turnout and Democratic Margins, 2012–2014