



1. Introduction
Dynamical encounters between stars and black holes (BHs) in dense stellar clusters (SCs) such as YSCs, can lead to a wide variety of outcomes. These range from the formation of detached binaries (e.g., the so-called Gaia BHs; El-Badry et al. Reference El-Badry, Rix and Cendes2023; Gaia Collaboration et al. 2024; Rastello et al. Reference Rastello, Iorio and Mapelli2023; Marín Pina et al. Reference Marín Pina, Rastello and Gieles2024; Iorio et al. Reference Iorio, Torniamenti and Mapelli2024) to disruptive events such as micro-TDEs. The latter occur when a star (of mass
 $m_*$
and radius
 $r_*$
) passes within the tidal radius (
 $r_{\rm t}$
) of a BH (
 $r_{\rm t} \simeq r_* \left( {m_{\rm BH}}/{m_*} \right)^{1/3}$
) and is partially or fully disrupted (Rees Reference Rees1988; Perets et al. Reference Perets, Li and Lombardi2016). Micro-TDEs can be viewed as the scaled-down counterparts of tidal disruption events (TDEs) involving super-massive BHs, and they may give rise to luminous, multi-wavelength electromagnetic (EM) flares as well as bursts of GW (Komossa Reference Komossa2015; Toscani et al. Reference Toscani, Rossi and Lodato2020; Toscani et al. Reference Toscani, Lodato and Price2022; Toscani et al. Reference Toscani, Broggi and Sesana2025). Previous analytical and numerical work suggests that micro-TDEs may occur at non-negligible rates, often triggered or enhanced by binary or higher-order dynamical interactions (Perets et al. Reference Perets, Li and Lombardi2016; Rastello et al. Reference Rastello, Mapelli and Di Carlo2020; Rastello et al. Reference Rastello, Amaro-Seoane and Arca-Sedda2019; Kremer et al. Reference Kremer, Lu and Piro2021; Ryu et al. Reference Ryu, Perna and Pakmor2023). These events could represent an important class of energetic transients, potentially linked to ultra-long gamma-ray bursts and fast blue optical transients (Perets et al. Reference Perets, Li and Lombardi2016; Kremer et al. Reference Kremer, Lu and Piro2021; Kremer et al. Reference Kremer, Lombardi and Lu2022; Kremer et al. Reference Kremer, Mockler and Piro2023).
2. Methods
We performed direct N-body simulation of a sample of YSCs modeled with masses
 $10^3$
-
 $10^5\,M_\odot$
, half-mass radius and density based on observed Galactic clusters (Krumholz et al. Reference Krumholz, McKee and Bland-Hawthorn2019). Stellar and binary populations were sampled from Kroupa (Reference Kroupa2001) and Moe and Di Stefano (Reference Moe and Di Stefano2017), and initialized using limepy (Gieles and Zocchi Reference Gieles and Zocchi2015) King models (
 $W_0=7$
). We simulated 3600 realizations at both low (
 $Z=0.0002$
) and Solar (
 $Z=0.02$
) metallicity, including primordial and dynamically formed binaries (see Rastello et al. Reference Rastello, Iorio and Gieles2025 for more details.). Cluster evolution was followed with the code PETAR (Wang et al. Reference Wang, Iwasawa and Nitadori2020), to which we implemented a micro-TDE prescription (removing stars passing within the tidal radius of a compact object, with 10% of their mass accreted onto the BH, see appendix A in Rastello et al. Reference Rastello, Iorio and Gieles2025), while stellar evolution was treated with the updated BSE framework (Hurley et al. Reference Hurley, Tout and Pols2002; Banerjee et al. Reference Banerjee, Belczynski and Fryer2020). All clusters were evolved in a Galactic potential (Bovy Reference Bovy2015) on circular orbits and integrated for
 $\sim 1.5$
Gyr.
3. Micro-TDEs pathways
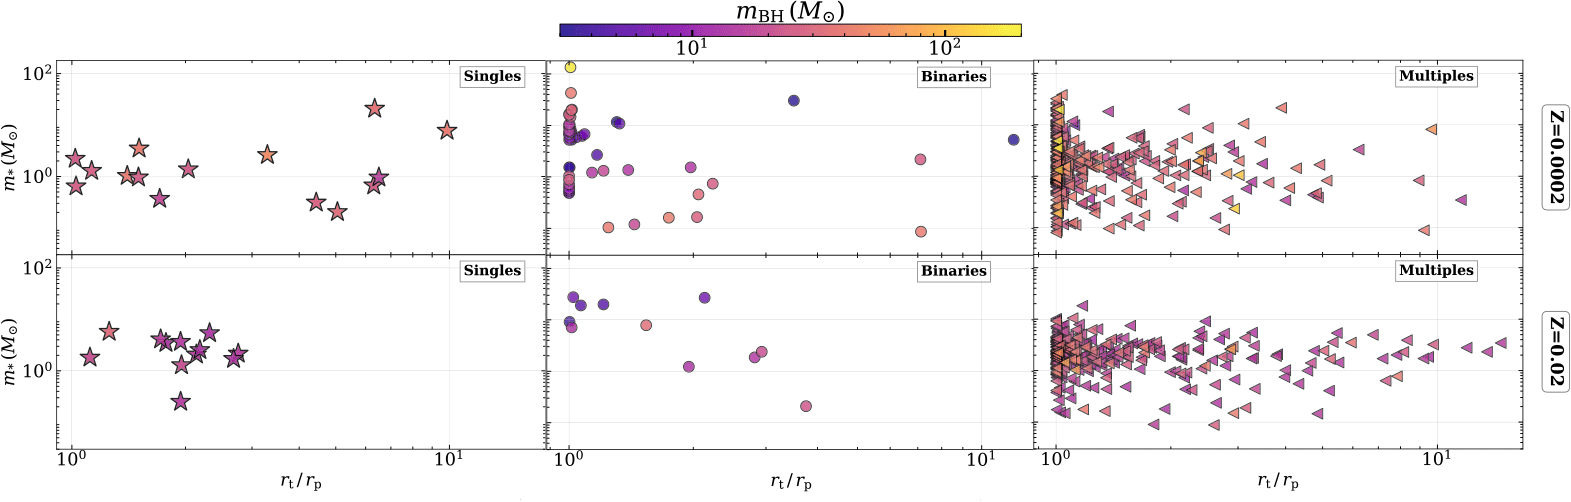
Micro-TDEs in YSCs are produced through three main pathways: i) single encounters, ii) binary-mediated interactions, and iii) few-body multiple encounters. Single events are rare (
 $\sim 3$
%), occurring when a star and a BH approach on a parabolic orbit (Fig. 1, left panel), typically occurring in dense regions (40% events in within cluster cores). At
 $Z=0.0002$
, BHs are more massive (17-
 $52\,{\rm M}_\odot$
), producing deeper encounters (
 $\beta \sim 1$
-10), whereas at Solar metallicity they are lighter (13-
 $31\,{\rm M}_\odot$
) and less penetrating events occur (
 $\beta \sim 2$
-3). Binary-mediated micro-TDEs (Fig. 1, central panel) contribute only
 $\sim 7$
% of the total, mostly (
 $\sim 82$
%) in metal-poor clusters. They occur either through binary hardening during dynamical encounters or stellar expansion during binary evolution. At
 $Z=0.0002$
, they involve a wide range of BH (3-
 $170\,{\rm M}_\odot$
) and stellar (MS and giant) masses (
 $0.1$
-
 $134\,{\rm M}_\odot$
). At Z=0.02, the systems are lighter (BHs: 4-
 $35\,{\rm M}_\odot$
, stars:
 $0.2$
-
 $27\,{\rm M}_\odot$
). Most binary-mediated micro-TDEs have
 $\beta \approx 1$
and originate from primordial binaries undergoing common envelope or mass transfer episodes. The vast majority of micro-TDEs in YSCs (
 $\sim 90$
%) occur during few-body interactions involving three or more objects (85% at low-Z, 90% at Z=0.02; (Fig. 1, right panel). At
 $Z=0.0002$
, disrupted stars are mainly MS (83%), with smaller fractions of giants (8%), naked He stars (7%), and WDs (0.5%); BHs range from 3 to
 $138\,{\rm M}_\odot$
. At Z=0.02, MS stars dominate even more strongly (98%), while giants (0.9%) and WDs (1.1%) are rare; stellar masses span
 $0.09$
-
 $18\,{\rm M}_\odot$
and BHs 11-
 $75\,{\rm M}_\odot$
. Nearly all encounters (
 $\gt99$
%) occur on highly eccentric (
 $e \sim 0.99$
) orbits.
Distribution of penetration factor (
 $r_{\rm{t}}/r_{\rm{p}}$
) and star masses (
 $m_{*}$
in M
 $_{\odot}$
) of micro-TDEs occurring during single (left panels), binary mediated (central panels) and multiple encounters (right panels) for
 $Z = 0.0002$
(top panels) and
 $Z = 0.02$
(bottom panels). The colormap shows the BH masses (
 $m_{\rm{BH}}$
in M
 $_{\odot}$
).

4. Micro-TDEs efficiency & Rates
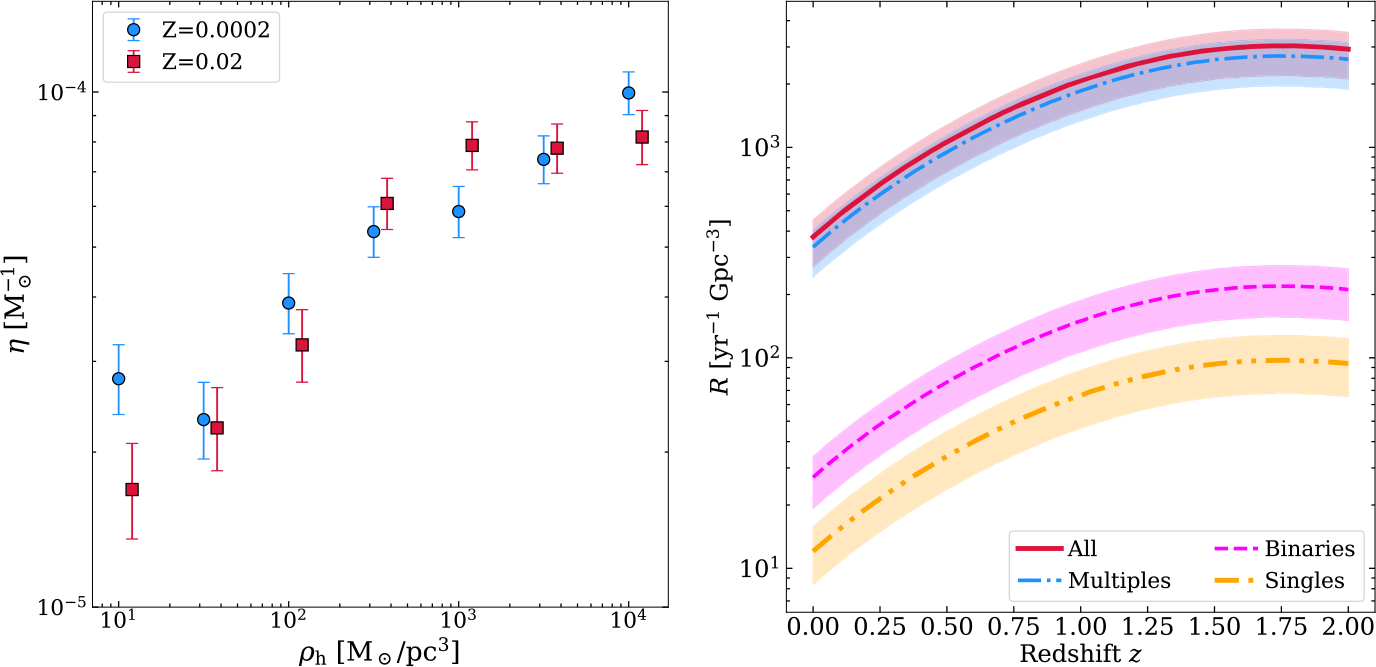
We find a global production efficiency
 $\eta$
(i.e. the number of micro-TDEs per unit stellar mass) in YSCs of
 $\eta \approx 5 \times 10^{-5}\,\mathrm{M}_\odot^{-1}$
. The distribution (Fig. 2, left panel) shows a strong dependence on cluster initial density but is independent of metallicity. From the derived efficiency, we estimated the comoving event rate density (see Eq. 4–6 in Rastello et al. Reference Rastello, Iorio and Gieles2025) as
 $R(z) = \eta f_{\rm SF,SC}\, \rho_{\rm SFRD}(z)$
where
 $f_{\rm SF,SC}$
is the fraction of star formation occurring in clusters (Lada and Lada Reference Lada and Lada2003; Kremer et al. Reference Kremer, Lu and Piro2021), and
 $\rho_{\rm SFRD}(z)$
is the cosmic star formation rate density (Madau and Fragos Reference Madau and Fragos2017). The total volumetric rate of micro-TDEs is therefore estimated to rise from 350-450 Gpc
 $^{-3}$
yr
 $^{-1}$
at
 $z=0$
up to 2000-3000 Gpc
 $^{-3}$
yr
 $^{-1}$
at
 $z=2$
, with the majority of events originating from multiple dynamical encounters. Accordingly, the number of expected events per year rises from just a few within the local Universe (
 $z \lt 0.05$
, approximately 200 Mpc) to as many as
 $10^5$
out to redshift
 $z = 1$
.
Micro-TDE production efficiencies,
 $\eta$
, as a function of initial cluster density
 $\rho_{\rm h}$
for
 $Z = 0.0002$
(blue) and
 $Z = 0.02$
(red) (left panel). Micro-TDE volumetric rates as a function of redshift for each channel (solid lines indicate median rates, while shaded bands the 68% credible intervals).

5. EM and GW Detectability
By combining the predicted rates we assessed the detectability of micro-TDEs with current and future surveys as Zwicky Transient Facility (ZTF) at Palomar Observatory (Graham et al. Reference Graham, Kulkarni and Bellm2019), Legacy Survey of Space and Time (LSST) at the Vera C. Rubin Observatory (Ivezić et al. Reference Ivezić, Kahn and Tyson2019), and Ultraviolet Transient Astronomy Satellite (ULTRASAT) (Shvartzvald et al. Reference Shvartzvald, Waxman and Gal-Yam2024) with the wind-reprocessed emission models of Kremer et al. (Reference Kremer, Mockler and Piro2023). These models yield peak luminosities in the range
 $10^{40}$
-
 $10^{43}\,\mathrm{erg\,s^{-1}}$
. We find that LSST is the most promising instrument to unveil the micro-TDE population in YSCs, expecting to detect from tens up to several tens of thousands of micro-TDEs per year.
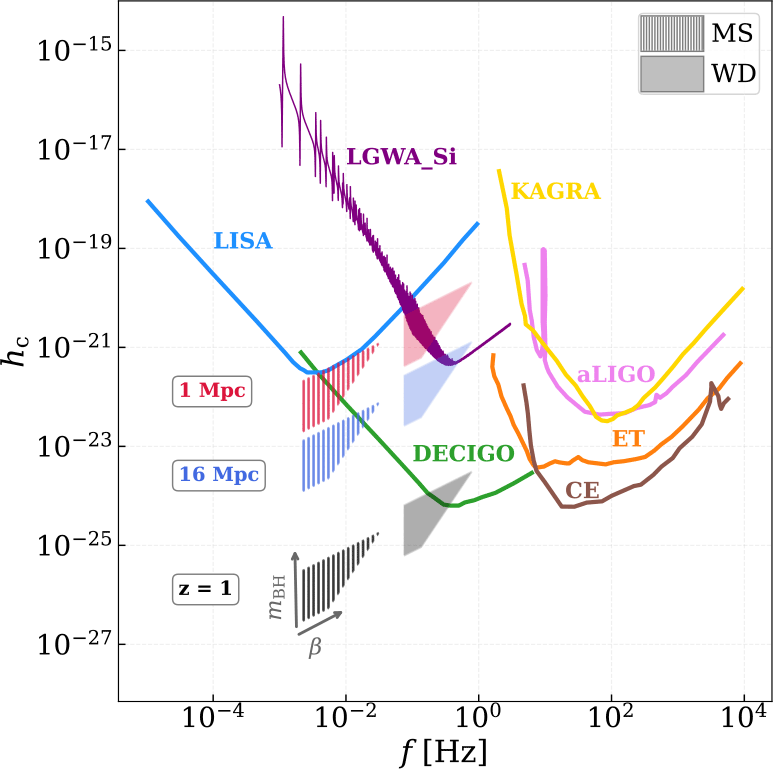
Micro-TDEs are multi-messenger sources, and in addition to EM emission, they are expected to produce GW bursts. Following the formalism of (Toscani et al. Reference Toscani, Rossi and Lodato2020), we find that WD disruptions by stellar-mass BHs produce GW signals in the deci-Hz band, detectable up to
 $z \sim 1$
by future detectors such as LGWA and DECIGO (Fig. 3). MS disruptions yield weaker, lower-frequency bursts, observable only within
 $\sim 10$
Mpc.
Expected frequency (f) and characteristic strain (
 $h_{c}$
) of the GW signal produced by micro-TDEs involving a main sequence star (MS,
 $m_{\rm MS} = 0.5\,M_\odot$
, hatched bands) and a white dwarf (WD,
 $m_{\rm WD} = 1.4\,M_\odot$
, solid colored bands), shown at distance:
 $\sim$
1 Mpc (red),
 $\sim$
16 Mpc (blue), and
 $z = 1$
(gray). The two gray arrows in the lower-left corner indicate the directions of increasing BH mass (
 $m_{\rm BH}$
) and penetration factor (
 $\beta \equiv r_t / r_p$
). These predictions are overlaid with the sensitivity curves of current and future GW detectors: the Lunar Gravitational Wave Antenna (LGWA; Harms et al. Reference Harms, Ambrosino and Angelini2021, purple), the Laser Interferometer Space Antenna (LISA, Amaro-Seoane et al. Reference Amaro-Seoane, Audley and Babak2017), the Deci-Hertz Interferometer Gravitational Wave Observatory (DECIGO; Sato et al. 2017, green), KAGRA (Abbott et al. Reference Abbott, Abbott and Abraham2021, gold), the Einstein Telescope (ET; Maggiore et al. Reference Maggiore, Van Den Broeck and Bartolo2020, orange), the Advanced Laser Interferometer GW Observatory (LIGO; Abbott et al. Reference Abbott, Abbott and Abbott2017, violet), and the Cosmic Explorer (CE; Ng et al. Reference Ng, Vitale and Farr2021, brown).

6. Conclusion
Micro-TDEs in YSCs are mostly produced through interactions involving multiple systems, with rates peaking around
 $\sim 10^3\,\mathrm{Gpc^{-3}\,yr^{-1}}$
at cosmic noon, largely independent of metallicity but dependent on cluster density. Micro-TDEs are promising multi-messenger transients, potentially detectable by upcoming facilities such as LSST, that is expected to detect from tens to several tens of thousands of micro-TDEs per year, and future deci-Hz GW observatories as LGWA and DECIGO.
Acknowledgements
SR acknowledges financial support from the Beatriu de Pinós postdoctoral fellowship program under the Ministry of Research and Universities of the Government of Catalonia (Grant Reference No. 2021 BP 00213). The authors used AI tools (ChatGPT, OpenAI) only for language editing.
 rt/rp
 m∗
 ⊙
 Z=0.0002
 Z=0.02
 mBH
 ⊙
 η
 ρh
 Z=0.0002
 Z=0.02
 hc
 mMS=0.5M⊙
 mWD=1.4M⊙
 ∼
 ∼
 z=1
 mBH
 β≡rt/rp


