Introduction
Young, rapidly growing cities have very large needs for infrastructure. This article examines a set of questions relating to provision of infrastructure in nineteenth-century Chicago and twentieth-century Phoenix. How was urban infrastructure financed? What caused transitions from citywide to segmented or privatized finance, in which property owners who benefited from improvements paid for them? How did these transitions relate to views on whether government should redistribute wealth? More generally, how are costs of public goods shifted over space, time, and social groups or classes, and what implications might these shifts have for the Tiebout model?Footnote 1
The Tiebout model is one of the most widely used models in urban economics. It is based on the idea that consumer-voters choose communities with different combinations of taxes and expenditures for public goods (e.g., high taxes and a high quantity and quality of public goods, or low taxes and few or low-quality public goods). They “vote with their feet” and locate in a community that provides their preferred package. Competition among local communities is thought to help lead to an efficient delivery of services (Dowding et al. Reference Dowding, John and Biggs1994; Epple and Nechyba Reference Epple, Nechyba, Henderson and Thisse2004; Oates Reference Oates and Fischel2006; Ross and Yinger Reference Ross, Yinger, Cheshire and Mills1999; Tiebout Reference Tiebout1956; Zodrow Reference Zodrow1983).
The Tiebout model has two problems from the perspective of understanding infrastructure finance. First, the information requirements for consumer-voters to make fully informed and rational decisions are quite high, and may not be met in cases of long-lived infrastructure in growing communities. Second, the original Tiebout model assumed that consumer-voters actually pay for the urban services they choose. Later extensions of the model explored possibilities for consumer-voters to shift some of those costs to others. White (Reference White, Mills and Oates1975) defined “fiscal squeeze zoning” as a strategy to create a transfer from incoming residents or firms to existing residents, with the transfer being defined as equal to property taxes paid on newly developed land minus marginal public service costs. Jacob (Reference Jacob2008) extended the fiscal zoning component of the Tiebout literature to incorporate the flexibility of land-use regulations and the importance of bargaining between profit-motivated private developers and fiscally motivated municipal agencies. However, relatively little of the voluminous Tiebout literature has explored the shifting of infrastructure costs in growing communities.Footnote 2
As will be discussed in the following text, the history of infrastructure finance shows continual efforts to shift its costs to other groups, with shifts occurring over space, time, and social groups or classes. Moreover, as highlighted in Jacob's work, consumer-voters are not the only relevant decision makers. Governmental actors, as well as private homebuilders who in some cases bear part of the cost of infrastructure provision, also seek to shift costs to other entities. Neither of these important institutional actors is explicitly present in the original Tiebout model, although municipal managers and developers were incorporated in some later extensions.
Efforts to shift the costs of infrastructure finance are examples of a much wider category of distributional conflicts in the nineteenth- and twentieth-century US economy. These conflicts have occurred among income groups, racial and ethnic groups, gender divisions, intergenerational divisions, spatial divisions (e.g., city versus suburb, or region versus region), as well as among capitalist elites (e.g., large versus small business) and segments of the working class (e.g., skilled versus unskilled workers). In this article, I highlight distributional conflicts among homeowners, homebuilders, and taxpayers, and among older versus newer neighborhoods in rapidly growing cities. Other forms of distributional conflict, for example among racial and ethnic groups, were present but are not the focus of my analysis here.
Boomtowns: Chicago and Phoenix
Chicago and Phoenix both grew rapidly by expanding onto available land and attracting large numbers of new residents. In each case, a search for capital gains by property developers underlay the growth process. Developers were active agents who contributed to the creation of value and used the political process to create opportunities for capital gains. However, Chicago and Phoenix experienced this early, boomtown phase in different centuries, and nineteenth- and twentieth-century technology and institutions differed significantly. For example, railroads gave way to automobiles and highways, and the building industry saw the rise of mass homebuilders after World War II. The role of government (federal, state, and local) changed dramatically. Ideas about rights to public goods also changed. In mid-nineteenth-century Chicago, residents were not thought to have a right to paved streets. In the twentieth century, municipal governments were expected to provide some streets and many other public goods (Einhorn Reference Einhorn1991: 241).
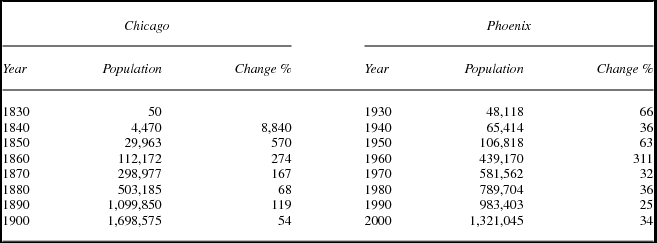
The boomtown growth is illustrated in table 1. Chicago's population grew extraordinarily rapidly (from a tiny base) in the 1830s and extremely high growth rates continued for several decades (Cronon Reference Cronon1991). Phoenix's transformation into a twentieth-century boom city began during the 1940s and 1950s, with World War II and postwar defense spending playing an important role.Footnote 3 Large increases in population in Chicago in the 1880s and Phoenix in the 1950s were partly due to annexation of outlying areas that already contained significant numbers of people. Some annexations were motivated by the desire of outlying residents to obtain urban services (Cain Reference Cain1983; Heim Reference Heim2012).
Chicago and Phoenix: Population and percentage change in population in preceding decade
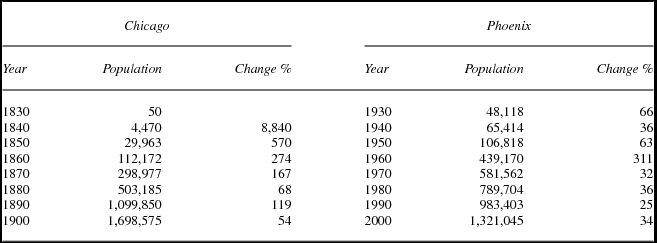
Sources: For 1830–1990: Gibson and Jung (Reference Gibson and Jung2005). For Phoenix in 2000: US Census Bureau n.d.
Both cities expanded dramatically in land area, Chicago from about 11 square miles in 1840 to about 191 by 1900, and Phoenix from about 17 square miles in 1950 to about 478 square miles in 2000 (McKenzie Reference McKenzie1933: 336–37).Footnote 4 Rapid growth created a need for infrastructure such as waterworks, sewers, streets and street lamps, streetcar lines, fire engines, parks, and libraries (Cain Reference Cain1972, Reference Cain1978; Melosi Reference Melosi2000; Teaford Reference Teaford1984: 217). In addition, during speculative booms in Chicago, sewers, sidewalks, and pavements were built ahead of demand to lure purchasers of subdivided lots (Hoyt Reference Hoyt1933: 63–64, 348–50, 392–96). Developers were important in providing infrastructure for new housing developments in Chicago's suburbs from the 1870s onward (Keating Reference Keating, Keating, Moehring and Tarr1985, Reference Keating1988).Footnote 5
Although this article focuses on comparing Chicago and Phoenix, rather than exploring their interrelationships, it is interesting to note that Chicago, and the Midwest more generally, contributed in significant ways to the growth of Phoenix. Walter Bimson, whose ideas about focusing on loans to small businesses and consumers did not receive a favorable hearing at the Harris Trust and Savings Bank in Chicago, became president of Valley National Bank in 1933. Under his leadership, Valley National Bank expanded dramatically and made major contributions to economic development in the Phoenix area. Motorola, one of the most important early manufacturing firms in Phoenix, migrated from Chicago in 1948, as did Greyhound in the early 1970s. The Chicago Cubs baseball team selected Mesa, near Phoenix, for its spring training site in 1952. The Midwest contributed the most new migrants to Phoenix during the 1940s through the 1970s (Shermer Reference Shermer2013; VanderMeer Reference VanderMeer2010).
Infrastructure Finance and Systems of Municipal Government
Municipalities have a wide range of methods by which they can finance infrastructure. Some are familiar to contemporary readers, others less so. Chicago required three days of street labor from adult male residents in the mid-nineteenth century (Pierce 1937: 336). Cities rely on varying combinations of sales, income, and property taxes. They impose license and user fees such as charges for water or other utilities, impose fines, and receive revenue from sales of real property. Special assessments require property owners who want an improvement such as street paving to pay in proportion to the benefit they receive. Their use in mid-nineteenth-century Chicago is compared in this article with development impact fees in twentieth-century Phoenix. Development impact fees are one-time charges on a new development to pay for infrastructure needs generated by that development. In Phoenix, they were set by local government and paid by builders at the time a building permit was granted.
Municipalities also borrowed to finance infrastructure, typically by issuing bonds (Monkkonen Reference Monkkonen1988: 138–44; Teaford Reference Teaford1984: 283–306). Intergovernmental revenues became very important for Phoenix in the late twentieth century. These included state-shared revenues and federal funds provided through revenue sharing and highway and other programs (Hall Reference Hall1979, Reference Hall, Peterson and Lewis1986; VanderMeer Reference VanderMeer2002, Reference VanderMeer2010; Wallin Reference Wallin2008). Even if intergovernmental revenues could not be used directly for infrastructure, they could free up other funds for that purpose.
In Property Rules: Political Economy in Chicago, 1833–1872, Robin L. Einhorn (Reference Einhorn1991) described three phases of infrastructure finance and systems of municipal government in Chicago. From 1833 to the mid-1840s, public works were created for citywide benefit and financed by a citywide property tax. Government was viewed as a tool to promote a shared interest in growth. This booster system was replaced during 1847 through 1851 by what Einhorn termed a segmented system, based on special assessments for “particular benefits.” She characterized this system as a privatization of government to avoid redistribution of wealth. Aversion to redistribution was evident at the national level as well in the policies of Presidents Jackson and Polk (Einhorn Reference Einhorn1991: 24–25, 68–71).
In the segmented system, “notions of the public good all but disappeared from municipal policy debate” (Einhorn Reference Einhorn1991: 76). During the mid-1860s, the segmented system gave way to a system of interest-group competition and machine politics. The idea of a public interest reemerged, but was redefined. Powerful groups defined the public interest as their own and sought citywide financing to address their needs. Einhorn argued that this pluralist system of interest-group competition was associated with upward redistribution of wealth. It also created the potential for downward redistribution, more evident during and after the 1930s (Einhorn Reference Einhorn1991: 214–15, 229–30, 241–44).
Einhorn viewed Chicago's meatpackers as a prime example of upward redistribution. The industry generated large amounts of waste that polluted Chicago's rivers. City authorities ultimately decided that economic development was a public interest and the entire city shared in the costs of cleanup. Chicago undertook two huge public works projects in 1865—tunneling under Lake Michigan and deepening part of the Illinois and Michigan Canal—financed by municipal bonds. An alternative outcome would have been for the meatpackers to bear the costs under the legal tradition of nuisance assessment (Einhorn Reference Einhorn1991: 210–13, 224).Footnote 6
Chicago city officials did attempt to abate a nuisance associated with livestock slaughter when they sought to force the Union Stock Yards and Transit Company of Chicago to remove railroad tracks in the city that were being used to transport livestock, offal, and “other noxious substances.” In that case, the Supreme Court of Illinois in 1896 affirmed a trial court's decree preventing the city from taking this action. However, the court was not questioning the city's right to abate a nuisance; rather, it did not consider destruction of the company's tracks to be a “proper or permissible remedy.” In a much earlier case in 1878, the US Supreme Court had ruled that the village of Hyde Park could enforce nuisance abatement and sanitation regulations against an offal processing company that transported offal from depots in the city of Chicago to a fertilizer plant in the village.Footnote 7 Thus, even when a public interest in economic development might be argued to exist, municipalities did not always place economic development above other objectives, or act primarily to benefit the private interests undertaking the economic development.
The idea that a clear separation of private and public spheres existed in the nineteenth century was challenged by William J. Novak (Reference Novak1996). In The People's Welfare: Law and Regulation in Nineteenth-Century America, he argued that a system of “well regulated governance” characterized the United States from 1787 to 1877. This system, grounded in the tradition of common law, was one in which private civil rights were “subordinated to the community's ability to regulate for the good of the whole” (Novak Reference Novak1996: 237). In Novak's view, it gave way only gradually to more bureaucratic forms of governance. But between 1877 and 1937, a new governmental regime emerged “that radically separated private right and public power in simultaneous pursuit of a centralized state and an individualized subject” (ibid.: 247).
Einhorn (Reference Einhorn1991: 116) described the operation of the segmented system in the 1850s as consisting of “a rigorously defined administrative procedure and a highly stylized rhetoric.” Property owners seeking an improvement such as a sidewalk, street planking, macadam, or park petitioned the alderman on one of the three streets and alleys committees who represented the ward in which the improvement would be located. The alderman also received “remonstrances” from those opposing the project. Resolution of conflicts between petitioners and remonstrants was based on the amounts of affected real estate owned by each, and aldermen sometimes modified specifications of a project to build consensus (Einhorn Reference Einhorn1991: 118–23). The City Council then estimated the cost of the project and elected assessment commissioners to estimate damages and benefits to property values that would result from the project. Taking all of this information into account, the assessment commissioners then assessed the owners of each lot. Pierce (1937: 361) noted that Chicago's special assessments (in the 1840s) “were regarded as the equivalent of an enhanced value which the property of the person assessed would derive from the improvement.” Special assessments for permanent improvements rose dramatically from $5,100 in 1848 to $42,635 by April 1, 1862 and $2,836,852 by April 1, 1870 (Hoyt Reference Hoyt1933: 492; Pierce 1940: 347).
“Who decided” had changed as the infrastructure financing system evolved. Under the booster system from 1833 to the mid-1840s, Chicago had citywide decision making, with a Board of Trustees elected at large. The segmented system had a City Council with 18 aldermen, two elected in each of nine wards. As described in the preceding text, constituents petitioned the aldermen for improvements. Only property owners whose real estate would be affected had a right to participate, and only owners whose property reaped benefits paid for improvements. The 1847 ward map (see Einhorn Reference Einhorn1991:81) reflected real estate interests, rather than ethnicity or class. The transition to a system of interest-group competition in the mid-1860s saw the emergence of a new elite of Gilded Age millionaires. Einhorn argued that their businesses depended less on regular provision of infrastructure and that they sought to reduce taxes and special assessments (ibid.: 42–43, 179–83, 226–30).
Did Phoenix experience similar phases of infrastructure finance and municipal government, with a transition from citywide to more segmented or privatized provision? The first two phases identified by Einhorn do have parallels in Phoenix. The 1980s marked a shift from a booster system to a more segmented system, in which development impact fees were introduced and citywide elections for City Council were replaced by district elections. This shift was preceded by a significant governmental change in the mid-1970s: the decline of Charter Government, which had been in power since 1948 (Bridges Reference Bridges1997: 102–3, 107, 118–20, 178–79; Shermer Reference Shermer2013: 130–46, 306–25; VanderMeer Reference VanderMeer2010: 128–33, 184, 240–42).
Under Charter Government, there was an ethos of public service and a belief in efficient, well-managed government. As in Chicago's booster phase, government was seen as a tool to promote a shared interest in growth. With the defeat of Charter Government candidates in 1973 and 1975, “some of the beliefs that Charter Government had consistently championed—a general public interest and selfless public service—were being replaced by an interest-group perspective, whose adherents accepted the legitimacy of competing interest groups and of council members representing the interests of racial and economic groups” (VanderMeer Reference VanderMeer2010: 263).Footnote 8 In this respect, the new system resembled Einhorn's third phase of interest-group competition.
During the 1970s, Phoenix's reliance on federal funds grew, though city officials simultaneously warned of the dangers of depending on them. Federal spending on cities nearly doubled between 1970 and 1974. Federal revenue sharing began in 1972 and was followed by the Community Development Block Grant Program of 1974 (ibid.: 245–48). Redistribution at the federal level allowed for increased provision of public goods without a corresponding increase in local taxes, and without the local redistribution that might have accompanied tax increases (Hall Reference Hall, Peterson and Lewis1986: 195).
A major break in both the philosophy of infrastructure finance and in governance came in the 1980s. A development impact fee ordinance, stating that “new development should pay for itself,” was passed by the Phoenix City Council in July 1987 (City of Phoenix 1987). It followed earlier, more limited, ordinances for sewer and water projects in 1981 and 1982. Passage of the development impact fee ordinance marked the emergence of a system in which direct beneficiaries in a developing area were considered responsible for capital facility infrastructure needs in a wide range of areas, including police, fire, parks, libraries, solid waste, drainage, water, wastewater, major streets, storm sewers, and equipment repair facilities (Gammage Reference Gammage2003: 130–32; Gerber Reference Gerber1986; Heim Reference Heim2001). Subdivision regulations already had required developers to provide some on-site infrastructure; impact fees were intended to provide funds for some regional, capacity-expanding off-site infrastructure as well and to thereby mitigate effects of the new development upon existing residents (Lawhon Reference Lawhon2012).
Important changes in “who decided” in Phoenix also occurred in the 1980s. The Charter Government coalition, like other southwestern reform governments, had kept the electorate small and homogeneous. Elite developers played a dominant role, and low-income and minority residents were peripheral (Bridges Reference Bridges1997; Trounstine Reference Trounstine2008). As in Chicago, citywide elections characterized an early booster phase.Footnote 9 In 1982, Phoenix voters approved a district system of elections for City Council, with eight council members to be elected.
Terry Goddard, who had been a leading spokesman for the Committee for District Representation, became mayor in 1984. An important part of his agenda was strengthening Phoenix's downtown, which was believed to have suffered as a result of growth on the city's periphery. Environmental and social equity concerns were raised as the postwar growth vision was questioned. Neighborhood organizations became more influential from the mid-1980s and were a channel for voicing concerns about growth (Bommersbach Reference Bommersbach1987a, Reference Bommersbach1987b; Luckingham Reference Luckingham1989: 222–28; VanderMeer Reference VanderMeer2010: 266, 315–18, 335–37).Footnote 10
While the district system increased the responsiveness of the City Council and staff to local citizens, critics argued that there was less focus on bigger, citywide issues (Horstman Reference Horstman1989). Throughout cities in the Southwest, the change to district systems had some positive effects, but stable electoral and governing coalitions of communities of color and the antigrowth advocates who also supported the district system did not appear (Bridges Reference Bridges1997: 200–6). Persisting after the change to the district system in Phoenix was the central role of a strong, professional city manager (Ross Reference Ross2011: 10–12; VanderMeer Reference VanderMeer2010: 323–24).
Although both Chicago in the mid-nineteenth century and Phoenix in the late twentieth century shifted toward more segmented or privatized financing of infrastructure, the reasons for these shifts were not identical. In Chicago, one important factor was the inability of lower-income homeowners to pay for infrastructure. More well-off property owners wanted to exclude them from decision making because they might oppose creation of infrastructure. The segmented system allowed those who wanted and could afford infrastructure to provide it for themselves. Einhorn noted that this system resulted in great inequality of infrastructure provision across the city, although it also prevented the upward redistribution of wealth that would occur if wealthier property owners could force their neighbors to share the cost of infrastructure (Einhorn Reference Einhorn1991: 115, 141, 227).Footnote 11
In Phoenix, development impact fees were assessed to provide future homeowners in outlying areas with “publicly necessary” infrastructure. Decisions about the fees were made by the Phoenix City Council, making choices for residents who in many cases had not yet moved to the city. Unlike Chicago, where existing residents who might block the provision of infrastructure were excluded from decision making, in Phoenix some decisions were being made for residents who did not have a voice in the decision because they did not yet live in the area.Footnote 12
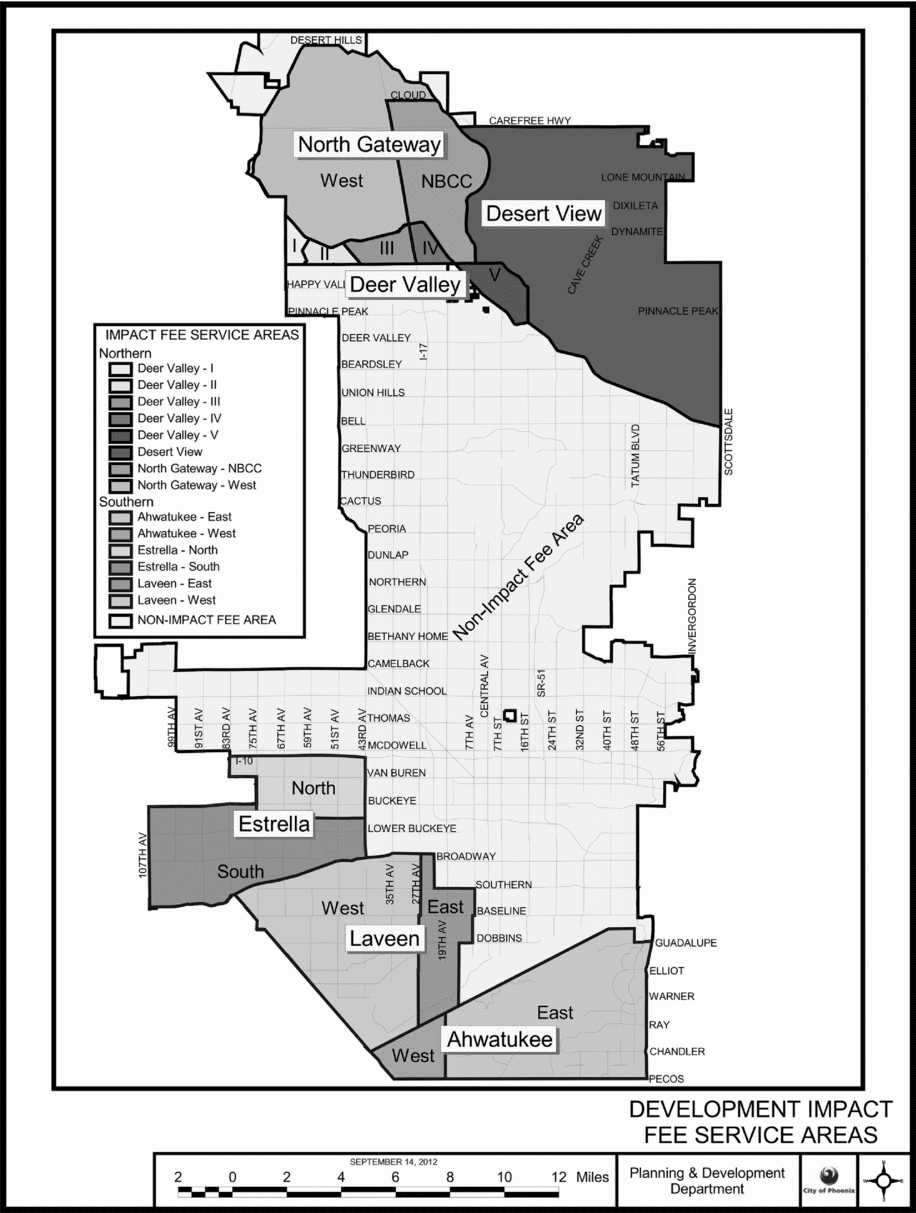
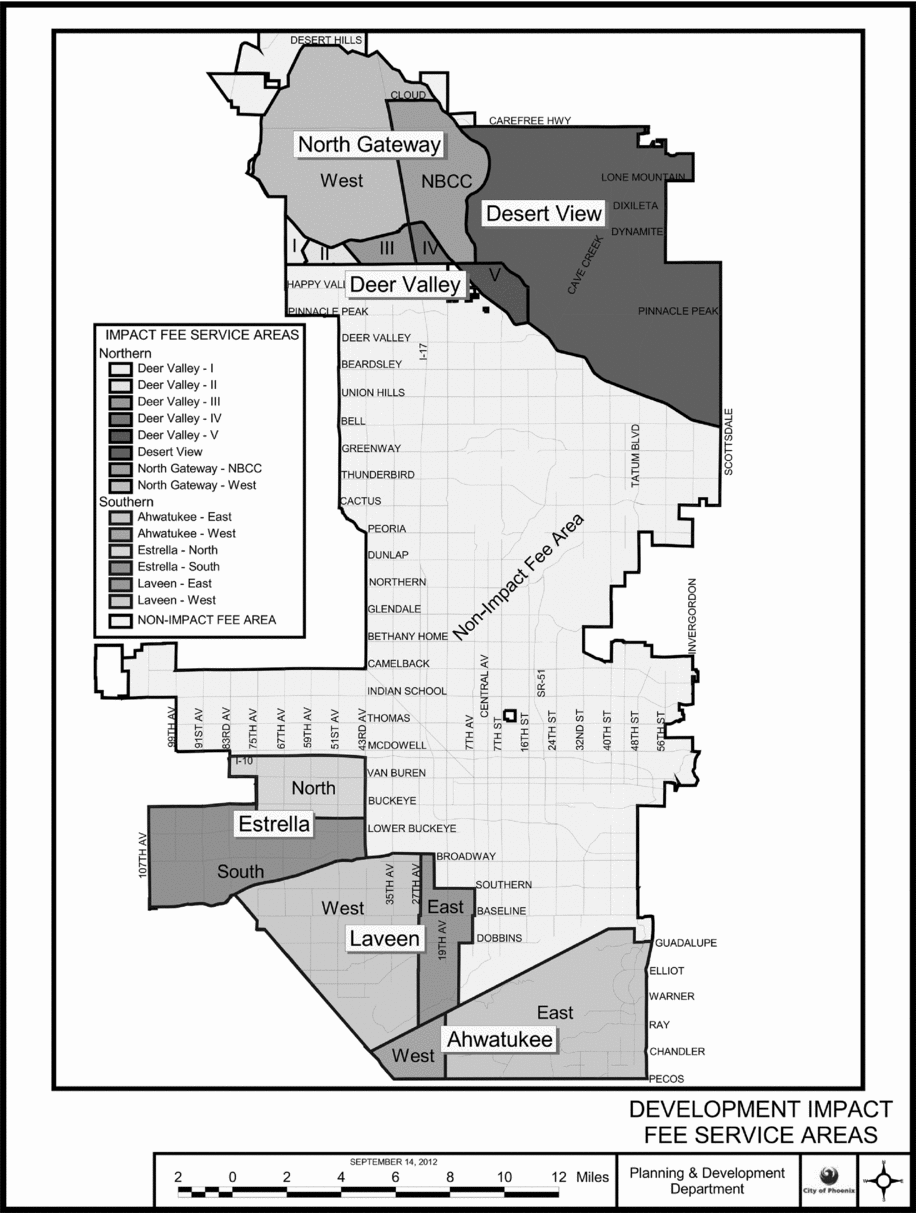
Development impact fees initially were limited to four Peripheral Areas (A, B, C, and D) for which Specific Infrastructure Financing Plans were adopted (see City of Phoenix [1989] for a map of the Peripheral Areas). In 2012, there were 14 different areas with impact fees, all designated in the city's General Plan as “growth areas” (see figure 1). (The number of areas later was reduced from 14 to 8.) The areas differed in their capital facility requirements, and single-family residential impact fees in 2012 ranged from $6,226 in Ahwatukee – East to $17,631 in North Gateway – West and North Gateway – Black Canyon Corridor (City of Phoenix Planning and Development Department 2012a).
Phoenix development impact fee service areas, 2012.
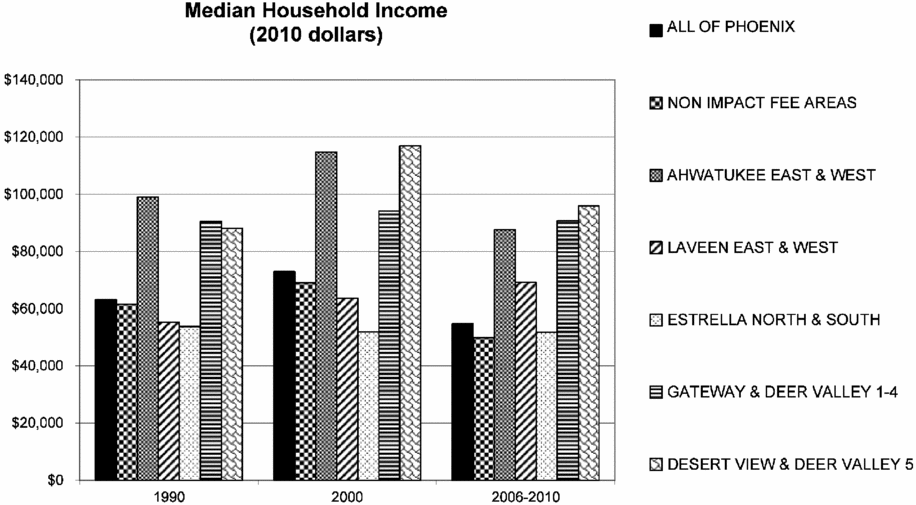
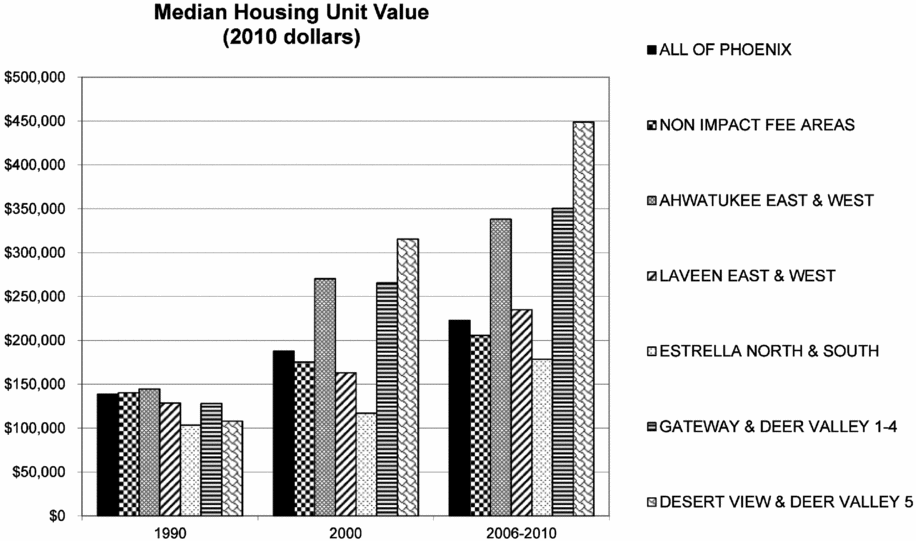
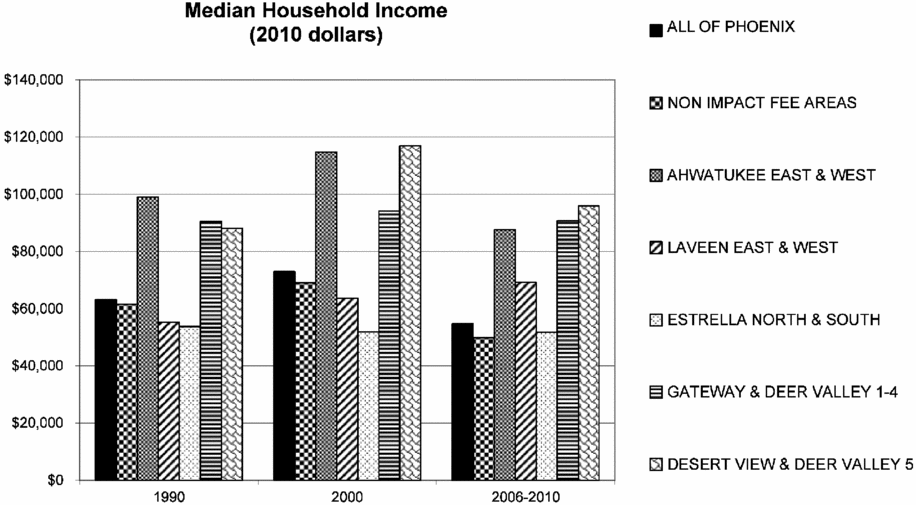
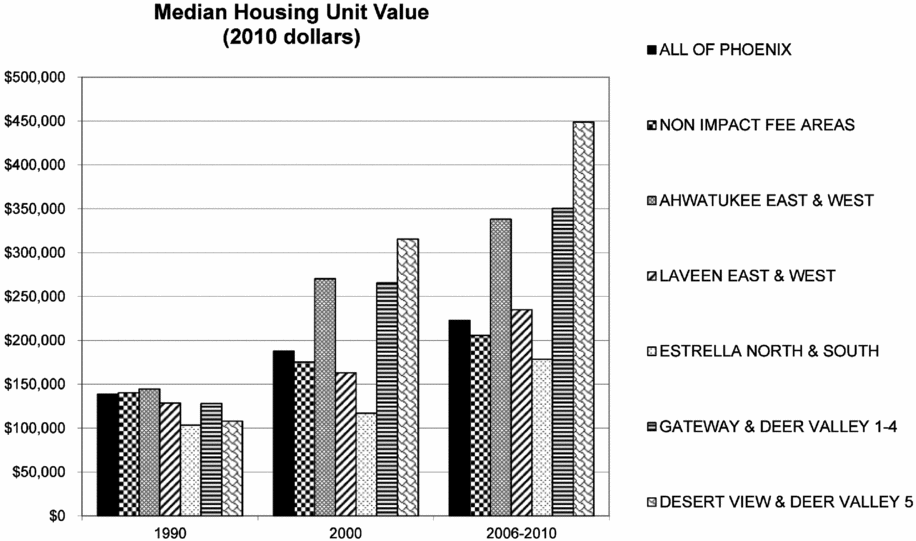
In most of the impact-fee areas, median household incomes (in 2010 dollars) were higher than in (1) the city of Phoenix as a whole, and (2) the non-impact-fee areas, in 1990, 2000, and 2006–10 (see figure 2). Only Laveen and Estrella in 1990 and 2000, and Estrella in 2006–10, had lower incomes. Median housing unit values show a similar pattern in 2000 and 2006–10 (see figure 3). In 1990, however, median housing unit values were lower in all of the impact-fee areas, except Ahwatukee, than in Phoenix as a whole or the non-impact-fee areas. These data suggest that the progressivity of the impact fee program varied in different locations. In Ahwatukee and the northern impact-fee areas, the introduction of impact fees, other things being equal, meant that a greater contribution to infrastructure finance in these areas would be made by residents who were better off than residents in other parts of the city. In Estrella, and in Laveen in 1990 and 2000, less well-off communities were being required to pay a larger share of the costs of their infrastructure.
Median household income, 1990, 2000, 2006–10.
Median housing unit value, 1990, 2000, 2006–10.
General funds and bond financing also were used to pay for infrastructure in both Chicago and Phoenix. Ann Durkin Keating (Reference Keating1988) argued that funding decisions in Chicago about general funds, bonds, and special assessments reveal which groups were expected to benefit from specific improvements. General funds and bonds, respectively, were used if an improvement was viewed as being primarily for the public good or as benefiting future as well as current residents. Attitudes changed over time. Some street improvements came to be financed by general funds rather than special assessments. By contrast, special assessments were added after 1890 for sewer systems. Keating argued that sewer extensions came to be viewed primarily as amenities rather than being exclusively for the public good, and that the rising level of the city's debt motivated a turn to special assessments.Footnote 13
Phoenix authorized bonds for a range of urban infrastructure in the 1950s and subsequent decades, including approval in 1988 (one year after passage of the development fee ordinance) of more than $1 billion of capital projects in the largest municipal bond election in US history. Bond elections continued to be successful in subsequent years and contributed to increasing cultural activities and opportunities in downtown Phoenix (City of Phoenix 1970, 1988; Phoenix Reports 1952; VanderMeer Reference VanderMeer2010: 317, 326).Footnote 14 Adoption of development impact fees thus did not signal an abandonment of more collective methods of finance.
Improvements to neighborhood roads had always been the responsibility of property owners. As in Chicago, this led to significant spatial inequality, with better roads in more affluent and newer areas. Early on, the city had undertaken “the repair of major streets as a means for improving the city's prospects” (Storrar Reference Storrar2004: 7). At least part of spending on streets thus was considered to have a public purpose of contributing to growth, and to be appropriately financed by the city as a whole. Similarly, in 1950 the city took responsibility for installing fire lines and hydrants in newly annexed areas, rather than directly assessing property owners (Phoenix Reports 1952).
It is impossible to determine exactly what share of Chicago's infrastructure was financed by special assessments. Einhorn (Reference Einhorn1991: 140) noted that for water and sewerage, “no surviving data indicate the proportional roles played by general revenue and special assessment in financing either of the systems.” Cain (Reference Cain1978: 146–48) concluded that Chicago's nineteenth-century waterworks were financed through bonds (relatively constant), surplus revenues (which increased over time), short-term indebtedness (especially important around the turn of the century), and tax assessments (especially important in the 1870s). Less information is available on sewer financing, but Cain argued that bonds and surplus tax receipts paid for construction. He observed that users of the water and sewer systems ultimately paid for them because surplus revenues were used to cancel the bonded indebtedness of the water and sewer departments. Cities throughout the United States used combinations of user fees, assessments on abutting property holders, and general tax revenues to fund waterworks and sewerage systems in the nineteenth century (Jacobson and Tarr Reference Jacobson and Tarr1995: 12, 14).
Similarly, it is not possible at this time to determine accurately the share of Phoenix's infrastructure financed by development impact fees. The League of Arizona Cities and Towns noted that impact fees provided less than 3 percent of the total funding for estimated capital expenditures for fiscal years 2008–9 through 2012–13 in the city's capital improvement program (League of Arizona Cities and Towns, n.d.). Data on impact fees also can be found in the city's Comprehensive Annual Financial Reports and in Annual Development Impact Fee Reports required by the state of Arizona and first published in fiscal year 2004–5.Footnote 15
However, existing data understate the amount of infrastructure provided in connection with development impact fees. The city of Phoenix has a very large impact fee credit program, in which developers provide infrastructure and in return see reductions in the impact fees they owe.Footnote 16 Carter Froehlich, a real estate consultant with extensive experience in impact fee analysis, estimated that developers in Arizona provided “maybe one-half” of arterial streets (for which they would be eligible for credits) (pers. comm., June 15, 2012). This share might be expected to be lower in Phoenix than in some smaller municipalities. Also, impact fee revenues for water and wastewater incorporate offsets for water and wastewater occupational development fees also paid by builders. These offsets lower development impact fee revenues and hence the expenditures attributed to those revenues.Footnote 17
It is possible that even substantial revisions to the data might still indicate that a relatively small share of infrastructure in Phoenix has been financed by development impact fees. Impact fees often do not cover the full costs of new development and even after being adopted, may not make a very large contribution to local government revenues. They have generated considerable political and legal controversy, but such controversy is not necessarily a good indicator of their financial impact; in fact, it may be one reason for a relatively small financial impact. It is possible that transition to a more privatized or segmented system of municipal finance in Phoenix may have been more rhetorical than real.
Such a possibility is consistent with the ongoing importance of bond funding in Phoenix. Debates over impact fees have been highly visible and the philosophy of “making growth pay for itself” has been prominent in public discussions. Less publicity has accompanied the apparently very successful activities of a series of Citizens’ Bond Committees. From the 1950s onward, citizens had significant input into the city's bond programs. Committee members, organized in subcommittees, compiled lists of projects to put before voters in bond elections. The continuing approval of bond programs, even after the passage of development impact fee legislation, meant that citywide financing continued to play a major role.
Adoption and Implementation of Development Impact Fees in Phoenix
Impact fees came into widespread use in the United States after the early 1980s, particularly in the rapidly urbanizing Sunbelt and Rocky Mountain West (Duncan Associates n.d.; Lawhon Reference Lawhon2012). Frank and Downing (Reference Frank, Downing and Nelson1988: 15–17) described three important background factors: (1) environmental concerns that led communities to question whether new development produced a net fiscal deficit; (2) fiscal revolt beginning in the 1970s, and a shift in emphasis from general taxation to user fees; and (3) evolution of judicial standards supporting impact fees that charged a proportionate share (the rational nexus test).
In Phoenix, environmental concerns relating to sprawl and its effects were voiced in the 1970s and especially the 1980s as the progrowth vision that had led postwar development came to be questioned (VanderMeer Reference VanderMeer2010). Development impact fees were sought partly as a deterrent to “leapfrog development” and in 1995 a member of Phoenix's Commission on the Economy asserted that “impact fees do help control sprawl” (City of Phoenix 1995; Heim Reference Heim2001). Concerns about growth, and who would bear the costs of that growth, helped to motivate the change in infrastructure financing methods.Footnote 18
A commitment to low taxes characterized Phoenix throughout the Charter Government era. The 1970s saw an increase in local street improvement districts, as well as a turn to private enterprise for the provision of municipal services. Utility fees, however, fell from two-fifths of budget revenues in 1950 to only 7.8 percent in 1980 (Storrar Reference Storrar2004: 4–5, 9, 11). In the early 1980s, when the electorate sought property tax limitation, city officials “supported the idea but simultaneously initiated gradual increases in user fees” to compensate for property tax revenue losses (Hall Reference Hall, Peterson and Lewis1986: 190).
Infrastructure financing concerns surfaced in 1980, due to greatly increased construction costs for sanitary sewer projects approved in the 1979 Bond Election and an expected reduction in federal funds. The water and sewers director recommended a sanitary sewer capital investment fee “based on the concept of ‘growth paying its way’” (Palmer Reference Palmer1980). A subsequent recommendation for a water occupational development fee, identical to the sewer fee that passed in 1981, cited the high cost of borrowing as “placing pressure on the water rates to finance the cost of growth” into proposed annexation areas. An additional source of funds for water system capital costs would help to alleviate that pressure (Palmer Reference Palmer1982).
By the mid-1980s, Phoenix was experiencing considerable fiscal difficulties, and revenue considerations may have contributed to the adoption of the more wide-ranging 1987 development impact fee ordinance. Federal revenues fell from 24.3 percent of Phoenix's general revenue in 1975 to 17.8 percent in 1980 and 8.9 percent in 1990. In response, the city increased its sales tax from 1 to 1.2 percent (VanderMeer Reference VanderMeer2010: 322). The city's total revenues fell short of its total expenditures by about $18 million in fiscal year 1980–81, $5 million in 1981–82, $14 million in 1982–83, and $19 million in 1984–85 (all figures in 2010 dollars, rounded to the nearest million). After a $5 million surplus in fiscal year 1984–85, the gap turned very negative again ($34 million) in fiscal year 1985–86.Footnote 19
Early in 1986, City Manager Marvin Andrews ordered a 2 percent across-the-board spending cutback, to cope with a projected $17 million revenue shortfall for fiscal year 1986–87 (Thomason Reference Thomason1986). Mayor Terry Goddard described the city's financial conditions as “grim” in March, and called for new taxes and budget cuts: “With drastically lowered receipts from federal and state governments, austerity is the road we must travel in 1986” (Schultze Reference Schultze1986). The city's finance director, Kevin Keogh, warned in November 1986 that “while the City has the financing capacity to meet most of its capital needs through approximately 1989,” and would be able to continue to rely on bond funding, “it's clear that we will be facing considerably greater needs than we have in the past.” He concluded that along with rigorous prioritization, additional capital financing sources probably would be required (Keogh Reference Keogh1986). Under these conditions, the desire to “make growth pay for itself” could be expected to flourish.
Interestingly, Dr. William Parks, a Phoenix City Council member from 1984 to 1990 and chair of the council's Subcommittee on Fiscal Impact, which proposed the impact fees, did not think fiscal considerations were an important part of City Council discussions. He indicated that the city manager steered the City Council away from financial matters and he did not remember hearing about bonding. He also commented, however, that at the time, his district was poor on infrastructure, already developed parts of the city were starving for infrastructure, and the city was out of money.
In explaining the origins of development impact fees in Phoenix, Parks emphasized the negotiations for a specific case (a development in northern Phoenix called Continental Foothills, later Tatum Ranch) that inaugurated the practice of developers providing certain types of infrastructure needed for new development (pers. comm., August 1, 2012). Parks requested stipulations in the rezoning agreement for Continental Foothills that required its developer to pay for infrastructure costs “in recognition of the fact that in its present budget forecast for the next six years the City of Phoenix has no available funds in the next six years to pay for any infrastructure in [Peripheral] Areas C and D” (Counts Reference Counts1985).Footnote 20 There had been opposition to approving the development because of its cost to the city and its location. The Phoenix General Plan 1990 had a policy that development was not to occur north of the Central Arizona Project canal until after 1990 to avoid promoting sprawl. There was still much undeveloped land south of the canal.
The drop in federal revenues in the 1980s reflected a national political context that resembled in some respects the Chicago case. The Reagan era that began in 1981 shared with the Jackson and Polk administrations an aversion to using government to redistribute (at least, to redistribute downward—many of Reagan's economic policies contributed to significant upward redistribution). In the mid-nineteenth century, aversion to using the federal government to redistribute was linked to sectional rivalries and the slavery issue. In the late twentieth century, it was associated with the rollback of the welfare state.
Development impact fees were contested by developers and homebuilders, who argued that the resulting increase in home prices would harm the homebuilding industry and make housing less affordable, and that a city that adopted development impact fees would lose jobs and business to neighboring communities. Gary Nelson, a developer who served on the citizen's Fiscal Impact Advisory Task Force during 1986–87 at the request of the Home Builders Association of Central Arizona, noted in 2012 that “even today,” many homebuilders sought to reduce or stop development impact fees. While on the task force, he received calls from builders saying “we don't want this.” His response was that if they didn't do it, they wouldn't be able to build. Infrastructure was necessary and had to be paid for. In his view, the problem was that cities in Arizona (and California) took the adoption of development impact fees as “an open checkbook,” and he thought that increasing costs of houses did have negative effects on homebuilders (pers. comm., June 13, 2012). Similar views were expressed by Elliott Pollack, a local economic consultant, who argued that Arizona cities saw impact fees as “free money” that could be used to provide “gold-plated” facilities (pers. comm., June 21, 2012).
There was some sympathy on the City Council for concerns voiced by homebuilders. When impact fee increases were being considered in 2006, Councilman Siebert did not support them because he felt “they would slow down the construction of some quality developments in the City” and he was opposed to any increases higher than those assessed by other cities in the Phoenix metro area. He argued that the proposed increases in fees were inequitable for outlying areas, which “could end up paying for infrastructure closer to the City's core” and expressed the view that impact fees needed to be more equitable across the city (City of Phoenix 2006).Footnote 21 Councilwoman Neely also was concerned about equity across different areas of the city, and said she would prefer a uniform rate citywide. Uniform rates, however, would be disadvantageous for established areas of the city, and Mayor Gordon stated that those areas would need offsets to the fees (ibid.).
City Council members and state legislators responded to concerns of developers and homebuilders, particularly during times of recession. Support for homebuilding had always been strong in postwar Phoenix, and concerns about the manufacturing sector after the late 1980s might have provided an additional incentive to keep Phoenix growing by sustaining suburban home construction. After the collapse of the housing boom in 2006, delays in scheduled increases in impact fees were negotiated in several cities in the Phoenix metropolitan area (ibid.). In 2009, the Arizona Legislature imposed a moratorium on new or increased development fees that was modified several times and ultimately set to expire on January 1, 2012. In 2011, it rewrote state statutes regarding development impact fees. As a result, the city of Phoenix eliminated impact fees for several categories of public goods (open space, solid waste facilities, and equipment repair facilities), effective January 1, 2012, and further changes would be required for compliance with the revised state statutes (City of Phoenix Planning and Development Department 2012b; Lawhon Reference Lawhon2012; McGuire and Culp Reference McGuire and Culp2011).
Additional research is needed into the complexities of homebuilder and developer opposition to impact fees. There may have been significant differences between smaller builders, many of whom who strongly opposed impact fees, and larger developers who took a broader view of the development process and recognized that development depended upon infrastructure that government might not be able to provide through traditional tax and bond mechanisms. The Home Builders Association of Central Arizona may have been very responsive to concerns of smaller builders; other organizations in which larger developers participated were not the driving force behind lawsuits against impact fees.Footnote 22
Who Does Pay, Who Should Pay? Shifting the Cost of Infrastructure
Both special assessments and development impact fees are based on a benefit principle of taxation, according to which those who receive benefits are responsible for paying for them.Footnote 23 An alternative is an ability-to-pay principle. The use of special assessments rose in California in the aftermath of Proposition 13 in 1978, and local governments elsewhere also turned to this financing device (Kogan and McCubbins Reference Kogan and McCubbins2009; Misczynski Reference Misczynski, Ingram and Hong2012). There are two perspectives one can take on special assessments. They can be viewed as a creative financing mechanism for financially strapped municipalities. Alternatively, they can be seen as contributing to the privatization of government, and the shrinking of the public sphere, currently underway in the United States. In Chicago and Phoenix, special assessments and development impact fees meant that costs could be shifted from residents who did not benefit from a specific improvement to those who did.
Anthony de Jasay argued that “Publicness . . . implies a loosening of the nexus between individual contributions and benefits” and that “public provision is sui generis redistributive” (de Jasay Reference de Jasay1989: 220, 227). In his view, attempting to solve the free-rider problem by requiring mandatory contributions to pay for public goods leads to an undesirable expansion of the provision of public goods by government, rather than by voluntary contributions. Command encroaches on contract and individual liberty is diminished. His discussion is interesting in raising the issue of a growing list of public goods that are considered mandatory and from which residents are not excluded. He asserted that “contemporary mores would not tolerate a playground where rich children could play and poor ones look on” (ibid.: 128).Footnote 24
In America Becomes Urban: The Development of U.S. Cities and Towns, 1780–1980, Eric Monkkonen presented an interesting formulation of the allocation of capital costs. He observed that “Debt is the way in which capital costs are paid over time, while taxation allocates these costs over space” (Monkkonen Reference Monkkonen1988: 154). Taxation also allocates across people, and across social groups or classes, depending on the progressivity of the tax system. Efforts to shift the costs of public goods to another group, or at least to share them more widely (thereby decreasing one's own contribution) are widespread. Municipal borrowing can shift the costs to future generations.Footnote 25 Taxation or assessments can shift the costs to those in another geographic area or social group.
Thomas P. Snyder and Michael A. Stegman (Reference Snyder and Stegman1986: 39–51) provided a careful discussion of intergenerational equity issues that arise with public and private financing of infrastructure. Incremental investments, such as residential streets and water and sewer systems, can be made as needs arise, whereas lumpy investments, such as sewage treatment plants, are expanded at multiyear intervals (10 to 25 years) and have unused capacity until demand catches up with supply. Their intergenerational effects differ.
For incremental investments where the economic life of a facility is greater than the payback period for bonds used to finance it, inequities between established residents and new development need not occur. Two forces are at work. First, if a community is growing, debt for replacement facilities for existing residents as well as for facilities for new residents is spread over an increasing population, and existing residents over time will pay a decreasing share of the cost of facilities they use. Second, growth requires more facility expansion for new residents and therefore entails higher costs for existing residents. The net effect of these two forces depends on the growth rate, the interest rate on borrowed funds, and the length of the financing period (ibid.: 42). Inequities between established residents and new development occur in cities that are growing rapidly, with a growth rate exceeding the real interest rate and substantial needs for capital expansions to serve future residents.
Development fees on new developments can be used in combination with public (bond) financing to offset some of the effects of rapid growth on established residents and create a more equitable outcome. If development fees are too large, however, the opposite inequity can occur. In that case, development impact fees
become a windfall gain to established residents and end up placing an undue burden on new development . . . a combination of high growth and large development fees could generate enough revenue to nearly cover the full financing costs of the entire population, leaving established residents to pay very little of the cost of the facilities they use. (ibid.: 43)
In the case of lumpy investments, the effects on established residents are complex for several reasons, including the existence of three time periods to consider (the multiyear expansion interval as well as the financing period and the economic life of the facilities). Snyder and Stegman found generalities difficult to draw, but concluded that lumpy investments, unlike incremental investments, place an inequitable burden on established residents at all rates of growth. This is due to the excess capacity that established residents carry until demand catches up with supply. They considered development impact fees to be warranted for lumpy investments (ibid.: 44–49). In Phoenix, a rationale of this type was articulated in the proposal for a sanitary sewer capital investment fee: “revenue generated by this fee will help hold down the sewer user charge for existing customers who have already paid for capital improvements through their taxes” (Brunton Reference Brunton1980).
A double payment problem arises if development fees are used to pay for infrastructure that previously was publicly financed by taxes or utility fees. New development will be paying the full cost of its own infrastructure, and also paying taxes or utility fees that help to defray debt costs of facilities built for established residents. Established residents will be paying only for facilities that serve them. “The solution to the double payment problem is to reduce the development fee by the present value of taxes and other payments made by new development toward outstanding debt on existing facilities similar to those being financed with the development fee” (Snyder and Stegman Reference Snyder and Stegman1986: 58). Many cities, including Phoenix, use offsets or credits to development fees to address this issue (Nicholas et al. Reference Nicholas, Nelson and Juergensmeyer1991: 98–118).
Two further points concerning intergenerational equity can be made. First, not all purchasers of homes in new developments are new residents. As noted previously, some of these purchasers in Phoenix were existing residents moving within the city. Second, Snyder and Stegman observed that intergenerational equity is an important principle, but other principles also can be invoked, such as distributional equity among different income classes. They pointed out (1986: 58) that the rational nexus criterion upheld in the legal history of development impact fees assumes that intergenerational equity is more important than all other principles, including the ability to pay. (The rational nexus criterion requires that facilities financed by development impact fees are needed to serve the new development that pays the fee.)
In Phoenix, the adoption of development impact fees could reflect an effort by central city residents and/or landowners and developers to shift capital costs to those in specific geographic areas, typically in the periphery of the city. Such an impulse does not appear to have come primarily from minority residents in South Phoenix, although their City Council representative, Calvin Goode, pressed hard to reduce inequalities in the infrastructure and services provided in his district versus other parts of the city. In an interview recorded in 2000, he did not identify growth at the city's periphery as something to be discouraged (e.g., by impact fees) in order to protect or benefit his constituents (Goode Reference Goode2000; Ross Reference Ross2011: 121).Footnote 26
To the extent that impact fees shifted costs to outlying areas, they might contribute to reversing a previous pattern in which central city residents subsidized suburban residents. The existence of such a pattern prior to 1987 has not been unambiguously established.Footnote 27 In some ways, central city residents historically may have had part of the costs of their public goods paid by residents in what was then the periphery of the city. Annexation between 1950 and 1960 reduced the per capita debt from $199 to $170, while total bonded debt rose from $21,209,000 to $75,121,000. General obligation bonded debt fell from $109 to $63 per capita. New residents shared the costs of water system and sewer improvements, airport expansion, streets, parks, libraries, and other municipal buildings (Kelso Reference Kelso1960: 43–44).
Moreover, the fiscal structure of Phoenix and other municipalities in the area is heavily dependent upon sales taxes, including a sales tax on new construction.Footnote 28 This is a one-time tax and a large proportion of the revenues historically came from building new subdivisions in outlying areas. In some municipalities, these one-time revenues were used to pay ongoing operating expenses, such as salaries of firefighters or police officers.Footnote 29 To the extent that this occurred in Phoenix, central city residents also may have been partially subsidized by those in outlying areas. It is very difficult to assess accurately the distributional consequences of construction sales taxes. Municipal budgets do not identify a distinct geographical location for all expenditures and revenues, and facilities or services may cover several neighborhoods. Frank Fairbanks, the Phoenix city manager, was reported to have told a City Council Work Study Session in 2006 that:
generally speaking, sales taxes pay for operations and bonds pay for capital improvement projects. He said commercial developments are assessed a higher tax ratio which goes towards paying bonds and that because there are more commercial buildings in the central part of the City, more capital projects are paid for by that area. He said more sales taxes are collected in the City's outlying areas versus the central areas, and more of those sales taxes are used for operating expenses. (City of Phoenix 2006)Footnote 30
However, no data were presented to support this statement.
The distributional consequences of development impact fees depend on their incidence. Although a developer or builder pays the fee in the short run, in the long run “the developer strives to shift the cost of the impact fee” (Nelson and Moody Reference Nelson and Moody2003: 5). The incidence ultimately can fall on the seller of raw land, developer of finished lots, builder of homes, or buyers of homes.
When the demand for buildable land is inelastic (relatively insensitive to changes in price) and the supply of raw land elastic (relatively sensitive to market change), forward-shifting is likely to occur and it will be home buyer who pays much of the fee. When demand for buildable land is elastic and supply of raw land is inelastic, backward shifting is likely to occur and it will be the seller of raw land that pays the fee in the form of lower prices. (ibid.: 6)
Yinger (Reference Yinger1998) found that development fees led to a drop in the cost of land even when the developer's benefits outweighed the costs. Mobility of housing consumers implied they would bear no burden in excess of infrastructure benefits they received. Developers’ mobility ensured they would bear no burden in competitive housing markets. Impact fees not only protected existing residents from the cost of new infrastructure but also effectively gave them a property tax cut due to the expansion of the property tax base. One-quarter or more of the burden of these fees could fall on the owners of undeveloped land.
Huffman et al. (Reference Huffman, Nelson, Smith, Stegman and Nelson1988) concluded that residents of new and existing housing ultimately paid the fees in the long term in the form of higher purchase prices and rents, or lower housing quality. They argued that developers’ profits in a competitive economy cannot be reduced without developers curtailing production until demand exceeds supply and necessary profit levels are restored. However, they do not explore the possibility that markets are not perfectly competitive. Similarly, the Impact Fee Handbook prepared for the National Association of Home Builders asserted that homebuilders’ profits do not bear the burden of impact fees, because “home building is widely recognized as a competitive industry” (Development Planning and Financing Group 2008: 26). They concluded that residential developers have difficulty passing impact fees to landowners, instead passing them to home buyers in the form of higher prices.
It is interesting that this argument seems to imply that the strong opposition of some homebuilders to impact fees should be attributed primarily to their concern over housing affordability and not to a concern over their profitability or viability. Richard Mettler, executive vice president of the Home Builders Association of Central Arizona, did highlight affordability in his letter to Phoenix Councilman Bill Parks opposing the adoption of impact fees. However, he also referred to the impact on producers, citing the “devastating” effect the fees would have on “the construction industry's marketing of homes and home prices,” asserting: “For example, if development fees of $8,000 were levied on residential housing. This would escalate the median sales price by $12,000, thereby eliminating approximately 17,000 households—almost 12% of the current number of qualified households [sic]” (Mettler Reference Mettler1987). Further investigation is warranted into the degree of competition in different sectors of the homebuilding industry (differentiated by type of housing product and/or size of firm) and its correlation with the position on impact fees voiced (and pursued through legal action) by each sector.
Huffman et al. (Reference Huffman, Nelson, Smith, Stegman and Nelson1988) offered eight tactics that public officials could employ to reduce negative impacts of development impact fees, including measures to increase the supply of land, reduce uncertainty, and reduce developers’ carrying costs by charging fees when homes are sold, rather than when building permits are issued. Their final recommendation was to make greater use of special assessments rather than development impact fees. “This maintains the policy to shift the financing burden to new development, but allows that burden to be paid over time and at lower than commercial lending rates” (ibid.: 322). They argued that home prices are not as affected by long-term special assessment encumbrances.
Misczynski (Reference Misczynski, Hagman and Misczynski1978) discussed the incidence of a variety of financing devices, including land-value taxes, taxes on gains in property value, special assessments, exactions, and impact taxes. While emphasizing the difficulty of coming up with definitive answers to questions of incidence, he raised the possibility that while special assessments are likely to fall heavily upon landowners, in cases of exactions and impact taxes, owners of undeveloped land may be able to capture a significant subsidy from the city when it constructs improvements such as sidewalks. Homeowners also may receive some of the benefits in the form of lower home prices. He pointed out that developers are likely to prefer special assessments to exactions because a city typically can borrow money on better terms than a developer. However, smaller developers with less access to capital might find it harder to compete in a system of exactions, which could lead to less competition in the housing industry and higher home prices.
Conclusion
In both mid-nineteenth-century Chicago and late-twentieth-century Phoenix, more segmented and privatized methods of funding public infrastructure were adopted. In Chicago, the emergence of a segmented system was driven partly by the desire of wealthier property owners to undertake improvements that might otherwise be blocked by less well-off residents. Residents were not considered to have a right to certain public goods, such as street paving, and a high degree of spatial inequality in provision of public goods was tolerated (Einhorn Reference Einhorn1991). In Phoenix, the Continental Foothills/Tatum Ranch development provided a proximate cause for adoption of development impact fees. Underlying factors included the rise of antigrowth sentiment and possibly the shift to a district system of government. Revenue needs appear to have played a role, although I do not have direct evidence that they were a dominant factor influencing City Council members when the 1987 development impact fee ordinance was adopted. In both Chicago and Phoenix, but especially Phoenix, the use of citywide bond finance along with more segmented methods of finance suggests that there was not a complete transition to a segmented or privatized system.
With the adoption of development impact fees in Phoenix, central city residents and landowners obtained some protection against being charged for infrastructure needed by residents in peripheral areas. Evidence on median income levels and housing unit values in impact-fee and non-impact-fee areas suggests that, other things being equal, impact fees in Phoenix may have increased the progressivity of infrastructure finance. Of course, more progressive methods of financing infrastructure than either special assessments or impact fees are technically, if not politically, feasible, and it is important to keep in mind that impact fees were only one component of the overall system of infrastructure finance.
By the late twentieth century, the list of “necessary” public goods had grown. There was more of a need than in the nineteenth century for someone to pay for the infrastructure of new residents, rather than simply have them go without. The Phoenix City Council, by adopting impact fees, sought to require new residents to pay for infrastructure that had come to be considered essential for all.Footnote 31 There were ongoing controversies, however, in the Phoenix metropolitan area regarding what should be considered “publicly necessary.” A representative of the Arizona Multi-Housing Association stated that
[t]hey understand that the design of development impact fees is so growth can pay its fair share of the burden it imposes on City infrastructure. She is not speaking about fire services or police. It is about things that they do not believe are necessary public infrastructure and cannot afford to absorb the cost of them without a conversation about it; as in Environmental Education Centers, Aquatics, or Community Centers. (City of Phoenix Planning Commission 2008)
A cultural impact fee in Mesa was hotly contested, finally approved in the courts, but then had to be abandoned when it was outlawed by the 2011 state legislation limiting impact fees.Footnote 32
The history of infrastructure finance in Chicago, Phoenix, and elsewhere reveals many efforts by individuals and groups to shift the costs of public goods to others, with shifts occurring over space, time, and social groups or classes. Distributional conflicts also are evident between public- and private-sector actors (municipal governments versus developers and homebuilders). Models that address the provision of urban infrastructure, such as the Tiebout model, would benefit from greater attention to these possibilities for cost shifting and their implications, particularly in growing communities.
In addition to theoretical exploration of cost-shifting behavior, and further investigation of bond financing, several other directions of future research could be pursued. Einhorn suggested a systematic study of nineteenth-century special assessment rolls in Chicago
to determine the degree to which large- and small-scale property owners actually mingled on improved streets at different points in time, thus contributing to a more precise notion of the economic incidence of special assessment, the correlation between magnitude of property holding and demand for public works, and the economic structure of neighborhoods. (Einhorn Reference Einhorn1991: 118)
She thought such a study might have implications for understanding residential segregation as well as provision of public goods. Similarly, it would be useful to learn more about the incidence of development impact fees in Phoenix. Because impact fees involve an intervening agent (the builder), who pays the fee and stands between the recipient of the benefit and the municipal government providing it, questions of incidence are more complicated. They involve industrial organization and conditions of competition in the property development and homebuilding industries.
Also interesting would be investigation of the historical evolution of ideas about what are “publicly necessary” goods and about acceptable levels of spatial inequality in the provision of urban infrastructure. The question of whether urban infrastructure should be financed by individual beneficiaries, or by the community as a whole, leads into wider questions about what constitutes the public interest, and what types of urban infrastructure contribute to the good of “the city as a whole.” These questions cannot be fully addressed without exploring the extent to which nineteenth-century Chicago, or twentieth-century Phoenix, is accurately characterized as dominated by an urban growth coalition, whose members sought to advance their land-based economic interests.
A final promising line of inquiry would be research on the effects of the adoption of the district system in Phoenix, and on voting records of City Council members from different districts. Did City Council members in districts where development impact fees would be assessed vote differently from members in other districts on proposals to adopt or raise fees? Can the impact of neighborhood groups and/or environmental groups concerned about sprawl be identified as important influences on City Council members voting on development impact fees? How and when did developers and homebuilders seek to influence City Council and state legislative decisions, and what determined the level of government in which they sought to affect the “rules of the game” shaping their capitalist accumulation?
Answers to these questions would provide further insight into understanding who paid, who benefited, and who decided in the city of Phoenix, and would also allow additional comparisons with the political economy of infrastructure provision in nineteenth-century Chicago. Similar investigations could be undertaken for other municipalities in the Phoenix metropolitan area, some of which were growing even more rapidly than Phoenix prior to the collapse of the housing boom. The idea of a “fiscal life cycle,” in which methods of municipal finance change as young, booming cities evolve into older ones, could be explored for cities both within the Phoenix metropolitan area and elsewhere.