

Attempts to explain the financial crisis of 2008 brought the key themes of comparative political economy to the world at large. ‘Global imbalances’ between export-oriented and domestic demand-driven economies featured in popular explanations and reflected differences between countries long-articulated in the comparative study of advanced economies. Highly financialized, consumption-oriented, highly indebted economies such as the US and UK contrasted with export-oriented countries – including other advanced economies such as Germany. Popular and scholarly accounts shared a narrative of the ‘liberal model’Footnote 1 in the boom: these countries relied on domestic consumption to fuel economic growth and on household debt to fuel consumption. In this, they contrasted with coordinated economies whose export-oriented strategy provided the goods to be bought and the capital borrowed to buy it.Footnote 2 The political necessity of this (ex-post, unsustainable) dynamic in the liberal countries was that debt expansion was the only way to maintain the living standards of the politically important middle classes in the context of increasing inequality.
This characterization, and in particular the pathologies ascribed to the liberal model, permeated the political as well as the academic sphere. For example, in his 2011 budget speech, UK Chancellor George Osborne described the pre-crisis situation in Britain in precisely these terms: ‘We gambled on a debt-fuelled model of growth that failed’ (Hansard 2011). No doubt this account is thus familiar to the reader. In this article, I document that it is not, in fact, true. Using comparative cross-national data from the Organization for Economic Cooperation and Development (OECD) and Comparative Manifesto Project database, I show that there is no evidence of distinctive liberal economy levels or increases in household indebtedness in the boom years from 1995 to 2007. Neither is there any evidence that politicians maintained support for the liberal strategy by claiming credit for the expansion of borrowing, when considered in comparative perspective relative to other countries.
There are differences between the liberal and coordinated models, however, which may have driven the inaccurate perception. In particular, the growth of the financial sector has been much more pronounced in liberal than coordinated economies. This suggests a perhaps more cynical explanation of the ongoing survival of the liberal growth model, rooted more in the interests of producers than in its ability to deliver economic growth to voters. As such, some of the economic conventional wisdom survives empirical scrutiny: there are differences between liberal and coordinated regimes in terms of financialization, even if not in terms of household debt. However, the political mechanism by which these regimes are sustained needs to be reconceptualized in light of the empirical evidence. In addition, the role of irresponsible household borrowing in driving the crisis has been overstated.
The Liberal Growth Model
The financial crisis led to increased attention on the macroeconomic strategies of advanced industrial economies, and especially on the perceived pathologies of Anglo-American policy choices in this regard (Gamble Reference Gamble2009; Hay Reference Hay2011; Rajan Reference Rajan2010). However, much of the newfound attention echoed existing accounts in emphasizing the distinction between the ‘liberal’ economies of the English-speaking OECD, and the coordinated, export-oriented strategies of northern Europe in general, and Germany in particular.
As will already be clear from the language of comparing liberal with coordinated regimes, I examine the role of private debt through the lens of varieties of capitalism and its descendants both recognized and implicit (Hall and Soskice Reference Hall and Soskice2001). In particular, debt is not the only motor for growth in the liberal model. A global imbalance in investment flows, fuelling rising asset prices in liberal countries, has also been highlighted as a driver of consumption (Iversen and Soskice Reference Iversen and Soskice2012). As this variety of capitalism literature is voluminous, broad and well-known, I provide only a brief discussion of the aspects most relevant to household debt.
Economics
The liberal growth model is a particular response to the question of how to deliver economic growth in the context of post-industrial capitalism. Two complementary mechanisms point towards the ‘demand side’ expansion of household borrowing in liberal economies. First, liberal economies rely on domestic demand to drive economic growth (while coordinated markets rely on export-driven growth) (Iversen and Soskice Reference Iversen and Soskice2010). Second, types of innovation, and especially the distribution of skills and the (lack of) institutions for coordination in wage bargaining, mean that economic growth in liberal economies is much less equally distributed than in coordinated economies (Iversen and Stephens Reference Iversen and Stephens2008; Rueda and Pontusson Reference Rueda and Pontusson2000). The unequal distribution of the benefits of growth mean that average incomes have been relatively stagnant under the liberal growth model; in light of the reliance of the model on domestic consumption, this is problematic for growth. Expanding borrowing facilitates ongoing increases in aggregate demand. This dynamic is further reinforced by weak welfare state provision in liberal economies (Soskice Reference Soskice2007) and the resulting stabilization regime of ‘privatized Keynesianism’ (Crouch Reference Crouch2009).
The second element of the liberal versus coordinated difference in debt appears on the supply side. Arm’s-length financial contracting was highlighted as a critical element of the liberal model in the original varieties of capitalism formulation (Casper Reference Casper2001; Hall and Soskice Reference Hall and Soskice2001: 7; Vitols Reference Vitols2001). The observation that the financial sectors of the UK and US have grown more quickly than other countries has been explicitly linked back to differing varieties of capitalism (Kalinowski Reference Kalinowski2013). The large, powerful financial institutions of the liberal countries, competing in a low-interest rate environment, were driven to seek high returns through increasingly risky loans. While many such risky strategies involved lending within the financial sector (Thompson Reference Thompson2013), the underlying risks distributed through the financial sector originated with extended loans to consumers in general, and mortgage holders in particular (Rajan Reference Rajan2010). The proliferation of different types of debt among consumers (such as consumer credit, equity loans, certain types of mortgage finance) is an interesting element of this development, but in the context of the liberal versus export-oriented distinction each of these types of debt instrument plays a similar role in the theoretical argument: demanded by consumers and facilitated by liberalized financial sectors. As such I do not distinguish between different types of consumer borrowing here, although this is an obvious avenue for future research.
So, at least, goes the argument. Crudely put, in the liberal model growth relies on consumer demand, but average wages stagnate. Thus consumer demand relies on household borrowing, facilitated by the same rules of corporate governance that give the liberal market economies a comparative advantage in high-risk innovation. This narrative has been reinforced by single-country studies highlighting the dynamics of growth and debt (Hay Reference Hay2011; Prasad Reference Prasad2012), as well as vivid accounts of increasingly problematic borrowing in liberal countries (Frank Reference Frank2001; Warren and Warren Tyagi Reference Warren and Warren Tyagi2003).
Political Support
The second element of the argument is that not only economic growth, but also political success, depends on the provision of improving living standards to the general population. Thus the expansion of household debt is politically, as well as economically necessary.
The clearest articulation of the ‘mass politics’ argument for household debts underpinning the liberal growth model comes from Barnes and Wren (Reference Barnes and Wren2012). The underlying assumption is that to maintain political support, governments in advanced industrial democracies must secure the support – or at least the acquiescence – of their populations by delivering economic goods. The two key goods provided by the liberal growth model to the lower and middle sections of the income distribution are employment opportunities and credit expansion: wage levels for the majority do not keep pace with growth at the top end (Barnes and Wren Reference Barnes and Wren2012: 309).
This same logic can be seen in accounts of the financial crisis that link the origins of the crisis, in subprime mortgage lending in the US, to deliberate policy choices about the expansion of credit in the face of increasing income inequality (McCarty Reference McCarty2012: 204; Rajan Reference Rajan2010). Krippner (Reference Krippner2011) and Streeck (Reference Streeck2011), although they stress the reactive rather than principled nature of the policy choices that expanded household access to credit, also emphasize the reliance of liberal governments on access to credit as a palliative for increasingly unequal primary distributions of income in the context of economic liberalization.
The theoretical logic implied by all these treatments follows from two core assumptions. First, in contrast to export-oriented strategies, the fruits of liberal economic growth accrue primarily to a very narrow segment of the population. Second, political processes in democratic systems cannot allow for the persistent neglect of the broad segment that is excluded from liberal growth. Combined with the corollary observations that financial market development in liberal economies is more advanced than in other countries, and that household debt in liberal regimes has increased rapidly in recent years, a simple political story emerges: liberal regimes maintain support from the masses (necessary from the second assumption) by expanding credit, especially to lower-income households, which offsets the negative distributional impact of liberal growth and distinguishes liberal economies from coordinated regimes.
Export-oriented Growth Compared
In contrast, coordinated, export-oriented models of economic growth place less emphasis on external equity financing for business investment, relying more on retained earnings and long-term banking capital. The relative underdevelopment of financial intermediaries and the institutional portfolio investors dominant in liberal market economy equity markets means there is less pressure to seek high returns by extending increasingly risky loans, including those oriented towards household borrowing. Equally, in virtue of coordination with employees within firms and, more importantly, between capital and labour in corporatist industrial relations, as well as more egalitarian distributions of skills, coordinated capitalism delivers more egalitarian economic benefits (Iversen and Stephens Reference Iversen and Stephens2008; Rueda and Pontusson Reference Rueda and Pontusson2000). Thus, both on the supply side and on the demand side, the critical drivers of expanding household debt are not present in the coordinated economies.
The theoretical framework at issue here is the utility of this varieties of capitalism distinction in understanding the origins of the 2008 financial crisis. The critique is different from the more general critique of the varieties of capitalism typology (and typological explanations more broadly) made by Ahlquist and Breunig (Reference Ahlquist and Breunig2012), who argue that there is only weak evidence for the varieties of capitalism theory’s expected grouping. Their argument is that the characteristics of countries, across different areas, do not hang together as expected. The empirical question here is rather whether a specific distinction made with reference primarily to two issues (financial markets and consumer borrowing) differentiates the two varieties of capitalism regimes.
It is important to highlight the limits of this critique. What is at issue is the distinction between liberal and coordinated market economies on this particular question, during the ‘great moderation’ that preceded the crisis. The idea that different countries may have different political economies, and that the political and economic dimensions evolve together, is not at issue. Nor does the investigation challenge the idea of nationally specific economic regimes, such as those outlined by ‘social structures of accumulation’ (SSA) theorists (Kotz et al. Reference Kotz, McDonough and Reich1994). The question posed here is not whether the financial crisis can be seen as part of a systemic crisis of a neo-liberal ‘social structures of accumulation’ theory, but rather whether that theory was common to those countries referred to as ‘liberal’ in the varieties of capitalism literature, and distinct from other types of growth model (Kotz Reference Kotz2009).
Thus as well as the particular politics of household debt associated with the liberal model, there is a presumption of difference between liberal regimes and their coordinated counterparts. The notion of household debt finance both differentiating the liberal model from its coordinated economy foil and providing the mechanism whereby ordinary voters’ support for economic policy decisions is secured in liberal countries, has become accepted wisdom without even quite simple exposure to empirical scrutiny.
The Liberal Model In The Empirical Data
In this section I take these theories to the data. First, the particularity of the liberal model, as contrasted to export-oriented growth strategies, implies that there should be systematic differences in household indebtedness between country types. Liberal regimes should have higher levels of household debt than their export-oriented counterparts. These differences should be increasing over time: that is, annual increases in debt should be higher in liberal regimes than others (and, in particular, than in coordinated regimes). Second, based on the ‘mass politics’ argument, the distinction between growth models should be reflected in politics. This should translate into distinct sets of election promises in liberal as compared with coordinated economies. In this section, I seek evidence of these patterns in the empirical record.
The empirical approach that I take is a simple one, following the simplicity of the empirical hypotheses. I present the contrasts between liberal and coordinated regimes, and their evolution over time, in a series of graphs.Footnote 3 Importantly, the conventional wisdom for which I seek evidence is not an obviously causal story: there is no particular argument that leads us to expect liberal regimes to have higher household debt only because they are liberal regimes. Rather, the argument is one about equilibrium relationships and thus lends itself directly to the simple investigation of correlations.
Levels and Evolution of Household Debt: A Liberal Pathology?
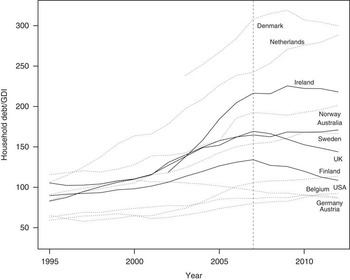
The first set of empirical questions concerns differences in the economies of liberal and export-oriented regimes. Specifically, is household debt any higher under the liberal growth model? Figure 1 addresses this question using data from the OECD between 1995 and 2014 (OECD 2014a). As noted above, this aggregate measurement of debt, without differentiation between mortgage, credit card or equity loans, for example, is more appropriate to the theoretical dynamics in question, in which these different types of instrument should all be demanded in greater quantities by consumers in liberal countries and provided in greater quantities there thanks to more liberal financial regulation.
Household Debt in Liberal and Export-oriented Countries Source: Author’s calculations based on OECD (2014a). Note: The dashed vertical line indicates the onset of the financial crisis. Liberal regimes are indicated by the solid lines; export-oriented regimes by dotted lines.

Figure 1 shows that while there has been a general increase in the level of household indebtedness over the past 20 years, it is far from clear that this is a phenomenon associated with liberal regimes. As far as household debt is concerned, it does not seem that the liberal versus coordinated distinction captures any systematic variation. While the countries with the lowest levels of household debt are export-oriented, so too are the two countries with the highest levels, Denmark and the Netherlands. In terms of increases, too, the rise of indebtedness in Denmark almost exactly parallels that in Ireland, the poster child for liberal borrowing profligacy.
These same findings are reinforced by the statistical analyses. Comparing liberal with coordinated economies, and accounting for the common trend towards greater debt over time, there is no statistically significant difference between liberal and coordinated countries. Compared with all OECD countries, liberal countries do exhibit a discernibly higher level of debt, but the effect is much reduced when we control for whether the country is among the advanced industrial ‘usual suspects’.Footnote 4 Equally, the liberal debt ‘advantage’ is halved again in size when the comparison is restricted to liberal versus coordinated economies (including only advanced industrial economies, and excluding the hybrid cases of France, Greece, Italy, Japan, Luxembourg, Portugal, Spain and Switzerland). In particular, France, Italy and Greece have lower levels of household indebtedness than both the export-oriented and liberal groups, while Spain and Portugal do not look distinctly different from the ‘high middle’ countries: Ireland, Norway or Australia, for example. The relevant comparison in terms of the liberal growth model, however, is between the ‘Anglo-liberal’ countries and their export-oriented counterparts: here there is no statistical difference in the levels of household indebtedness.
Perhaps the comparison of levels of debt misses divergent dynamics under the two growth regimes. That is, it is not so much the level of household debt that should concern us, but rather its trajectory over time: as liberal economies continue to inflate demand by increasing borrowing. Construed this way, the important feature of Figure 1 is the slope of the lines, not their level. These are somewhat harder to read from the chart, but again there is no statistically discernible difference between the two types of country. In liberal regimes, each year adds an average of five percentage points of GDI to household debt; but in coordinated regimes that figure is six and a half percentage points. There is no evidence of an interaction between liberal regime and the effect of the passage of time, and in this case the null result holds whether comparing liberal economies to all the OECD countries for which data are available, whether or not we control for membership in the advanced industrial group, or whether we simply compare liberal to coordinated regimes.
Thus we see no evidence in the empirical record of any systematic difference in household debt dynamics between liberal and coordinated economies. However, the figure indicates indirectly how the conventional wisdom may have emerged. Contrasts of individual countries (the US and Germany, for example) or a focus on single-country trends in liberal countries (such as the massive rise in household indebtedness in Ireland) in the run-up to the crisis may have suggested patterns which have then been inappropriately generalized to the level of growth models.
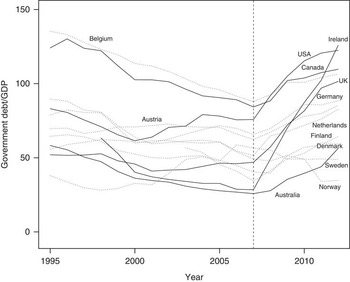
Government debt. A defender of the debt distinction between the liberal and export-oriented models might protest at our focus on household debt here. If the mechanism for debt-driven consumption demand is indirect, it could be that liberal governments assume extra debt according to these dynamics (rather than the households themselves). Thus public debt positions should be expected to differ and diverge across growth models. Figure 2 indicates that this objection, again, does not stand up to scrutiny, at least as far as the pre-crisis data are concerned. In fact, here the liberal countries are rather lower in their debt to GDP ratios; with the exception of the US, they also show consistent downward trends in indebtedness over the period in question. This was a period of rising inequality, which in principle should have spurred debt-driven demand policies. To avoid repetition, I will not discuss the statistical results associated with the government debt to GDP ratio here; the interested reader is referred to the online Appendix (http://dx.doi.org/10.1017/gov.2015.17).
Government Debt in Liberal and Export-oriented Countries Source: Author’s calculations based on OECD (2014a). Note: The dashed vertical line indicates the onset of the financial crisis. Liberal regimes are indicated by the solid lines; export-oriented regimes by dotted lines.

The focus on government debt does allow us to investigate – in this instance – one potential problem with using debt data to assess the claims of the growth model literature: that the data used here are not strictly ‘structural’ debt levels. It is not clear that the structural rather than total debt levels are appropriate for the analysis (if the nature of the liberal growth regime is in fact one based on privatized Keynesian demand smoothing; Crouch Reference Crouch2009). However, if debt (as consumption smoothing) is a general but cyclical trend, while the liberal growth model entails a secular and structural increase in debt, then the aggregate debt figures will mislead to the extent that the business cycles of the countries in question diverge. To my knowledge, there are no estimates available of cyclically adjusted debt figures for households. However, in the case of government indebtedness, which plays the same role in the theoretical account at issue here, the failure of the liberal indebtedness argument holds when we use cyclically adjusted deficits (rather than unadjusted debt) as our measure. The analyses in the online Appendix indicate that liberal regimes on the whole had larger (cyclically adjusted) surpluses (or smaller deficits) in the period 1995 to 2008, when compared with the full OECD sample; there was no difference in levels between liberal and coordinated regimes. There is some evidence that deficits increased more quickly in liberal regimes – particularly compared with export-oriented countries. Overall, then, it does not seem that cyclical adjustments can fully save the theory at hand. This is particularly important since it is not entirely clear whether the argument itself is about structural or total indebtedness.
I note in passing, and the online Appendix also contains detailed tables, that looking at the total indebtedness of the private sector, or the economy as a whole, does not yield substantively different results. The one exception to this is that liberal economies do have higher levels (but not discernibly higher increases) in total debt: this disparity is driven by the higher levels of financial corporation debt (which is not included in the measure of private debt) in liberal economies. I will return to this issue later.
The Politics of Growth Models in Liberal versus Coordinated Countries
The second part of the argument made about the liberal growth model in the run-up to the financial crisis is that household debt, secured against rising asset prices, was ‘the social policy corollary of the new growth model’ (Hay Reference Hay2011: 7). The argument, as outlined above, is that politicians in liberal regimes encouraged households to take on debt to maintain both demand and public support as the state withdrew from direct provision. Again, however, these arguments are typically based only on considering developments in policy within one liberal regime (usually the US or Britain). The argument has an implicit comparison group, though, in other growth models in general, and export-oriented regimes in particular. We should expect politics under these regimes to look different – that is, not to emphasize demand, but to remain focused on the key public policy elements of the coordinated growth model: technical training, regulation and corporatist industrial relations. In this section I examine the extent to which this is true. That is, are there differences in the growth models that political parties have ‘sold’ their general populations?
To examine this question, I use data from the Comparative Manifesto Project database (Volkens et al. Reference Volkens, Bara, Best and Budge2013). These widely used data are based on coding parties’ election manifestos according to whether they mention particular issues. The Comparative Manifesto Project’s focus on the emphasis given to each policy area was developed to capture issues of salience (Budge et al. Reference Budge, Klingemann, Volkens and Bara2001; Klingemann et al. Reference Klingemann, Volkens, Bara, Budge and McDonald2006). This makes the data better suited to my purpose here than perhaps many other applications, where criticism of the data has been quite widespread (Gemenis Reference Gemenis2013). Specifically, the appropriateness of using the manifesto data to measure party positions – particularly on the ‘left–right’ dimension – has been widely criticized (Dinas and Gemenis, Reference Dinas and Gemenis2010). However, the theoretical claim of interest here does not concern this generic location, but rather the ‘raw’ data of the Comparative Manifesto Project: how many times policy areas associated with liberal growth versus those associated with export-oriented growth (as outlined by the economic theory) are mentioned in the two types of country. If a (governing) party has enacted policies in accordance with the growth model and seeks to claim credit to maintain voter support for that model, this should be reflected in the manifesto data.
In the context of the two claims about the distinct growth models, then, we should expect in particular that politicians in liberal countries claim credit for their demand-side interventions: their role in maintaining both the purchasing power of consumers and in the part played by these policies in securing economic growth. By contrast, the importance of demand management and free-market policy in coordinated regimes should be lower, as these are not the policies that ensure (middle-class) income growth and thus popular support, in this context. Conversely, policies associated with export-led growth should receive greater emphasis in countries where these are the ‘model’ for growth which voters are expected to reward. One of the major concerns about the Comparative Manifesto Project data – the use of the left–right scale – is obviated in this application because we do not use that measure: the details of the liberal and export-oriented growth measures are given in the online Appendix.
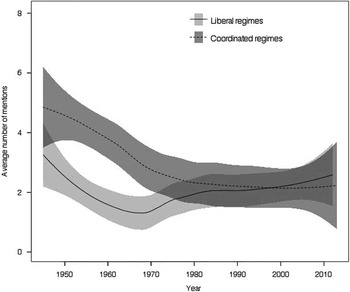
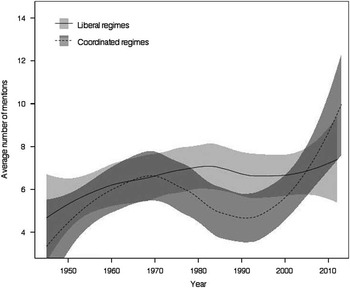
Figures 3 and 4 show the average number of mentions (per manifesto) of each growth regime, in liberal and coordinated countries since 1945. The liberal growth model itself (Figure 3) is initially more salient an issue in the coordinated countries. Since the mid-1970s, though, there is no difference in the salience of the liberal model across regime types, with the liberal countries increasing, and coordinated countries decreasing, to converge.
The Salience of Liberal Economic Policies in Election Manifestos Source: Author’s calculations based on Comparative Manifesto Project data (Volkens et al. Reference Volkens, Bara, Best and Budge2013). Note: Grey shaded areas indicate 95 per cent confidence intervals around fitted lines.

The Salience of Coordinated Economic Policies in Election Manifestos Source: Author’s calculations based on Comparative Manifesto Project data (Volkens et al. Reference Volkens, Bara, Best and Budge2013). Note: Grey shaded areas indicate 95 per cent confidence intervals around fitted lines.

Nor is there any more evidence that the policies associated with coordinated, export-oriented growth differ in their salience across regime types. The confidence intervals surrounding the estimates of the averages over time are overlapping in all periods and, again, when they are closest to being distinct, the direction of the difference is the opposite of what the theory would predict: declining mentions of coordinated growth policies in the 1980s occurs in the coordinated countries rather than the liberal.
There are, though, a set of limitations of the Comparative Manifesto Project data which are relevant for these results. Uncertainty in the estimates generated by a lack of reliability in the coding of the (quasi-)sentences or by the use of proxy documents in place of manifestos is not taken into account in the data (Benoit et al. Reference Benoit, Laver and Mikhaylov2009; Gemenis Reference Gemenis2012). However, to the extent that the errors are random for the issue areas I am interested in, the addition of uncertainty around each (party salience) estimate will serve to increase variation in each country, and thus in each regime. This will increase uncertainty around the regime estimates and further reinforce the finding of no difference.
Discussion: Macro-Models And Elite Politics
In the years leading up to the crisis, then, there is little evidence of the specific mechanisms of consumer debt working as a palliative to keep voters happy with an Anglo-liberal economic growth model that otherwise offered little advantage to average citizens – at least, not such a model that differentiated liberal economies from their other advanced industrial peers, or from coordinated market economies more narrowly construed. Nor can we discern systematic differences in the policy pronouncements made by political parties in the two types of country on issues most closely linked to the purported differences in growth models. Should this be taken to imply that the distinction between these two types of political economy is invalid?
In this section I make the case against throwing the economic model baby out with the mass politics bathwater, and I highlight important questions for future research. First, there are important differences between the organization and the trajectory of the liberal and coordinated economies: they just do not concern (household) debt in the way that has been argued. In particular, the growing importance of the financial sector to liberal market economies is supported in the same kind of analysis that has undermined claims made about debt-financed growth, above. This raises an important question about the political side of these growth models: if liberal regimes do not generate voter support through debt-financed consumption, (how) do they do so?
The necessary political support for (liberal or coordinated) growth models may lie not with voters, but rather on the supply side, with producers’ interests. Although necessarily speculative at this stage, a logical political explanation of the observed economic differences is the weight of financial sector interests in political decisions in the liberal market economies. This could explain the political stability of a growth model which provides few benefits to the median voter.
Evidence of Distinct Advanced Industrial Growth Models
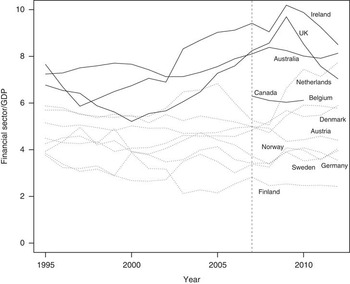
Liberal economic regimes are different from their coordinated counterparts in some ways which do point to different strategies for growth. In particular, the importance of the financial sector to economic output is both higher in the liberal economies, and more obviously increasing both in the lead-up to the financial crisis and subsequently. These characteristics are illustrated in Figure 5, where the four liberal economies for which the OECD (2014a) provides data have four of the five highest financial sector shares in GDP. Data from the US are not available in this form but estimates of the financial sector in US GDP indicate that it would reinforce this pattern: starting at levels around 6 per cent in 1995 and increasing to over 8 per cent by 2009 (Greenwood and Scharfstein Reference Greenwood and Scharfstein2012).
The Share of the Financial Sector in the Economy Source: Author’s calculations based on OECD (2014a). Note: The dashed vertical line indicates the onset of the financial crisis. Liberal regimes are indicated by the solid lines; export-oriented regimes by dotted lines.

A more precise analysis (see online Appendix) indicates that, averaged across the full time period, finance accounted for almost three percentage points more in GDP in liberal countries than in coordinated; in 1995 this difference was small, but the liberal advantage grew at a rate of 0.14 points each year; by 2010 the predicted gap was over four percentage points. Thus though the account of liberal models’ reliance on household debt does not stand up to empirical scrutiny, the distinction does capture something important about growth regimes.
How can these two claims be reconciled? That is, what is the financial sector doing to grow, if it is not lending to households and non-financial corporations? This is not so difficult to see. First, the international nature of lending and borrowing means that national differences in the scale of the financial industry need not correlate with strong national differences in debt levels. Financial corporations based in liberal economies (particularly in London and New York) have global reach: the debts may be held anywhere (Kalinowski Reference Kalinowski2013). Equally, though, financial corporations facilitate the debts of one another. The high-debt stereotype of liberal economies is more accurate when financial corporation debt is included (see online Appendix): financial corporation debt is higher in liberal regimes, and it increased more strongly there between 1995 and 2007.
This points to a political dynamic different to that outlined by the common narrative. If there are economic actors in the liberal regimes whose support is maintained by the acceptance of high levels of debt, this support is not found among ‘average’ households, but rather among financial sector corporations.
Elites versus Masses: Policy and Political Support
In this context, the absence of different growth model references from party manifestos aimed at the general public is not surprising. The financial sector beneficiaries of these policies have much more direct means of communication with policymakers, and the public as a whole does not benefit directly from the growth policies specific to the liberal model. There are two interpretations of this logic. First, the public are unaware of the specifics of economic policy and financial sector dominance in the liberal model but are able to hold governments to account if their own interests are not served, for example by simply considering their own economic situation, or economic outcomes more generally (Duch and Stevenson Reference Duch and Stevenson2006).
In this interpretation, one might argue that the scale of financialization in itself creates a reliance of the broader economy on the continuation of policies favouring financial interests, and creates an interest in the broader population in the ability of the financial sector to borrow. Equally, instead of claiming credit for the policies required to facilitate the growth of finance, liberal regime politicians might rely only on successful economic growth to court voter support (Iversen and Soskice Reference Iversen and Soskice2012). While there is certainly some merit to these claims, they should not be overstated. Although the share of finance in liberal countries’ economic activity has increased, Figure 5 makes it clear that even at its highest, it accounts for only 10 per cent of output. In the US, which the OECD data do not include, estimates of the size of the financial sector in this period are similar, at around 8 per cent of output (Greenwood and Scharfstein Reference Greenwood and Scharfstein2012). More importantly for the argument about broad-based support, its share of employment is even lower. This peaked in the UK at less than 5 per cent of the employed population (OECD 2014b). More indirect benefits of the growth of finance (for example, the benefits across the economy of the economic growth associated with its rise) are also difficult to reconcile with the stagnating real incomes for the lower half of the income distribution in precisely these liberal countries over this period.
The second interpretation of the lack of evidence of the mass political support nexus of the liberal growth model is less sanguine. Perhaps, rather than an alternative mechanism whereby voters hold politicians to account for the impact of their policy decisions on economic outcomes for the general public, there is no such mechanism. Support for the liberal growth model from the financial sector and those closely associated with it could provide the motivation for liberal policies, with neither need nor possibility for broader democratic responsiveness. Although it is beyond the scope of this article to investigate this possibility fully, this reading is at least consistent with recent studies documenting the responsiveness of policy to the preferences of only the highest income voters (Bartels Reference Bartels2008; Gilens Reference Gilens2005; Hacker and Pierson Reference Hacker and Pierson2005). The credibility of this argument is reinforced by the fact that it is difficult for voters to get (and thus use) information even about aggregate economic performance. That which is available tends to focus on short-term measures (Healy and Lenz Reference Healy and Lenz2014), and voters respond to ‘pre-benchmarked’ reports in the media (Kayser and Peress Reference Kayser and Peress2012), generating further potential for elite influence. To the extent that policymakers avoid accountability to voters, too, they are freer to pursue the interests of particular constituents: in the US there is good evidence that receiving campaign contributions from financial organizations predicted legislator support for the 2008 bank bailout (Green and Hudak Reference Green and Hudak2009), as well as wider claims of government ‘capture’ (Johnson Reference Johnson2009). In the UK and Ireland, too, the available evidence points to the increasing influence of the financial sector in its importance to political party finances (Barnes and Wren Reference Barnes and Wren2012). Finally, many of the policies that abet or hinder financialization are of low salience, with ‘quiet politics’ allowing wide latitude for the pursuit of (financial) business interests (Culpepper Reference Culpepper2011).
Conclusion
In this article I have argued that the conventional wisdom about household debt in liberal market economies does not differentiate the two ‘varieties’ of advanced capitalist growth. Nor do politicians in liberal countries use borrowing differently in their appeals to voters to reconcile them to increasingly unequal economic growth. This is not to say that liberal and coordinated economies are not distinct. Rather, it is to counsel caution against the application of specific theories about inter-firm relationships and public action in particular policy spheres, to macroscopic generalizations at the level of mass politics and popular support for these economic policies. One obvious difference between coordinated and liberal economies concerns the role of finance.
This article makes an important contribution to the literature in comparative political economy in undermining two widely accepted ideas about advanced industrial country politics. It provides important empirical evidence that weighs against dominant accounts of advanced industrial political economy. In some ways, this may seem like a lot to hang on a set of null results. However, in considering evidence directly pertinent to the theories in question, with clear and obvious empirical hypotheses, we can reject the simplest versions of accounts of the crisis that blame politicians pandering to profligate households. The notion that the null results on household debt and political strategies are meaningful results is supported by the substantive conclusions on financial sector debt and financialization.
While there is no evidence that household debt ‘drove’ the liberal model in the pre-crisis boom, liberal and coordinated models do vary in their financialization. That is, liberal and coordinated economies are different; it is only with regard to household (and private) debt that the distinctions have been overstated. Financial corporation debt is the one kind of borrowing which does distinguish the liberal model. Nevertheless this constitutes an important correction: on the one hand, in terms of the ‘morality play’ of the financial crisis (Fourcade et al. Reference Fourcade, Steiner, Streeck and Woll2013); and on the other, in terms of correctly identifying the sources of instability that might lead to repeated financial crises. The take-home message here is that the blame laid at the feet of liberal-economy consumers and mortgage holders has been overstated.
The findings here also raise a number of important questions for future research. First, the absence of evidence that liberal regime politicians even attempt to justify their policy choices to voters echoes concerns about democratic responsiveness. Differences in financialization are consistent with the absence of large differences in political discourse, and with the absence of household debt keeping the masses happy, if popular preferences over economic policy have little impact on political and policy outcomes. This pessimistic conclusion requires better (positive, rather than null) results on what does drive economic policy and political survival in the liberal regimes to be accepted, however.
It also implies that the conceptualization of coordinated consensus democracies as oriented towards producer interests, and majoritarian liberal democracies as more consumer facing may be misguided. It may be that it is always producer interests that matter, but who the dominant producers are varies. Cross-national comparative research into the influence of producers on political behaviour in liberal regimes in this context is a necessary complement to the wide-ranging literature on corporatist interest representation.
Acknowledgements
This work was supported in part by a Prize Post-Doctoral Fellowship at Nuffield College, Oxford. I am grateful to my colleagues there, and to Charlotte Cavaille, Marek Naczyk, Georg Picot and Anne Wren for useful feedback on this project. All remaining errors are my own.
Supplementary Material
To view the online Appendix for this article, please go to http://dx.doi.org/10.1017/gov.2015.17.