1. Introduction
The Linhe Depression is located in the western part of the Hetao Basin, which is distributed in a narrow arcuate shape between the Yinshan fold–thrust belt and the Ordos Basin, and measures more than 400 km in length and 80 km in width (Fig. 1). With the successive discovery of commercial oil flows in well S5 (62.6 m3/day) and well JH2X (10.26 m3/day) since 2018, the Linhe Depression proves to be a hydrocarbon-rich basin developed from the Mesozoic–Cenozoic eras (Fu et al. Reference Fu, Fu, Yu, Yao, Zhang, Ma, Yang and Zhang2018; Zhang et al. Reference Zhang, Zhang, Wang, Liu, Li, Liu, Wang, Wang, Wu and Dan2018). On the basis of seismic interpretation and regional geological background, three models describing the tectonic evolution of the Linhe Depression have been proposed in the span of over four decades. Several scholars (Zhao, Reference Zhao1988; Yang et al. Reference Yang, Li and Cui2005, Reference Yang, Zhang and Meng2017; Cai et al. Reference Cai, Ye and Yang2018) reported the formation of a rift basin by the NW–SE extension from the Mesozoic to Cenozoic eras. However, this model cannot explain the NE-trending inverted thrust faults preserved in the Jilantai Sag. A second group of researchers (Zhang et al. Reference Zhang, Zhang, Wang, Liu, Li, Liu, Wang, Wang, Wu and Dan2018; Du et al. Reference Du, Ding, Jiao, Zhou and Xue2019) proposed a giant pull-apart basin to emphasize the significance of strike-slip movements along the NE-trending boundary faults (Langshan Fault). The last hypothesis attributed the formation of the Linhe Depression to a first phase of contraction during the Mesozoic Era, followed by a second phase of a large strike-slip displacement along the extensional boundary fault (Langshan Fault) during the Cenozoic Era (Zhao et al. Reference Zhao, Guo and Hui1984; Guo & Yu, Reference Guo and Yu1990; Fu et al. Reference Fu, Fu, Yu, Yao, Zhang, Ma, Yang and Zhang2018). However, the pull-apart model and its variations neglect the presence of rift zones 50–80 km wide and > 11 km deep in the Linhe Depression. The absence of a typical flower structure across the seismic sections and the presence of extensional structures, such as the grabens, horsts and rollover anticlines, distributed in all units of the basin indicates that the strike-slip mechanism cannot explain the dynamics of the Linhe Depression (Fu et al. Reference Fu, Fu, Yu, Yao, Zhang, Ma, Yang and Zhang2018). Numerous inverted thrust faults observed in the cross-sections indicate that the Linhe Depression experienced extension after contraction to generate the normal faults interacting with the pre-existing thrust faults (negative inversion) during the Mesozoic–Cenozoic eras.
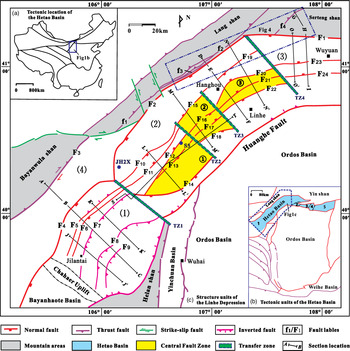
Cenozoic structural map of the Linhe Depression in the Hetao Basin and its adjacent regions showing the main elements. (a) Tectonic map of China showing the location of the Hetao Basin (modified after Liu, Reference Liu1998). (b) Tectonic units of the Hetao Basin (modified after Fu et al. Reference Fu, Fu, Yu, Yao, Zhang, Ma, Yang and Zhang2018). (c) Structural units of the Linhe Depression and its adjacent regions. A–B–C, D–E–F and G–G'–H indicate the locations of the regional sections in combination with the outcrop and seismic sections; J–J', K–K', M–M' and N–N' only indicate the locations of seismic sections. F1 – Sertengshan Fault; F2 – Langshan Fault; F3 – Bayanwulashan Fault; F4 – Wulanaobao Fault; TZ1 – Dengkou transfer zone; TZ2 – Song 5 transfer zone; TZ3 – Zhage transfer zone; TZ4 – Xinglong transfer zone. (1) Jilantai sag; (2) Hanghou Sag; (3) Wuyuan Sag; (4) Jixi Bulge; ① Song 5 fault zone; ② Zhage fault zone; ③ Xinglong fault zone.

Negative inversion is the reactivation in extension of a significant portion of an existing contractional system (Williams et al. Reference Williams, Powell, Cooper, Cooper and Williams1989). The extensional reactivation of originally contractional systems appears to be less common than positive inversion. However, it is generally accepted that pre-existing thrust systems exert an influence on the geometry of the newly formed normal faults (Smith & Bruhn, Reference Smith and Bruhn1984; Malavielle Reference Malavielle1987; Williams et al. Reference Williams, Powell, Cooper, Cooper and Williams1989; Jolivet et al. Reference Jolivet, Daniel and Foumier1991; Del Ventisette et al. Reference Del Ventisette, Montanari, Bonin and Sani2006, Reference Del Ventisette, Bonini, Maestrelli, Sani, Iavarone and Montanari2021). The geometrical relationship between normal faults and pre-existing thrust planes were classified as one of three basic situations: no reuse of the thrust system; partial reuse of single thrust; and partial reactivation of a complex thrust system (Williams et al. Reference Williams, Powell, Cooper, Cooper and Williams1989) (Fig. 2). Faccenna et al. (Reference Faccenna, Nalpas, Brun and Davy1995) used sand box experiments to study the influence of pre-existing thrust faults on normal fault geometry. They observed that normal faults can branch out from thrust faults at depth on a decollement level, or they can entirely reactivate thrust planes with the dip angle change of the thrust faults.
Three basic geometries summarizing the possible relationship between normal faults and pre-existing thrust faults proposed by Williams et al. (Reference Williams, Powell, Cooper, Cooper and Williams1989). (a) Extensional fault cutting crossing the pre-existing thrust system with no reuse of thrust faults. (b) Partial reactivation of a single thrust fault by extensional movements. (c) Partial reactivation of a complex thrust system. Yellow layers indicate synrift extensional sequence.

In order to further understand the evolution of the negative inversion structure in the Linhe Depression, we present the results of field investigation, seismic interpretation and analogue modelling to discuss the origin of the Linhe Depression. We describe the geological settings of the studied area based on literature and our field investigations. We then propose a sequential kinematic evolution of the study area based on both seismic interpretations and outcrop observation. We describe the results of analogue modelling to illustrate the formation of two sags to better constrain the evolution of the Linhe Depression. After comparison with the simulation results, we propose a new model for the formation of the Linhe Depression. This new model will provide additional constraints on the temporal and spatial evolution of intraplate deformation in the Hetao Basin during the Mesozoic–Cenozoic eras.
2. Data and methodology
2.a. Data
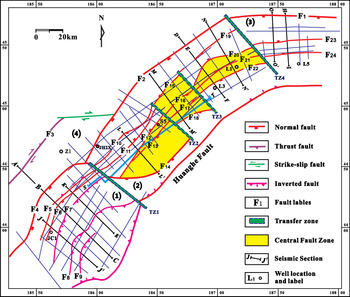
This study is mainly based on two-dimensional (2D) seismic reflection data that constrain major faults and several seismic horizons. The 2D survey of the Linhe Depression covers c. 4900 km, and was carried out over several years. The spaces between the seismic lines are from 4 × 16 km to 6 × 20 km (Fig. 3). Nine seismic profiles that are perpendicular to the strike of the major faults were selected to describe the geometry and architecture of different sags. One cross-section (S–T) that is parallel to the strike of the major faults was selected to describe the geometry of transfer zones. The direction changed to cut across the major fault (F7) at the SE end of the cross-section (S–T). These seismic profiles display data down to 5–7 s two-way travel time (TWT). A total of 14 wells were drilled for oil and gas exploration in the Linhe depression. Seven wells that drilled down to the basement were selected to calibrate the stratigraphic sequence on the seismic reflection (Fig. 3).
Structural map of lowermost Neogene seismic reflections in the Linhe Depression (for the location of the map, see Fig. 1b). A–B–C and D–E–F indicate the locations of the regional sections in combination with the outcrop and seismic sections; J–J', K–K', M–M', N–N', O–O', H–I and other lines only indicate the locations of seismic sections. F1, F2, F3, F4, TZ1, TZ2, TZ3 and TZ4 and (1)–(4) as in Figure 1c.

The outcrop data around the Linhe Depression were collected through the field investigation and measurement. Three field sections (A–B, D–E and G–H) were conducted in the study area. Thin-sections of different rock types were collected to determine the rock composition, and fossil specimens were found to correlate the stratigraphy sequence. Dips or dip angles of fold limbs and fault plane or striae were measured to construct an equal-area, lower-hemisphere stereoplot in the vicinity of cross-sections.
2.b. Methodology
A tectonic stratigraphic sequence and structural map were compiled according to the field investigation and seismic interpretation of the Linhe Depression and its adjacent regions (Figs 1, 4). Twenty-four major faults (F1–F24) were recognized to represent the boundary faults of the basin or normal faults within the depression. Four reverse faults (f1–f4) were identified in the front of the Langshan Belt through field investigation.
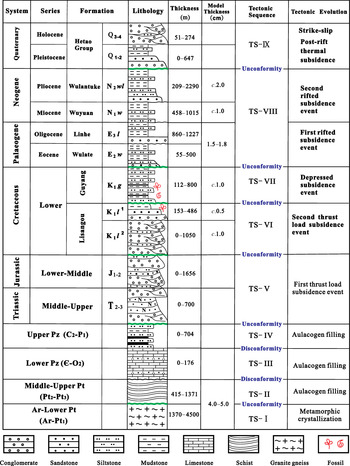
Generalized stratigraphy of the Linhe Depression and its adjacent regions showing the main tectonic evolution (modified after Liu, Reference Liu1998). K1l, K1g, E2w, E3l, N1w and N2wl represent the Lisangou, Guyang, Wulate, Linhe, Wuyuan and Wulantuke formations, respectively. K1l 1 and K1l 2 denote the first and second members of the Lisangou Formation during the Cretaceous Era.

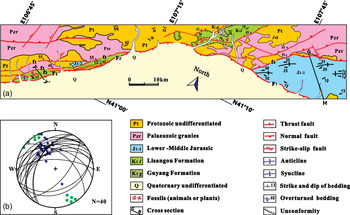
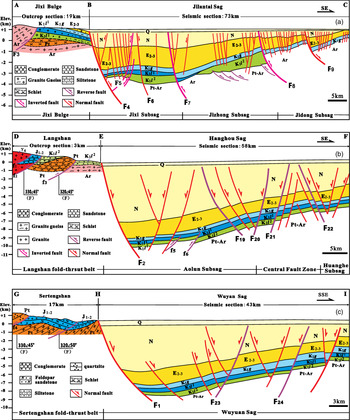
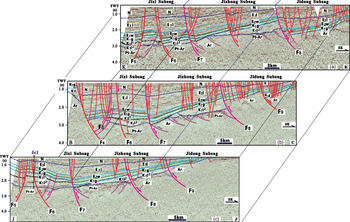
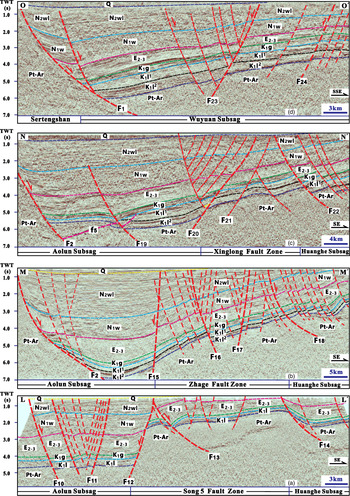
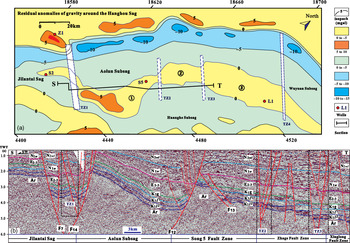
On the basis of striae measurements in the fault gouge or on fault planes and dips of fold limbs in the vicinity of the y–y' and G–H cross-sections, the equal-area, lower-hemisphere stereoplot was adapted to analyse the shortening direction (Fig. 5). According to the measurement of stratigraphic rocks, occurrence and fault azimuth/dip, the sections of A–B, D–E and G–H were compiled. In order to show the whole architecture of different sags, these three field sections were combined with seismic profiles (B–C, E–F and H–I) to form three framework sections (Fig. 6), which were used to provide insights into the relative timing of the deformation and syntectonic sequence for stepwise reconstruction, together with the fault throws in the other seismic profiles (Figs 7, 8). Residual anomalies in the gravity map around the Hanghou Sag were interpreted to show the morphological changes in the Central Fault Zone (Fig. 9). By means of the reconstruction of sequential schematic sections, two negative inversion models were built to indicate the different evolution between the Jilantai Sag and Hanghou Sag from Early Cretaceous time to the present (Figs 10, 11). In order to verify the tectonic evolution of the two sags, four analogue models were devised (Figs 12, 13) to investigate the validity of the evolution process as first proposed in Figures 10 and 11. Finally, we compared the simulation results with nature (Figs 14–20) to establish the new model for the Linhe Depression (Figs 21, 22).
(a) Simplified geological map of the fold–thrust belt from the north part of the Langshan to the Setengshan. Original mapping conducted at a scale of 1:200 000 from NMBGMR (1991). Note that north is directed towards the bottom of the map (for the location of the map, see Fig. 1c). (b) Equal-area, lower-hemisphere stereoplot of data collected in the vicinity of the y–y' and G–H cross-sections. Black lines represent fault planes, blue dots represent striae measurements in the fault gouge or on fault planes, and the green squares represent the poles to the axial planes (modified from Darby & Ritts, Reference Darby and Ritts2007). The average shortening direction is NW–SE (155–335°).

Cross-sections through the Linhe Depression showing the main tectonic units and their deformations (for the locations of the sections, see Fig. 1c). Fault labels as in Figure 1c. Ar – Archean; Pt – Proterozoic; J1-2 – Middle–Lower Jurassic; K1l 1 – first member of Lisangou Formation; K1l 2 – second member of Lisangou Formation; K1g – Cretaceous Guyang Formation; E2-3 – Eocene–Oligocene; N – Neogene; Q – Quaternary.


(a) Residual anomalies of gravity around the Hanghou Sag. (b) Interpretation of seismic section across the transfer zones (for the location of section S-T, see Figs. 9a and 3). Abbreviations as in Figures 6 and 7. N1w – Miocene Wuyuan Formation; N2wl – Pliocene Wulantuke Formation. Fault labels as in Figure 1c.

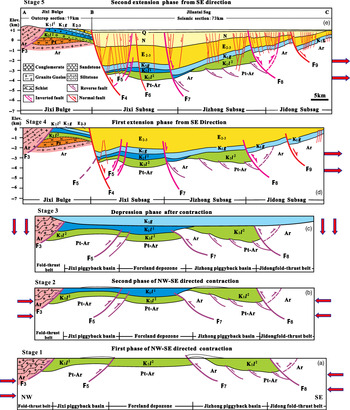
Sequential schematic sections showing the evolution of the Jixi Bulge and Jilantai Sag from Early Cretaceous time to the present. Abbreviations as in Figures 6 and 7. N – Miocene–Pliocene undifferentiated. Arrows show the direction of the stress applied to the section.

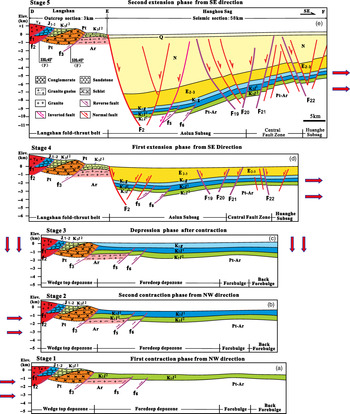
Sequential schematic sections showing the evolution of the Langshan fold–thrust belt and Hanghou Sag from Early Cretaceous time to the present. Abbreviations as in Figures 6 and 7. N – Miocene–Pliocene undifferentiated. Arrows show the direction of the stress applied to the section.

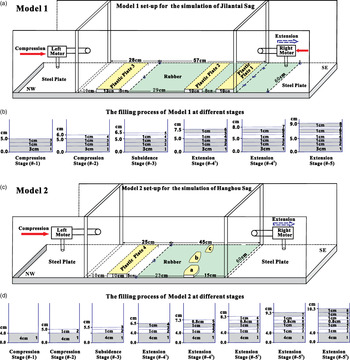
(a) Model 1 set-up showing a 3D view of the deformation rig and its components for modelling the evolution of the Jilantai Sag and Jixi Bulge during Early Cretaceous–Pliocene time. (b) Sketch of the filling process of Model 1 at different stages. (c) Model 2 set-up showing a 3D view of the deformation rig and its components for modelling the evolution of the Hanghou Sag from during Early Cretaceous–Pliocene time. (d) The sSketch of the filling process of Model 2 at different stages. The red solid arrows represent the direction of compression, and the blue dashed arrows represent the direction of extension. a, b, c are plastic blocks representing the morphological changes in the forebulge zone in the basement.

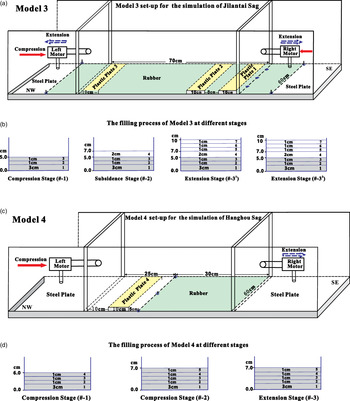
(a) Model 3 set-up showing a 3D view of the deformation rig and its components for comparison with Model 1. (b) Sketch of the filling process of Model 3 at different stages. (c) Model 4 set-up showing a 3D view of the deformation rig and its components for comparison with Model 2. (d) Sketch of the filling process of Model 4 at different stages. Legend as for Figure 12.

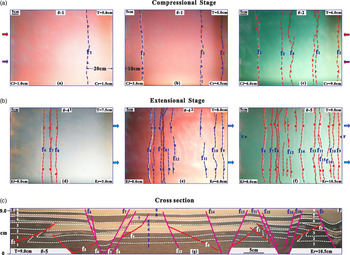
Top view (photographs and line drawings) of different stages of Model 1 to show the evolution of the Jixi Bulge and Jilantai Sag from the compression stages (A) to the extension stages (B). (C) Cross-section interpretations (photographs and line drawings) at the final stage of Model 1 showing the deformation styles (for the location of the section, see Fig. 14f). Cl and Cr represent the compression from the left and right sides, respectively; El and Er represent the extension from the left and right sides; T denotes the total thickness of the sand layers; # denotes the deformation phase of the simulation process; the fault label numbers represent the sequence of the faults developed in the experiment; red arrows represent the direction of compression; and blue arrows represent the direction of extension.

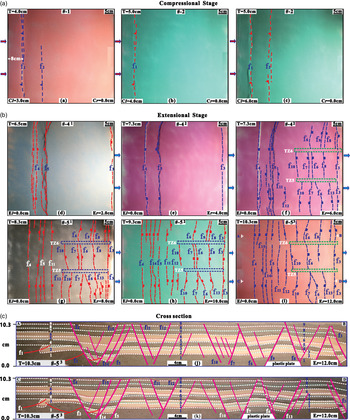
Top view (photographs and line drawings) of different stages of Model 2 showing the evolution of the Hanghou Sag from the compression stages (A) to the extension stages (B). (C) Cross-section interpretations (photographs and line drawings) at the final stage of Model 2 showing the deformation styles (for the location of the section, see Fig. 15i). TZ5 and TZ6 represent the transfer zones and the fault label numbers represent the order of the faults developed in the experiment. Abbreviations as for Figure 14.

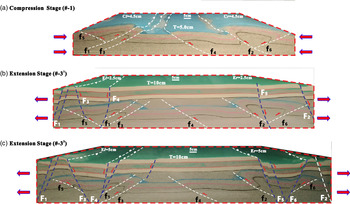
3D view (photographs and line drawings) of different stages of Model 3 to show the evolution of the Jixi Bulge and Jilantai Sag from (a) the compression stage to (b, c) the extension stages. Abbreviations as for Figure 14.

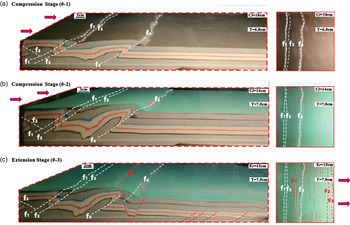
3D view (photographs and line drawings) of different stages of Model 4 to show the evolution of the Hanghou Sag from (a, b) the compression stages to (c) the extension stage (c). Abbreviations as for Figure 14.

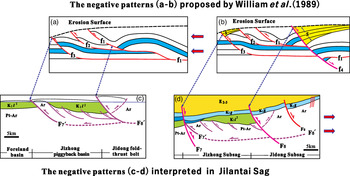
Comparison of negative patterns between the models (a, b) proposed by Williams et al. (Reference Williams, Powell, Cooper, Cooper and Williams1989) and (c, d) the seismic interpretation in the Jilantai Sag. (a) Eroded thrust system; (b) extensional fault cutting cross the pre-existing thrust system with no reuse of thrust faults; (c) thrust system formed in the first stage of compression; and (d) partial reactivation of a complex thrust system in the first stage of extension. S – synrift extensional sequence.

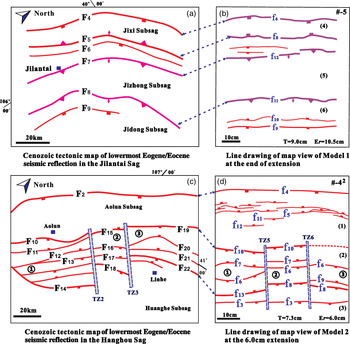
(a) Cenozoic tectonic map of lowermost Neogene seismic reflections in the Jilantai Sag showing the main structural elements. (b) Line drawing of map view of Model 1 at the end of extension (at 10.5 cm extension). (c) Cenozoic tectonic map of lowermost Eocene seismic reflections in the Hanghou Sag showing the main structural elements. (d) Line drawing of map view of Model 2 at the phase of extension (at 6.0 cm extension). Fault names in (a) and (c) as in Figure 3, and in (b) and (d) as in Figures 14f and 15f, respectively. Unit names such as ①–③ in (c) as in Figure 1c. Er represents the extension from the right side; T denotes the total thickness of the sand layers; # denotes the deformation phase of the simulation process. TZ2, TZ3, TZ5 and TZ6 indicate the transfer zones, and (1)–(6) represent the surface topography of the modelling results.

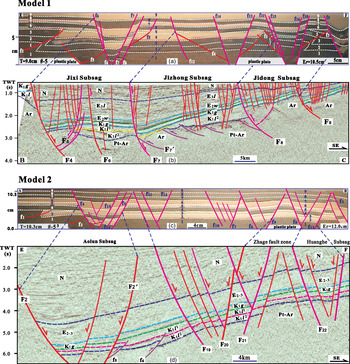
Comparison between modelling results and interpretation of seismic lines across the Linhe Depression. (a) Photograph and line drawing of a cross-section in Model 1 (for location see Fig. 14f); (b) interpreted seismic line across the Jilantai Sag in the Linhe Depression (for location see Fig. 1c); (c) photograph and line drawing of a cross-section in Model 2 (for location see Fig. 15i); (d) interpreted seismic line across the Hanghou Sag in the Linhe Depression (for location see Fig. 1c). Fault names in (a) and (c) as in Figures 14e and 15j, respectively. Fault names in (b) and (d) as in Figure 1c. The stratigraphic names as in Figures 7 and 8.

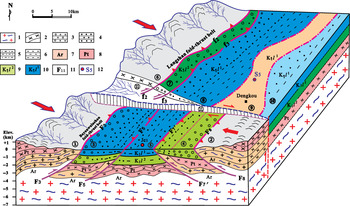
Schematic kinematic model showing the differential compression during Early Cretaceous time based on field observation and seismic interpretation. 1, granite gneiss; 2, schist; 3, conglomerate; 4, sandstone; 5, siltstone; 6, mudstone; 7, Archean; 8, Proterozoic; 9, second member of Lisangou Formation; 10, first member of Lisangou Formation; 11, fault labels; 12, wells. ① – Bayanwulashan fold–thrust belt; ② – Helanshan fold–thrust belt; ③ – Jixi piggyback basin (wedge-top depozone); ④ – Jidong piggyback basin (wedge-top depozone); ⑤ – Jizhong foredeep depozone; ⑥ – Langshan fold–thrust belt; ⑦ – wedge-top depozone; ⑧ – foredeep depozone; ⑨ – forebulge depozone; ⑩ – back forebulge depozone; ⑪ – Dengkou transfer zone. The arrows show the direction of the stress to the Linhe Depression.

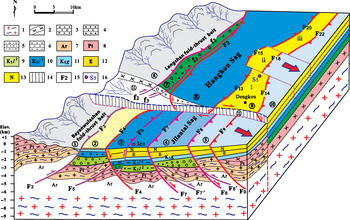
Schematic model showing the negative inversion kinematics from the differential compression during Early Cretaceous time to the SE-directed extension in the Cenozoic Era based on field observation and seismic interpretation. 1, granite gneiss; 2, schist; 3, conglomerate; 4, sandstone; 5, siltstone; 6, mudstone; 7, Archean; 8, Proterozoic; 9, second member of Cretaceous Lisangou Formation; 10, first member of Cretaceous Lisangou Formation; 11, Cretaceous Guyang Formation; 12, Eocene–Oligocene undifferentiated; 13, Miocene–Pliocene undifferentiated; 14 – transform zone; 15, fault labels; 16, wells. ① –Bayanwulashan fold–thrust belt; ② – Jixi Bulge; ③ – Jixi Subsag; ④ – Jizhong Subsag; ⑤– Jidong Subsag; ⑥ – Langshan fold–thrust belt; ⑦ – wedge-top depozone; ⑧ – Aolun Subsag; ⑨ – Central Fault Zone; ⑩ – Huanghe Subsag; ⑪ – Dengkou transfer zone; i – Song 5 fault zone; ii – Zhage fault zone; iii – Xinglong fault zone. The arrows show the direction of the extensional stress applied to the Linhe Depression.

3. Tectonostratigraphy context
The Hetao Basin is bordered by the Yinshan–Yanshan Block to the north and the Ordos Block to the south in China (Fig. 1b) (Deng et al. Reference Deng, Chen, Min, Yang and Ren1999). According to the geophysical and geological data, the Hetao Basin is divided into the following five tectonic units from west to east: Linhe Depression, Wulashan Uplift, Wuqian Depression, Baotou Uplift and Huhe Depression (Fig. 1b). Of the three depressions, the Linhe Depression is the largest and has the deepest Meso-Cenozoic deposits in the northern part (> 10 km). Its northwestern margins are defined by the Sertengshan (F1), Langshan (F2) and Bayanwulashan (F3) frontal faults (Fig. 1c), and its southeastern margins are defined by the Huanghe Fault (Fu et al. Reference Fu, Fu, Yu, Yao, Zhang, Ma, Yang and Zhang2018), which separates it from the Ordos Basin. The strata distributed along the Bayanwulashan–Langshan area in the NW area and the Sertengshan area to the north of the Linhe Depression are ascribed to the Yinshan stratigraphic division in the North China strata, while those distributed in the western area of the Ordos Basin and Helanshan fold–thrust belt belong to the Ordos stratigraphic division (NMBGMR, 1996). Field observations, palaeontological correlation and seismic interpretation have revealed that at least nine tectonic sequences (Liu, Reference Liu1998), including Archean–lower Proterozoic, middle–upper Proterozoic, lower Palaeozoic, upper Palaeozoic, Triassic and Lower–Middle Jurassic, Lower Cretaceous Lisangou Formation, Lower Cretaceous Guyang Formation, and Eocene–Pliocene and Quaternary tectonic layers, developed around the adjacent regions of the Linhe Depression in the Hetao basin (Fig. 4). These tectonic events resulted in unconformities or disconformities between the tectonic sequences and the absence of Upper Ordovician–lower Carboniferous, upper Permian, Upper Cretaceous and Paleocene strata. The Archean and Proterozoic rock units in the Langshan area mainly comprise meta-sedimentary rocks, such as schist, quartzite and marble. Other basement lithologies include granite gneiss and some granitic plutons. These metamorphic rocks, along with the upper Palaeozoic–Triassic batholith thrusting over the Jurassic boulder conglomerate and Cretaceous clastic rocks, led to the formation of the Langshan fold–thrust belt and its frontal foreland basin (Darby & Ritts, Reference Darby and Ritts2007).
The spatially largest exposure of the Lower–Middle Jurassic strata in the northern part of the Sertengshan fold–thrust belt is bounded by the fault f4 trending NE along the northwestern margin of the exposure (Figs 5a, 6c), and it rests unconformably on the crystalline basement of the middle Proterozoic metasedimentary units and Palaeozoic–Triassic batholith. The rock units on the hanging wall of the boundary fault (f4) gently dipping to the NW (dip angle of 20–35°) mainly comprise metasedimentary rocks, such as schist, quartzite and metamorphic sandstone, together with lower Palaeozoic granitoid. The Jurassic strata comprise boulder conglomerate (maximum clast size of 100 cm) and sandstone. Conglomerate clasts include quartzite, gneiss, granitoid and brown sandstone, which were transported directly from the rock units on the hanging wall. In the southeastern Jurassic exposure far from the thrust-fault boundary, the lithology changed mostly to grey feldspar sandstone, siltstone and mudstone with many synsedimentary structures, such as cross-bedding, demonstrating that the direction of the source was from the boundary fault. Folds such as anticline, syncline and overturned folds developed in the Jurassic strata. The sedimentary characteristics of the deposition indicate that the Jurassic strata were synorogenic with respect to the Sertengshan fold–thrust belt. The striae measured on the thrust-fault planes and the poles to axial planes of folds in the vicinity of the G–H cross-section suggest the NW–SE shortening direction (155–335°) (Fig. 5b), which coincides with that of the Langshan fold–thrust belt (Darby & Ritts, Reference Darby and Ritts2007) and Helanshan fold–thrust belt near the western Ordos Basin (Liu, Reference Liu1998).
The Lower Cretaceous units were unconformably deposited on Precambrian metasedimentary basement units (Figs 5a, 6a, b). The presence of progressive unconformities within the Cretaceous units, their local sediment sources and their coarsening upwards all suggest that they were synorogenic with respect to the Langshan fold–thrust belt (Darby & Ritts, Reference Darby and Ritts2007). According to the fossil (e.g. Eosestheria cuneata, E. shilanjiensis, Cypridea unicostata, Lycoptera sp., Rhinocypris foveata, Czekanowskia rigida) correlation found in the rock units, we assigned the Lower Cretaceous units to the Lisangou Formation (K1 l) (Fig. 4). The Langshan fold–thrust belt was therefore active during Early Cretaceous time. However, the initiation age of the Langshan fold–thrust belt deformation is difficult to constrain because the sedimentary units related to the earliest history of the thrust belt are now absent or unexposed. The striae measured on the thrust-fault planes and the poles to axial planes of folds in the vicinity of the y–y' cross-section (Fig. 4b) suggest a NW–SE-shortening direction (155–335°) (Darby & Ritts, Reference Darby and Ritts2007).
The spatially dispersed exposure of the Lower Cretaceous strata along the frontal area of the Bayanwulashan fold–thrust belt comprises purple sandstone and mudstone, as well as dark-grey mudstone interbedded with limestone. We assigned these strata to the Lower Cretaceous Guyang Formation (K1 g) because of the correlation of the fossils, such as Sphaerium jeholense, Tetoria, Cypridea sp. and Kuyangichthys microdus, found in the grey mudstone, which was covered by the Eocene pebble conglomerate and sandstone together with Quaternary alluvial deposits (Fig. 6a). The frontal fault (F3) of the Bayanwulashan cuts through the Holocene alluvial deposits with right strike-slip displacement according to the offset of the drainage system (Dong et al. Reference Dong, Zhang, Zheng, Yu, Lei, Yang, Liu and Gong2018).
4. Architecture of units
The Linhe Depression was previously subdivided into the following six subsidiary-structure units according to the geological features of different blocks: Jixi Uplift, Jilantai shallow Sag, Jidong Slope, Northern deep Sag, Eastern Slope and Southern fault Step (Fu et al. Reference Fu, Fu, Yu, Yao, Zhang, Ma, Yang and Zhang2018). Based on the deformation difference and architecture, we subdivided it into four new secondary structural units, namely: Jilantai Sag, Hanghou Sag, Wuyuan Sag and Jixi Bulge (Fig. 1). The Jilantai Sag and Hanghou Sag were also subdivided into several third-order structure units based on the architecture of the Cenozoic deformation (Figs 7, 8). The seismic reflections and data from wells S5, L1, L3, L5, JC1 and JH2X indicate that the stratigraphic sequence in the Linhe Depression comprises the Lisangou, Guyang, Wulate, Linhe, Wuyuan and Wulantuke formations and the Hetao Group (Fig. 4). The Jurassic, Upper Cretaceous and Paleocene strata are absent in the depression. The Lisangou Formation is divided into two members. The second member (K1 l 2) rests unconformably on the crystalline basement and is truncated by the Guyang Formation (K1 g) in local places or covered by the first member (K1 l 1). The thickness of the Eocene and Oligocene deposits in the Jilantai Sag is larger than that in the Hanghou Sag, whereas the thickness of the Neogene deposits in the Jilantai Sag is lower than that in the Hanghou Sag (Figs 7, 8). The basement of the Linhe Depression is formed of Archean and Proterozoic metamorphic rocks, which are difficult to differentiate because of the low quality of seismic reflections (Figs 7, 8).
4.a. Framework of Jixi Bulge and Jilantai Sag
The Jilantai Sag is located at the SW of the Linhe Depression, and is separated by the Chahaer Uplift from the Bayanhaote Basin in the SW and by the Dengkou transfer zone from the Hanghou Sag in the NE (Fig. 1c). A cross-section (A–B–C) was drawn through the Jixi Bulge and Jilantai Sag by combining the outcrop observation section and seismic profile interpretation (Fig. 6a). The most prominent structures on the cross-section and on the geological structure map are the normal faults dipping steeply to the SE and juxtaposely cutting through all the cover layers and basement to generate a composite half-graben in the Jilantai Sag. The entire half-graben dipping to the NW and mainly bounded by the Wulanaobao Fault (F4) was subdivided into three subsags: Jixi, Jizhong and Jidong (Figs 6a, 7). The Cenozoic layers (E2-3–N2) thickened towards the boundary normal fault on the hanging wall of each half-graben, while the Guyang Formation (K1 g) maintained almost constant thickness across all seismic sections (Fig. 7). These sedimentation characteristics indicate that these normal faults began to activate at the beginning of the deposition of the Wulate Formation (E2 w). Inverted thrust faults are another important structure developed in the Jilantai Sag. The wedge shape of K1 l 2 on the footwall and the absence of an equivalent sequence on the hanging wall indicate that fault F8 is a boundary fault that governs the syndeposition of K1 l 2 (Fig. 7a, b). Meanwhile, the lesser thickness of K1 l 2 in the hanging wall compared with the footwall of F8 in the J–J' cross-section implies that the syndeposition of K1 l 2 was affected by the thrust fault. On the basis of seismic interpretation and field data from Figures 6 and 7, we find that the faults F3 and F5 thrust from the NW to the basin inland, and some faults (F7, F8 and F9) thrust from the SE to the Jilantai Sag. We therefore deduce that the compressional stress originated from both directions because of the Bayanwulashan and Helanshan shortening during Early Cretaceous time (Liu, Reference Liu1998).
The displacement of the layers of the Lisangou and Guyang formations along the fault plane indicates that F8 is a negative inverted fault and that the intensity of the inversion differs along the fault strike. The interpretation of section K–K' shows that the extension displacement is larger than the contraction displacement, thereby causing a complete negative inversion (Fig. 7a). In contrast, interpretation of sections B–C and J–J' reveals that the extension displacement is less than the contraction displacement, thereby causing a partial negative inversion (Fig. 7b, c). Fault F7 has the same inversion feature as fault F8. The thickness of K1 l 1 on the footwall of fault F7 is larger than the equivalent hanging-wall succession where K2 l 2 is eroded in all sections (Fig. 7). However, F9 can only be identified to invert negatively in section J–J' (Fig. 7c). The inverted fault F5 differs from the other inverted faults as it dips to the NW and is cut by the master boundary fault F4 in section B–C. It is the only seismic profile that cuts through the northwestern boundary of the Jilantai Sag (Fig. 7b). The thickness of the Lisangou Formation on the footwall of F5 is much larger than that of the equivalent sequence on the hanging wall. The maintenance of an almost-constant thickness by the Guyang Formation indicates that the compression event occurred mainly during the deposition of the Lisangou Formation. The section (A–B) compiled from field observations indicates that the cover layers on the basement of the Jixi Bulge comprise the Guyang and Lisangou formations, along with a considerably thin Eocene sequence (Fig. 6a). Archean metamorphic rocks thrust over the Lower Cretaceous sedimentary rocks along the boundary fault (F3) that was reactivated during the Holocene Epoch by a dextral strike-slip fault (Dong et al. Reference Dong, Zhang, Zheng, Yu, Lei, Yang, Liu and Gong2018). The conglomerate composition of local sediment sources and the coarsening towards the steep thrust fault suggest that they were synorogenic with respect to the Bayanwulashan fold–thrust belt during Early Cretaceous time. During the Cenozoic Era, the Jixi Bulge was subjected to erosion due to the subsidence of the Jilantai Sag along the master normal Wulanaobao Fault (F4). The frameworks of the Jixi Bulge and Jilantai Sag indicated that they experienced contractional deformation during Early Cretaceous time, followed by extensional deformation during the Cenozoic Era. The current section view therefore shows a negative inversion structure.
4.b. Framework of Hanghou Sag
According to the fault patterns and deposition characteristics, the Hanghou Sag was subdivided into the Aolun Subsag, Central Fault Zone and Huanghe Subsag (Fig. 8). The prominent architecture on the cross-sections and on the structural map (in yellow in Fig. 1) corresponds to the Central Fault Zone, which separates the Aolun and Huanghe subsags. The Central Fault Zone is segmented into three parts by the Song 5, Zhage and Xinglong fault zones from the SW to the NE (Fig. 9). Each fault zone was bounded by two normal faults to form a horst at the centre. The displacement of the horst boundary faults decreased dramatically from the SW to NE (Fig. 8). The thickness of the Palaeogene and Neogene strata increases to over 10 km towards the master fault of the Langshan Fault (F2), and the Guyang Formation remains almost constant on the cross-sections. The extension therefore seems to have initiated during Eocene time. The thickness of the Lisangou Formation on the central horst was less than that on the Aolun and Huanghe subsags. The first member of the Lisangou Formation was truncated by the Guyang Formation at the location where the thrust faults (f5) were also truncated on the cross-sections N–N' (Fig. 8c). The thickness of the Lisangou Formation on the hanging wall was less than that on the footwall of the thrust fault (f5). This difference indicates that the compression event occurred during the deposition of the Lisangou Formation.
The outcrop section (D–E) well exposed across the Langshan area reveals that three NW-dipping (30–50°) thrust faults (f1, f2 and f3) separated the Jurassic or Cretaceous strata from Proterozoic metamorphic rocks to form the fold–thrust belt with forwards propagation to the Hanghou Sag (Fig. 6b). The thrust fault and Cretaceous units were cut through by the boundary normal fault (F2) at the pediment of the Langshan to cause the inversion of the foreland basin (Fig. 6b). The architecture of the Langshan fold–thrust belt and Hanghou Sag illustrates that they experienced compression deformation originating from the NW direction from Early Jurassic time to the Lisangou Formation, followed by extension deformation during the Cenozoic Era. The current profile view therefore shows a negative inversion basin structure.
4.c. Framework of Wuyuan Sag
The strike of the sag and the trending of the fault system in the Wuyuan Sag switched to the E–W direction from the NE–SW direction. The prominent architecture on the cross-sections and the geological structure map is one in which the whole sag is one half-graben governed by the master Sertengshan Fault (F1) dipping to the south (Fig. 8d). Some synthetic and antithetic subsidiary normal faults developed on the hanging wall of the master fault.
The dramatic thickening of the Neogene sequence (N1 w and N1 wl) towards the hanging wall of the master fault suggests that the sag experienced intensive extension at that time. The Jurassic strata on the footwall of the Sertengshan Fault (F1) on the G–H–I cross-section were separated by a thrust fault (f4) from the Proterozoic metasedimentary rocks and intrusion rocks on the hanging wall to form the foreland basin structure (Fig. 6c). Given the absence of cover layers on top of the Jurassic strata, the end of the contraction age since Early Jurassic time is difficult to establish.
4.d. Characteristics of transfer zones
Residual anomalies can be used to analyse the differences of texture and composition in the basements (Shi et al. Reference Shi, Shi, Wu, Gao, Yang, Zhang, Song and Chen2019). The locations with normal anomalies indicate where the igneous rocks of higher density are distributed, while the negative anomalies indicate where the sedimentary rocks of lower density develop (Shi et al. Reference Shi, Shi, Wu, Gao, Yang, Zhang, Song and Chen2019). The characteristics of residual anomalies around the Hanghou Sag show some normal anomalies distributed along the Central Fault Zone and the Langshan fold–thrust belt (Fig. 9a). The locations with normal anomalies confirmed by well data (S5, S2, L1 and Z1) or field investigations consist of granite gneiss or ultrabasic rocks of Archean–Proterozoic age (Sun et al. Reference Sun, Zhang, Hu, Ren, Wang and Zhang2018). The transfer zones of the Hanghou Sag developed in the locations where the trending of the normal anomalies changed or discontinued abruptly. A negative flower structure existing among these transfer zones indicates that they originated from the SE extension together with the formation of Hanghou Sag during Eocene–Pliocene time (Fig. 9b). The transfer zone of TZ1 separated the Jilantai Sag from the Aolun Subsag. The transfer zones of TZ2 and TZ3 did not affect the thickness of the cover layers. Because of the absence of seismic lines across the transfer zone of TZ4, it is not possible to describe its deformation characteristics. As a result of the trending change of the boundary faults and the anomalies, we deduced that a transfer zone (TZ4) should exist between the Hanghou and Wuyuan sags.
5. Differential evolution of the Linhe Depression
The deformation architecture of the Jixi Bulge and Jilantai Sag is different from that of the Hanghou Sag. An exact unravelling of the kinematic history of different units in the Linhe Depression is not easy because of the lack of a long seismic profile across the whole depression and its adjacent mountain areas. Nevertheless, field observations and seismic reflection data can provide insights into the relative timing of the deformation and syntectonic sequence for stepwise reconstruction. As commercial oil flows were found only in the Cretaceous and Eocene strata of the Linhe Depression, we focus on the structural evolution initiated from Early Cretaceous–Pliocene time for the Jilantai and Hanghou sags in order to construct negative inversion models.
5.a. Evolution of Jilantai Sag and Jixi Bulge
We present a reconstruction that represents the evolution of both the Jilantai Sag and Jixi Bulge from the initiation of crustal shortening during Early Cretaceous time to the active extension in the Cenozoic era along the Wulanaobao Fault (F4) on the basis of the geological features along the A–B–C section (Fig. 10).
The first stage in the reconstruction is largely based on the foreland basin strata (K1 l 2) preserved in the field area of the Bayanwulashan fold–thrust belt and the deformation patterns on the seismic reflections of the Jilantai Sag. The key features of this stage include the deposition of two piggyback basins close to the boundary faults (F3 and F8) and the foreland depozone in the central part, controlled by faults F5 and F7 (Fig. 10a). The relatively coarse-grained conglomerate of the Lisangou Formation currently exposed along the boundary of the thrust fault (F3) suggests that it was the initial boundary of the Jixi piggyback basin. The second member of the Lisangou Formation (K1 l 2) present on the footwall but absent from the hanging wall of fault F8 indicates the existence of a piggyback basin (bounded by fault F8) in the east of the foreland depozone at this stage (Fig. 10a). The second member of the Lisangou Formation (K1 l 2) on section J–J' was preserved on the footwall of fault F9, thereby indicating the existence of another piggyback basin (bounded by fault F9) in the east of the Jidong piggyback basin at this stage (Fig. 7c).
The second stage of the deformation comprised the forwards propagation of the thrust belt and the continued development of the piggyback basin. The absence of K1 l 1 in the SE part of the section implies that the uplifting magnitude in the SE direction was much larger than that in the NW direction. This condition caused erosion on the top of the Jidong piggyback basin and deposition of K1 l 1 on the top of the central foreland depozone (Fig. 10b). The superimposed deposition during the two contraction stages resulted in the largest thickness of the Lisangou Formation in the central foreland depozone. As well as the forwards thrust faults, some backwards thrust faults also developed on the hanging wall of the master thrust faults.
The uniformly depressed subsidence dominated Stage 3 deformation (Fig. 10c). The thickness of the Guyang Formation remained almost constant across the whole area with clear reflection marks in the seismic profiles. These characteristics suggest that the depressed subsidence homogeneously occurred after the contraction. The absence of Upper Cretaceous and Paleocene strata between Guyang Formation (K1 g) and Wulate Formation (E2 w) indicates the possible erosion after Stage 3 deposition. The original thickness of the Guyang Formation should therefore be greater than that currently preserved in the outcrop and seismic interpretation.
After Stage 3 and erosion, the foreland deposits were subjected to extension from the SE direction and perpendicular to the plane of the thrust faults to generate the half-graben architecture superimposed on the contraction structure in the Jilantai Sag at Stage 4. The master normal fault (F4) cut off the front part of the Jixi piggyback basin along with the thrust faults (F5) and controlled the Eocene and Oligocene strata to thicken towards the hanging wall of the boundary fault. In the absence of sedimentary marks preserved in the crystalline basement on the footwall of the master normal fault (F4), the exact locations of the original thrust faults (F5) on the footwall of the master normal fault (F4) cannot be identified.
Nevertheless, we can explain why the thickness of the Lisangou Formation between F4 and F5 is less than that in their footwall. A partially inverted pattern is the most important structure developed along the pre-existing thrust faults (F7, F8) to generate new secondary structure units, such as the Jixi, Jizhong and Jidong subsags (Fig. 10d). The displacement of the late extension was less than that of the previous compression along the planes of the faults (F7 and F8). This difference indicates a partial negative inversion structure (Fig. 7).
The last stage (Stage 5) of deformation in the restoration process is the progressive extension from the SE direction based on the first phase extension (Fig. 10e). Numerous subsidiary normal faults with minor displacement in the cover layers developed at this stage. Some of the normal faults, such as F6, F7 and F9, cut through the basement with a relatively large displacement (Fig. 7). The inversion intensity along F8 increased from the SW to the NE, and thereby caused a complete negative inversion structure pattern in the K–K' cross-section (Fig. 7a). Strike-slip displacement occurred along the Bayanwulashan Fault (F3) and Langshan Fault (F2) and resulted in at least four phases of surface rupture during Holocene time (Rao et al. Reference Rao, Chen, Hu, Yu and Qiu2016; Dong et al. Reference Dong, Zhang, Zheng, Yu, Lei, Yang, Liu and Gong2018).
5.b. Evolution of Hanghou Sag and Langshan fold–thrust belt
We present a reconstruction that represents the evolution of the Langshan fold–thrust belt together with the Hanghou Sag from the beginning of crustal shortening during Early Cretaceous time through the intensive extension in the Cenozoic Era along the Langshan Fault (F2), according to the comprehensive features of the cross-section (Fig. 11). The Hanghou Sag and Langshan frontal fold–thrust belt experienced the same evolutionary stages as those that occurred in the Jilantai Sag and Jixi Bulge. However, an obvious difference in the contractional stages is that the direction of compression only originated from the NW direction to generate an associated foreland basin system, as defined by DeCelles & Giles (Reference DeCelles and Giles1996). The wedge top, foredeep, forebulge and back bulge depozone developed progressively from the Langshan fold–thrust belt to the Huanghe Subsag. The thrust faults (f5 and f6) developed at the shortening stages were preserved in sections E–F and N–N' (Figs 8c, 11a). After uniform subsidence in Stage 3 and erosion during Late Cretaceous – Paleocene time, the associated foreland basin system was subjected to two extension stages from the SE direction. The master boundary normal fault (F2) cut off the foredeep depozone along the pediment of the Langshan fold–thrust belt to generate the Langshan Fault (F2). The Neogene strata dramatically thickened towards the hanging wall of the Langshan Fault (F2), thereby indicating that the extension intensity in the second extensional phase (Stage 5) was much higher than that in the first extension phase (Stage 4). The Central Fault Zone developed along the rugged forebulge under the Cretaceous layers and segmented into three secondary units along the NE-trending region (Figs 1c, 9a). Conjugate normal faults developed in the last extensional stage (Stage 5) to form grabens and horsts in the cover layers (Fig. 11e).
6. Analogue simulation of the evolution of the Linhe Depression
6.a. Set-up and kinematics
As the direction of compression applied to the Jilantai Sag originating from both the NW and SE direction was different from that of the Hanghou Sag originating only from the NW Langshan mountain to the Linhe Depression, only one model to simulate their simultaneous development is difficult to devise. In order to illustrate the tectonic evolution of the Linhe Depression, we developed four analogue models and used them to show the validity of the evolution model as first proposed in Figures 10 and 11.
The set-up designed for Model 1 to simulate the evolution of the Jilantai Sag and Jixi Bulge comprised a sandbox measuring 85 cm long and 60 cm wide. The sandbox was driven by two motors from the left- and right-hand sides (Fig. 12a). A thin elastic rubber sheet (thickness of 1 mm) was placed at the bottom of Model 1 and fixed on a steel plate to initiate extension from the right side after compression. Two plastic plates measuring 60 × 10 × 1 cm were placed on the rubber sheet close to the right side to simulate the local granite gneiss located on the hanging wall of faults F7 and F8 in the basement. Another plastic plate measuring 60 × 13 × 1 cm was placed on the steel plate close to the left side to represent the basement granite gneiss at the front of the Bayanwulashan fold–thrust belt. In the shortening stage, the rubber sheet was first fixed on the bottom by two heavy steel blocks at each ends to avoid its movement along the basement, that is, we did not extend the rubber sheet and kept it in a stationary state at that time. Because the shortening amount in the SE of the seismic section (Fig. 6a) is little larger than that in the NW, two mobile sidewalls were made to push inwards at different rates of 0.2 mm/min and 0.3 mm/min for the left and right motors, respectively. Three layers of loose sand (total thickness 5 cm) were sieved at the bottom of the model to simulate the metamorphic sedimentary layers (Table 1 and Fig. 12b). The deformation of the model surface was covered by an additional layer of white sand (thickness of 1 cm) to represent K1 l 2 after the initial 7.5 cm bulk compression from both sides. Two motors were stopped after 15.0 cm of total shortening, and another 0.7-cm-thick white sand layer was sieved on the depressed area of the deformation model to represent the deposition of K1 l 1 after the small amount of erosion of the upper part of the deformation layers on the top of the right side. Thereafter, a 0.8-cm-thick grey sand layer was sieved uniformly on the surface of Model 1 to represent the deposition of the Guyang Formation (K1 g) (Fig. 12b). Following the subsidence, the elastic rubber sheet was attached to the right mobile sidewall, and Model 1 was pulled only from the right side at rate of 0.2 mm/min to simulate the first extensional stage. After 6.0 cm of extension from the right side, Model 1 was driven from the right side to continue the second extensional stage simulation until 10.5 cm of total displacement was reached.
Kinematics of models presented in this study

The set up for Model 2 to simulate the evolution of the Hanghou Sag comprised a sandbox measuring 70 cm long and 60 cm wide based on the natural scale. The sandbox was driven by two motors from the left- and right-hand sides (Fig. 12c). A thin elastic rubber sheet measuring 60 × 45 × 1 cm was placed at the bottom. Its left end was fixed to the steel plate and the right end was attached to the right movable wall to initiate extension after compression. A plastic plate measuring 60 × 10 × 1 cm was placed on the steel plate close to the left side to represent granite gneiss rocks at the front of the Langshan fold–thrust belt. Three small plastic blocks measuring 15 × 7 × 1 cm, 10 × 5 × 1 cm and 7 × 4 × 1 cm were placed on the rubber sheet surface to simulate the rugged forebulge in the Hanghou Sag (Fig. 9a). At the compressional stage, Model 2 was only pushed from the left side to simulate the foreland basin structure during Early Cretaceous time (Table 1 and Fig. 12c). After 6.0 cm of contraction and subsidence post-erosion, Model 2 was extended to a total of 12.0 cm at rate of 0.2 mm/min to simulate the two stages of extension, including five phases during the Cenozoic Era.
The total thicknesses of the loose sand layers involved in the deformation of Models 1 and 2 were 9.0 and 10.3 cm, respectively (Fig. 12b, d). During the deformation, all top surfaces of the models were photographed every 1 cm of displacement. At the final stage, all models covered by a 1.0-cm-thick layer of sand were impregnated with water, and serial vertical sections were sliced and photographed at 1 cm intervals.
Model 3 was designed to simulate the evolution of the Jilantai Sag and Jixi Bulge in order to compare this with Model 1. Three layers of loose sand (total thickness 5 cm) were sieved at the bottom of the model to simulate the basement layers (Table 1). In the shortening stage, the sandbox was compressed by two motors from the left- and right-hand sides (Fig. 13a). The deformation of the model surface was covered by an additional layer of sand (thickness 2 cm) after the 9.0 cm bulk compression from both sides. Another three layers of loose sand (total thickness 3 cm) were sieved on top of the model after the small amount of erosion of the upper part of the deformation layers to represent the deposition of subsidence. Following the subsidence, the elastic rubber sheet was attached to both the right and the left mobile sidewall, and Model 3 was pulled from two sides at rate of 0.2 mm/min to simulate the extensional stage until 10 cm of total displacement was reached.
Model 4 was designed to simulate the evolution of the Hanghou Sag in order to compare with Model 2. The set-up is similar to that for Model 2, except for the absence of the three small plastic blocks (Fig. 13b). At the first compressional stage, four layers of loose sand (total thickness 6 cm) were sieved at the bottom of the model to simulate the basement layers, and Model 4 was only pushed from the left-hand side to simulate the foreland basin structure during Early Cretaceous time (Table 1). The deformation of the model surface was covered by an additional layer of sand (thickness 1 cm) after the 7.0 cm bulk compression. After a total of 14.0 cm of contraction in the second compression stage, Model 4 was extended to a total of 15.0 cm at rate of 0.2 mm/min to simulate the extension deformation during the Cenozoic Era.
Models 3 and 4 were conducted in order to compare with Models 1 and 2; we therefore did not cut sections after simulation.
6.b. Scaling
The two models presented here were scaled to the Linhe Depression geometrically, kinematically and dynamically. Geometric similarity was achieved using a thickness ratio of approximately 1.0 × 10⁻⁵, where 1 cm of loose quartz sand in the models simulated 1.0 km of sediments in nature. Dry quartz sand has an average angle of internal friction of 36°, a cohesive strength of 1.05 kPa and deforms according to Navier–Coulomb failure, making it a suitable material for simulating the brittle deformation of sediments in the upper crust (McClay, Reference McClay, Knipe and Rutter1990). Quartz sand has a well-rounded grain shape and a size of c. 0.2 mm (see sand properties in Table 2).
Scaling parameters of the analogue models

Obtaining kinematic similarity was approached by simulating a sequence of events in the models that closely followed the interpreted evolution history of the Linhe Depression. On the basis of our interpretation of the seismic and field data, along with the tectonostratigraphic relations of different sedimentary formations, a five-stage evolution was therefore proposed and mimicked in the models. In the first stage, Models 1 and 3 were compressed in the NW–SE direction to initiate orthogonal contraction in the Jilantai Sag, while Models 2 and 4 were compressed only from the NW direction in the Hanghou Sag. The second shortening stage was followed by two inverted stages resulting from the southeastern extension of Models 1 and 2 after a uniform subsidence.
Dynamic similarity was fulfilled by simulating the physical properties of the sedimentary units of the Linhe Depression with appropriate modelling materials. In this regard, the intrinsic material properties, such as cohesion (τ 0) and coefficient of internal friction (μ), needed to be approximated in both the models and in nature (Koyi & Peterson, Reference Koyi and Peterson1993; Koyi, Reference Koyi1997). The angle of the internal friction of rocks in the upper crust (< 10 km) was averaged as 40° (Brace & Kohlstedt, Reference Brace and Kohlstedt1980), thereby resulting in a coefficient of internal friction (μ) of 0.84. The angle of internal friction of the uncompacted loose sand used in the models was 36°, resulting in a coefficient of internal friction of 0.73 (Koyi & Vendeville, Reference Koyi and Vendeville2003; Yu & Koyi, Reference Yu and Koyi2016, Reference Yu and Koyi2017), which is considerably close to that of the rocks in the upper crust. Cohesion (τ 0) was scaled by the equality between the non-dimensional shear strength in the models and in nature:
 $${\left( {{{\rho gl} \over {{\tau _0}}}} \right)_m} = {\left( {{{\rho gl} \over {{\tau _0}}}} \right)_n}$$
where ρ is density, l is length, g is the acceleration due to gravity, and subscripts m and n denote the model and nature, respectively. The non-dimensionalized ratio was calculated for the models and for nature by using the shear strength of sedimentary rocks ranging from 1 to 10 MPa (Hoshino et al. Reference Hoshino, Koide, Lnami, Lwarmura and Mitsui1972). For clastic sediments, the shear strength and density were 10 MPa and 2550 kg m−3, respectively (Yu & Koyi, Reference Yu and Koyi2016).The cohesion of the loose sand was approximately 100–140 Pa (Yu & Koyi, Reference Yu and Koyi2016) and its density was 1550 kg m−3 (Table 2). These characteristics resulted in non-dimensional shear strengths (Equation (1)) of 11–15 for the model and 25 for nature. These two ratios, which are within the same order of magnitude, suggest that our models achieved approximate dynamic similarity to their prototypes.
Following the scaling procedure (Ramberg, Reference Ramberg1981; Weijermas & Schmeling, 1986), the scaling stress (σ*) is given by:
 $${\sigma ^*} = {{{\sigma _{\rm{m}}}} \over {{\sigma _{\rm{n}}}}} = {\rho ^{\rm{*}}}{g^{\rm{*}}}{l^{\rm{*}}} = {{{\rho _m}} \over {{\rho _n}}}\,{{{g_m}} \over {{g_n}}}\,{{{l_m}} \over {{l_n}}}$$
where σ* ∼ 0.54 × 10⁻⁶; all scaling parameters used in our models are reported in Table 2.
6.c. Model results
6.c.1 Model 1
During the initial phase of shortening in Model 1 after 2.5 cm of total shortening, fault f1 first developed in an area located 20 cm away from the right movable wall (Fig. 14a and online Supplementary Video 1, available at http://journals.cambridge.org/geo).When the total shortening amount increased to 7.5 cm, fault f2 developed in the area located 10 cm away from the left movable wall, and the back thrust fault f3 developed on the hanging wall of fault f1 (Fig. 14b). In the second compressional stage with 15 cm shortening displacement, faults f4 and f5 formed in front of faults f1 and f2, respectively (Fig. 14c). The distance between fault f4 and the right movable wall was c. 36 cm, while the distance from fault f5 to the left movable wall was c. 30 cm. During the first 3.0 cm of extensional deformation, the boundary normal fault f6 was generated, followed by faults f7 and f8, to form an asymmetrical graben (Fig. 14d). When the extension amount increased to 6.0 cm, several new normal faults, such as f9, f10 and f11, formed in the right part of the model.
Meanwhile, f12, together with other secondary normal faults, developed in the hanging wall of master fault f6 (Fig. 14e). Additional normal faults, including f13, f14, f15 and f16, formed along with all previous normal faults on the surface of the deformation model after 10.5 cm of extension in the final stage (Fig. 14f). Thrust faults f2 and f5, which were preserved in the cross-sections of Model 1 and thrust over white sand layers 4 and 5, were sealed by grey sand layer 6 (Fig. 14g). In addition, fault f5 was cut off by faults f6 and f8, which confined a graben in the left part of the sections (Fig. 14g). Thrust faults f1, f3 and f4 were also sealed by sand layer 6 and cut off by normal faults f10, f11 and f14, respectively. The normal fault f12 cut through the tipping point of thrust fault f4, which bounded the white sand layer 5. The normal fault pairs f10 and f11, and f13 and f14, formed two grabens beside the horst bounded by faults f11 and f13. Fault f9 bounded a half-graben near the right wall and fault f10 comprised a horst preserving the folded basement grey layers under horizontal layer 6 (Fig. 14g).
6.c.2 Model 2
During the first phase of compressional deformation in Model 2 after 3.0 cm of shortening, fault f1 first developed in the area located 9.0 cm from the left movable wall (Fig. 15a and online Supplementary Video2, available at http://journals.cambridge.org/geo). When the shortening amount increased from 4.0 cm to 6.0 cm in the second stage, fault f2 developed in front of fault f1. The distance between fault f2 and the left movable wall was c. 21 cm, while that between fault f1 and the left movable wall was c. 8 cm (Fig. 15b, c). During the first 2.0 cm of extensional deformation, three normal faults (f3, f4 and f5) began to develop, and faults f4 with f5 comprised an asymmetrical graben (Fig. 15d). As the extension amount increased from 4.0 cm to 6.0 cm, several secondary normal faults were generated within the graben bounded by faults f4 and f5 in the left part. Moreover, several normal fault pairs (f6 and f7, f8 and f9) started to form horsts on the right surface of the model (Fig. 15f). Other normal faults, including f10–f15, developed gradually to form new subtle grabens and horsts with some of the previous normal faults on the deformation surface after 12.0 cm of extension in the final stage (Fig. 15g–i). Thrust faults f1 and f2 preserved in the left part of the cross-sections in Model 2 were sealed by grey sand layer 4, and fault f2 was cut by fault f4 (Fig. 15j). Boundary faults f4 and f5 comprised a graben in which several antithetic secondary normal faults, such as f14 and f15, developed. Fault f15 cut through the tipping point of thrust fault f2, terminating in the white sand layer 3. The pairs of normal faults f6 and f7, and f8 and f9, developed along the boundary of the pre-existing plastic blocks in the basement to form the horsts. Two grabens bounded by f10 and f13 were distributed to the left and right horsts, respectively. Normal faults f11 and f12 constituted a shallow graben in some sections, and faults f3 and f13 comprised a horst close to the right movable wall, where several secondary normal faults were generated between the boundary faults (Fig. 15j, k).
6.c.3. Models 3 and 4
During the shortening stage in Model 3 after 9.0 cm of total contraction, six thrust faults (f1, f2, f3, f4, f5, f6) developed in the model. During the extension stages, six major normal faults (F1, F2, F3, F4, F5, F6) developed to form grabens and horsts. The normal faults F3, F4, F5 and F6 cut across thrust faults f1, f2, f5 and f6. The main difference between Models 3 and 1 is that the normal faults and a graben-and-horst pair developed due to the extension in the left side in Model 3, but not in Model 1.
During the shortening stage in Model 4 after 14.0 cm of total contraction, four thrust faults (f1, f2, f3, f4) developed in the model. During the extension stages, the boundary normal fault (F1) generated to cut across thrust fault f4, and normal faults F2 and F3 developed at the right side. The main difference between Models 4 and 2 is the absence of the horsts and grabens in the right segment in Model 4 but not in Model 2, as a result of the homogeneous deformation without the plastic blocks in the basement.
7. Discussion
7.a. Negative inversion structure analysis
The mechanism responsible for the development of negative inversion structures in some parts of the Linhe Depression during the Mesozoic–Cenozoic eras remains debatable. This gap is mainly because of the lack of evidence of inversion within the Linhe Depression itself, with inversion only observed in certain areas of the Jilantai and Hanghou sags. The deformation patterns preserved in the Jilantai Sag present a typical negative inversion structure related to the model proposed by Williams et al. (Reference Williams, Powell, Cooper, Cooper and Williams1989) (Fig. 18a, b). The thrust system formed in the first stage of compression in the Jilantai Sag is similar to the eroded thrust system. The thrust faults F7' and F8' (Fig. 18c) are similar to faults f1 and f3 (Fig. 18a). The partial reactivation of F8 generated in the two extensional stages is related to fault f4 in the complex thrust system (Fig. 18b, d). The normal fault (F7) cutting across the tip of thrust fault (F7') in the seismic profile of the Jilantai Sag (Fig. 18d) is related to fault f3 in the complex thrust system (Fig. 18b). Newly formed normal faults (f12 and f9) in Model 1 located where there were thrust planes (f4 and f3) (Fig. 14g); even if they do not reactivate them in these two examples, the normal faults are located at the tip of the thrusts and do not cut them apart from as shown in cross-section E–F (Fig. 14g). However, there is still a link between the localization of the normal faults and the pre-existing thrust faults.
According to Coulomb’s failure criterion, the initial dip angle of a fracture is equal to 45°–(ϕ/2). If the internal friction angle (ϕ) of clastic rocks in the Linhe Depression is close to 30° then, according to Anderson’s theory of faulting (Anderson, Reference Anderson1951), the dip angle of a thrust fault should be close to 30° and that of a normal fault should be approximately 60°. When the dip angle of a thrust fault increases to approximately 60° as founded in a thick-skinned compression (Jagger & McClay, Reference Jagger and McClay2018), extensional faults will reactivate with the reuse of thrust faults, thereby causing a partial or complete inversion structure, such as faults F7 and F8 in the seismic sections (Fig. 18d). Otherwise, normal faults cut across the pre-existing thrust system with no reuse of thrust faults, such as faults f7 and f12 in the simulation result of Model 1 (Fig. 14g). The similarity between our modelling results and the seismic interpretation illustrates that the Linhe Depression experienced compression during the Mesozoic Era, and then extension during the Cenozoic Era, ultimately leading to a negative inversion structure.
The different textures of the basement rocks explain the multiple inverted patterns in the depression. Here, the results of Model 1 showed the formation of a piggyback basin in front of the plastic plate during the compression stages from both sides. The distance (L) between the initial thrust fault and the plastic plate can be calculated as:
 $$L = {t \over {{\rm{tan}}(45^\circ - \emptyset /2)}}$$
where t is the thickness of the sand layers and ϕ is the internal friction angle of the sand. In our experiments, the internal friction angle of the sand was c. 36° and the initial thickness of the sand layers in Model 1 was 5 cm. The distance (L) from the initial thrust fault f1 to plastic plate 1 was therefore c. 10 cm and from fault f1 to the right-hand side of the model c. 20 cm as the width of plastic plate 1 attached to the right-hand side reached 10 cm (Fig. 14a). When the shortening amount exceeded the space between plastic plates 1 and 2, the new thrust fault (f4) began to develop in front of plastic plate 2 (Fig. 14c). The distance from f4 to plastic plate 2 can be calculated from Equation (3). In our models, we used plastic plates to represent the Archean granite gneiss rocks in the basement. We also put loose sand around the plastic plates to represent Proterozoic metamorphic sedimentary rocks in the basement to represent the different textures of the basement. If we do not incorporate the differences in textures of the basement, then the modelling results will generate imbricate thrust faults with a small equal distance between each other (Buiter, Reference Buiter2012); this uniform condition of the basement is dissimilar to the seismic interpretation in the Jilantai Sag. The tectonic framework formed in the contraction stages controlled the areas where the normal faults developed during the extensional stages. If the model was extended from two sides, a graben-and-horst pair will generate in the both left and right segments as shown in Model 3.
The results of Model 2 showed that the Central Fault Zone, including the Song 5, Zhage and Xinglong fault zones, initially developed along the boundary of the pre-existing forebulge (the locations of the small plastic blocks) in the middle part of the Hanghou Sag. Two grabens at each side of the central horst developed following the horst during the extension stages. If we had not inserted plastic blocks in the basement to represent the forebulge, then the modelling results would show a homogeneous deformation in the cover layers as Model 4 indicated, or something like the conjugate fault sets due to the Poisson effect (Zwaan et al. Reference Zwaan, Schreurs and Buiter2019).
The location of the forebulge, showing high-gravity anomalies (Fig. 9), indicated the different textures in the basement that controlled the cover deformation to generate the Central Fault Zone in the Hanghou Sag.
7.b. Comparison between modelling results and nature
Models 1 and 2 produced similar tectonic evolutions for the Jilantai and Hanghou sags. The modelling results at the extension stage were compared with the structural map of lowermost Eocene seismic reflections in the Linhe Depression.
The map view of Model 1 results broadly showed the similarities in the distributions and configurations of the third-order structural units to those developed on lowermost Eocene seismic reflections in the Jilantai Sag (Fig. 19a, b). Faults F4, F5, F7 and F8, which are the boundary faults of the Jixi, Jizhong and Jidong subsags, respectively, were similar to faults f6, f8, f12 and f11 in the trending and dipping regions developed in the experiment conducted at the 10.5 cm extension. The inversion patterns of faults F5, F7 and F8 in the seismic sections (Fig. 20b) were broadly similar to faults f8, f12 and f11 in the simulation sections (Fig. 20a).
The map view of Model 2 results at the 6.0 cm extension also showed similarities in the distributions and configurations of the structural units to those developed on lowermost Eocene seismic reflections in the Hanghou Sag (Fig. 19c, d). The modelling results reproduced the development process for the Aolun Subsag, Central Fault Zone and Huanghe Subsag in the Hanghou Sag through extension from the SE side. The segmented characteristics of the Central Fault Zone were similar to the simulation results in the top view. The transfer zones of TZ2 and TZ3 in nature were similar to those of TZ5 and TZ6, which developed along the gaps between two basement plastic blocks in the modelling results at the 6.0 cm extension. In Model 4, the experiment conducted without any pre-existing plastic block in the basement, the modelling results for the same scenario would generate distributed deformation (Fig. 17). In Model 2, the separated plastic blocks in the basement were used to mimic a rugged forebulge at the centre of the Hanghou Sag in the foreland compression stages. We can therefore reasonably consider that the pre-existing rugged forebulge was responsible for the formation of the Central Fault Zone and that the gaps among them could easily have caused the transfer zones to offset the segments of the Song 5, Zhage and Xinglong fault zones (Fig. 19c, d).
The distances between the adjacent units in the modelling results did not exactly coincide with the structural map in nature because of the complexity of the inversion modelling process. Nevertheless, their similar configurations suggested that the Linhe Depression experienced the same tectonic evolution as that in the experiments.
The photographs and interpretations of the cross-sections at the final stages taken from Models 1 and 2 were used to compare the internal geometry of deformation with the seismic interpretation (Fig. 20). In the section of Model 1, thrust fault f1 and its back thrust fault f3, which developed during the contractional stages, were cut by normal faults f11 and f10 to generate a partial inversion structure (Fig. 20a). This inversion pattern was very similar to the features of inverted faults F8 and its back thrust fault in the seismic profile (Fig. 20b). Thrust fault f5, which developed at the shortening stages in Model 1, was cut through by normal faults f6, f7 and f8 in the later extension (Fig. 20a). The reverse evidence of fault f5, which was clearly preserved in layers 4 and 5, could be compared with that of fault F5 in the seismic profile (Fig. 20b). Moreover, the boundary normal fault f6 in Model 1 was similar to fault F4 as the boundary fault of the Jixi Subsag (Fig. 20a, b). However, identifying the trace of fault F5 on the footwall of fault F4 was difficult because of the quality of seismic reflection. Thrust fault f4 was cut by normal fault f12 at the tip of the upper segment and by fault f14 at the backend. The configurations of f4 and f12 in the modelling sections were similar to those of F7 and F7' in the seismic profiles (Fig. 20a, b). Normal fault f9 in the modelling sections was comparable to fault F9 in the seismic profile B–C.
The deformation patterns between the horsts and grabens in the modelling sections (Model 2) showed the same features as those developed in the seismic profiles (Fig. 20c, d). The graben formed by f4 and f5 in the modelling sections was similar to the Aolun Subsag, which was formed by F2 and F2' in the seismic profiles. The horst formed by f9 and f8 in the modelling sections was comparable to the Zhage fault zone, which was formed by F20 and F22 in the seismic profiles. The other grabens and horsts developed between the Aolun Subsag and Zhage fault zone also presented the same patterns as those developed in the modelling results. The Huanghe Subsag was also found to be similar to the graben formed by f8 and f13. The evidence that f2 was cut off by f4 in Model 2 can be used to interpret the origin of thrust faults f5 and f6 in seismic profiles, which were cut at the later extension(Fig. 20c, d).
However, there still exist differences between the modelling results and nature, such as the general half-graben shape of the Jilantai Sag and the thickness of the sediments on the horst to the left of the Hanghou Sag in nature. The simulation results of Models 1 and 2 did not generate as many secondary faults as interpreted in the seismic section (Fig. 20). The trending of the major faults and the distance between them in the simulation results are not completely compatible with that observed in nature (Fig. 19).
8. Proposed new model for Linhe Depression
On the basis of the evolutionary characteristics at different stages, as well as the analogue modelling and seismic interpretation for the subsidiary units, two tentative models were generalized to illustrate the kinematics of the Linhe Depression during Early Cretaceous–Cenozoic time.
8.a. Cretaceous differential compression model
The differential compression model representing the kinematic evolution of the Linhe Depression at the shortening stages during Early Cretaceous time (Fig. 21) was constructed on the basis of field observations, seismic interpretation and simulation results. The model is separated into two parts by the Dengkou transfer zone. The southwestern segment of the model was almost simultaneously subjected to compression from the NW and SE directions. The NW contractional stress originated from the Bayanwulashan fold–thrust belt, and the SE contractional stress originated from the Helanshan fold–thrust belt (Yang & Dong, Reference Yang and Dong2018). Piggyback basins (defined by Ori & Friend, Reference Ori and Friend1984) or wedge-top depozones (defined by DeCelles & Giles, Reference DeCelles and Giles1996) developed in front of the fold–thrust belt at each side, while the foredeep depozone developed at the basin centre. Boulder conglomerates and coarse-grained sandstone were deposited at the bottom of the piggyback basin, while siltstone and mudstone were deposited at the centre of the foredeep depozone (Fig. 18). The NE segment of the model was only subjected to the contraction from the NW of the Langshan fold–thrust belt to control the deposition of the Lisangou Formation (k1 l). Wedge-top, foredeep, forebulge and back bulge depozones developed successively from the NW to the SE (Fig. 18). The forebulge shape was not regular along its trending axis. The thickness of the Lisangou Formation on the forebulge was less than that in the other subsidiary units, and the lithology comprised sandstone interbedded with mudstone according to the borehole data of well S5 and the seismic interpretation. Coarse-grained facies of alluvial fan were deposited in the wedge-top units, while fine-grained facies dominated the front part of the foredeep depozone close to the forebulge.
8.b. Cenozoic negative inversion model
We constructed a negative inversion model to demonstrate how the rifted basin in the Cenozoic period superimposed the Lower Cretaceous foreland basin after erosion, following the deposition of the Guyang Formation (Fig. 22). The extensional stress from the SE direction might be linked to the clockwise rotation of the rigid Ordos block (Fu et al. Reference Fu, Fu, Yu, Yao, Zhang, Ma, Yang and Zhang2018) or the gravitational collapse of a thickened crust after at least 40 km of shortening (Darby & Ritts, Reference Darby and Ritts2007).
In the southwestern segment, the boundary normal fault F4 cut off the upper part of the Jixi piggyback basin and thrust fault F5 to generate the Jixi Subsag. Moreover, the new steep normal fault F5 partially reactivated thrust fault F5 to form a partial inversion. Normal faults F7 and F8 were partially reactivated on the top branch point of the thrust faults to generate the Jizhong and Jidong subsags, respectively. In the northeastern segment, the Langshan Fault (F2) cut off the foredeep depozone and the northeastern part of the wedge-top depozone to generate the Hanghou Sag. Several conjugate normal faults developed along the forebulge boundary to form the boundary faults of the Central Fault Zone, including the three segments of Song 5, Zhage and Xinglong fault zones. The Huanghe Subsag developed on the back bulge depozone and was controlled by the right boundary fault of the Central Fault Zone.
9. Conclusions
Based on our interpretation of the seismic data, field exploration and the results of scaled analogue models, the following conclusions are drawn regarding the evolution of the Linhe Depression in the Hetao Basin.
-
(1) Field outcrop investigation, seismic interpretation and analogue modelling results have illustrated that the Linhe Depression experienced different evolutionary stages, such as compressional depression (K1 l), conversion from compression to uniform subsidence (K1 g), extensional rifting (E2–N2) and strike-slip deformation (Q) during the Mesozoic–Cenozoic eras.
-
(2) The kinematic model of negative inversion basins was first established with the early differential compression superimposed by the late SE extension.
-
(3) The Jilantai Sag was subjected to compression from the Bayanwulashan and Helanshan fold–thrust belts during Early Cretaceous time. The Hanghou Sag was only compressed by the Langshan fold–thrust belt on the NW side. The rifted deformation resulting from the SE extension in the Cenozoic Era led to a negative inversion of the pre-existing compressional structures in the different subsidiary units with different patterns.
-
(4) The intensity of negative inversion was controlled by several key factors, including the dip angle and patterns of thrust faults, as well as the different textures of the basement. The morphological changes in the forebulge zone pre-existing in the Hanghou Sag were responsible for the segmented development of the Central Fault Zone.
Supplementary material
For supplementary material accompanying this paper visit https://doi.org/10.1017/S0016756821001138
Acknowledgements
This study was funded by the National Natural Science Foundation of China (grant no. 42072144) and the Huabei Oil Company of China National Petroleum Company (grant no. 2019D-0815). We thank the Exploration Department of Huabei Oilfield Company for providing the seismic profiles. Chao Li, Dandan Wang, Xuyang Lü and Jiameng Feng provided excellent field assistance. We acknowledge the Nei Mongol Autonomous Region Bureau of Geology and Mineral Resources (NMBGMR) for providing the geology map at a scale of 1:200 000. The constructive and detailed comments of Sandra Borderie and Frank Zwaan improved both the content and presentation of this article.