Introduction
As a crucial lightweight and high-performance structural material, magnesium (Mg) and its alloys have attracted increasing attention starting in the 1930s [Reference Pollock1, Reference Wu, Chan, Zhu, Sun and Lu2, Reference Haughton and Prytherch3]. Mg, which has the hexagonal close-packed (hcp) structure, bears plastic deformation poorly at room temperature because it possesses an intrinsic high anisotropy of critical resolved shear stress (CRSS) in different slip systems [Reference Yu, Qi, Mishra, Li and Minor4]. By tailoring the microstructure of the Mg alloys, for example, by introducing a strengthening phase and refining grains, many high-strength Mg alloys with reasonable ductility have been fabricated in the past decades [Reference Wu, Chan, Zhu, Sun and Lu2, Reference Mendis, Ohishi, Kawamura, Honma, Kamado and Hono5, Reference Xu, Zheng, Chi, Chen, Wu, Wang, Fan, Yang, Wang, Lv, Xu and Kamado6, Reference Jiao, Zhang, Jing, Xu, Liu, Zhang, Xu, Zhang and Wu7]. In particular, the alloys containing rare earth (RE) elements significantly increase the strength and ductility of the alloys. Among these Mg–RE alloys, the long-period stacking ordered (LPSO) phase, icosahedral phase (I phase), and W phase are the foremost ternary second phases that greatly enhance the strength of the matrix [Reference Tsai8, Reference Yamasaki, Sasaki, Nishijima, Hiraga and Kawamura9, Reference Tahreen and Chen10]. Clearly, the strengthening effect of the LPSO phase or I phase has been intensively discussed, and many Mg alloys containing different contents of the LPSO/I phase have been fabricated by many researchers [Reference Tsai8, Reference Nie, Zhu and Morton11].
Recently, the W phase has attracted increasing interest in the studies of Mg alloys. It has been generally proved that the W phase can be regarded as an important strengthening phase in Mg alloys [Reference Yang and Guo12, Reference Xu, Tang, Liu, Xu and Han13]. However, in the past, the W phase, with its face center cubic (fcc) structure, was usually regarded as a detrimental intermetallic compound in Mg alloys because of the weak bonding at the interface between the bulk W phase and α-Mg [Reference Luo, Zhang, Tang and Zhao14, Reference Jiang, Qiao, Xu, Zheng, Wu and Kamado15, Reference Gröbner, Kozlov, Fang, Zhu, Nie, Gibson and Schmid-Fetzer16, Reference Feng, Yang and Chang17]. The cracks very easily occur on the W/α interfaces and, thus, lead to the premature failure of the material. Recently, it was found that the bulk eutectic W/α structure was broken into fine particles in the severe plastic deformation (SPD) process [Reference Wang, Liu, Wang, Li and Du18]. These alloys containing fine W-phase particles exhibit a significant improvement in the strength. For example, the ultimate tensile strength, yield strength, and the elongation of the as-extruded Mg–10.3Zn–6.4Y–0.4Zr–0.5Ca (wt%) alloy reach 466 MPa, 447 MPa, and 4.7%, respectively [Reference Jiang, Qiao, Xu, Zheng, Wu and Kamado15].
It must be mentioned that, compared with the LPSO and I phases, the W phase is the easiest phase to generate and, thus, is widely present in the Mg–Zn–RE alloys. Therefore, the refining of W-phase particles has become a vital approach for decreasing the negative effects of the W phase in Mg alloys. The SPD method, like the extrusion treatment, is currently the most common approach used to refine the W phase and even to obtain its nanoparticles [Reference Wang, Liu, Wang, Li and Du18, Reference Li, Guan, Yang, Niu, Zhang, Lv, Meng, Huang, Hort and Meng19]. Actually, rapid solidification (RS) is also a promising manufacturing method for promoting a fine microstructure [Reference Tsai8]. In particular, the planar flow casting method has been widely applied because it can obtain continuous RS ribbons in the length direction, simultaneously achieving tiny grains [Reference Méar, Louzguine-Luzgin and Inoue20]. And for the consolidation of the RS materials, spark plasma sintering (SPS), as a short-time consolidation process, is an effective consolidated method for improving the performance characteristics of materials too [Reference Frage, Kalabukhov, Wagner and Zaretsky21, Reference Mondet, Barraud, Lemonnier, Guyon, Allain and Grosdidier22]. SPS belongs to a more general class of electric current–activated sintering (ECAS) techniques. One of the advantages of the SPS process is that it uses a high heating rate and a short thermal exposure cycle at lower temperatures, thereby limiting grain growth compared with the conventional SPD approaches [Reference Zheng, Ertorer, Li, Zhou, Mathaudhu, Tsao and Lavernia23, Reference Sopicka-Lizer24].
On the other hand, the amount of W phase has obvious effect on the strength of the material as well as its ductility. The high content of W phase is usually obtained via introducing more RE and Zn atoms into the alloys [Reference Xu, Tang, Liu, Xu and Han13]. It is convenient for increasing the amount of W phase when the atomic ratio of Zn/Gd is about 1–2 [Reference Xu, Tang, Liu, Xu and Han13, Reference Gröbner, Kozlov, Fang, Zhu, Nie, Gibson and Schmid-Fetzer16]. Nevertheless, there is rare report that the high content of W phase (larger than 30 vol%) has effect on the mechanical properties of the materials. In the Mg-rich (Mg ≥ 90 at.%) part of the ternary Mg–Gd–Zn phase diagram [Reference Gröbner, Kozlov, Fang, Zhu, Nie, Gibson and Schmid-Fetzer16], the stable F phase would form when the content of Zn is high, so do the Mg5Gd phase (under the condition of high content of Gd). To avoid the effect of the other phases, the alloys of Mg97Zn2Gd1 and Mg90Zn5Gd5 (at.%) are fabricated to improve the amount of W phase in this work.
In the present study, we prepared two as-cast Mg–Gd–Zn alloys with different W phase contents and then obtained RS ribbons via the planar flow casting method. Using the “RS ribbons + SPS” method, the bulk alloys were then obtained. Later, the microstructure was investigated in detail, and the compressive properties of the bulk were subsequently analyzed. The micromechanical property of the W phase is also discussed based on the nanoindentation method.
Results and discussion
XRD characterization and the microstructure of the initial RS ribbons
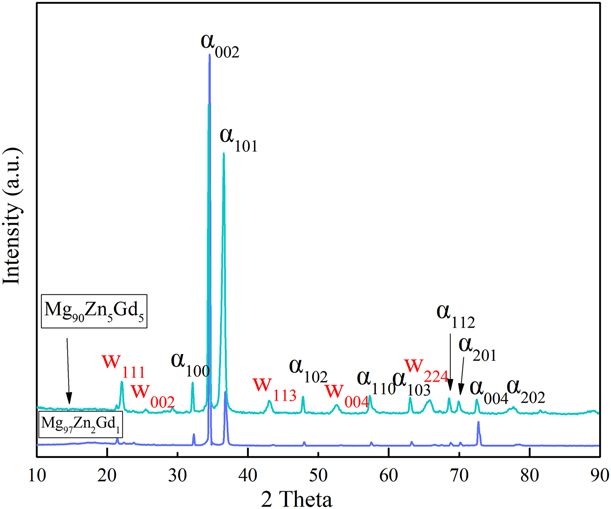
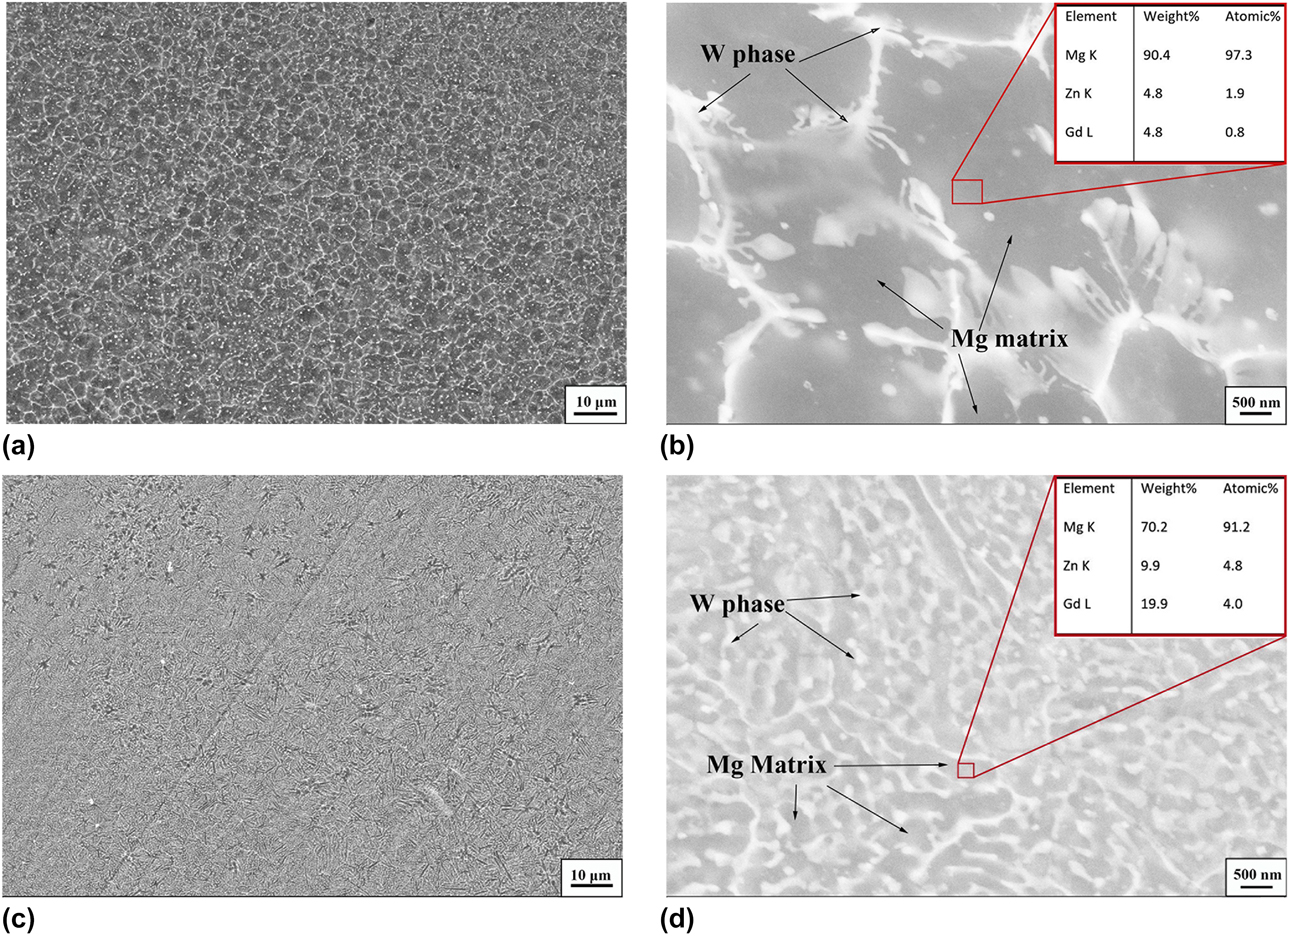
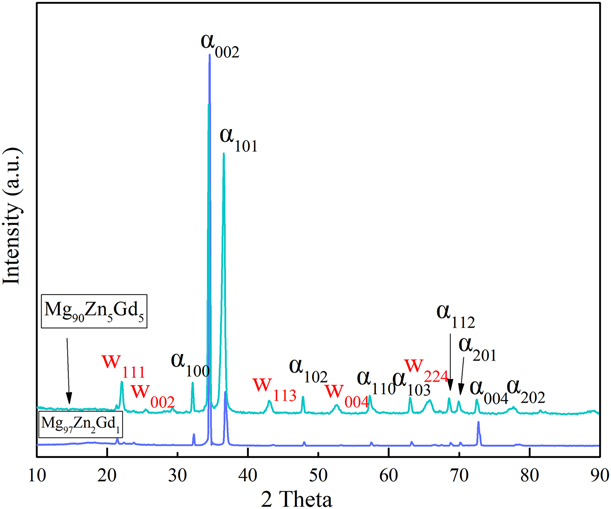
Figure 1 displays X-ray diffraction (XRD) patterns of the RS Mg97Zn2Gd1 and Mg90Zn5Gd5 alloys ribbons. For both samples, the dominant peaks are related to the hexagonal Mg phase. Other peaks in the Mg90Zn5Gd5 ribbon are assigned to the W phase. Figure 2 shows the SEM images of the RS Mg97Zn2Gd1 and Mg90Zn5Gd5 alloys. Because of the rapid cooling, the composition segregation of the two ribbons is remarkably restrained. Most of the Zn and Gd atoms are fixed in the solid solution, as shown in the insets (EDS) of Figs. 2(b) and 2(d).
XRD patterns of the RS ribbons with Mg97Zn2Gd1 and Mg90Zn5Gd5.
SEM images of the RS ribbons, (a) and (b) for Mg97Zn2Gd1 alloy and (c) and (d) for Mg90Zn5Gd5 alloy, and the insets in (b) and (d) show the EDS results for the Mg matrix.
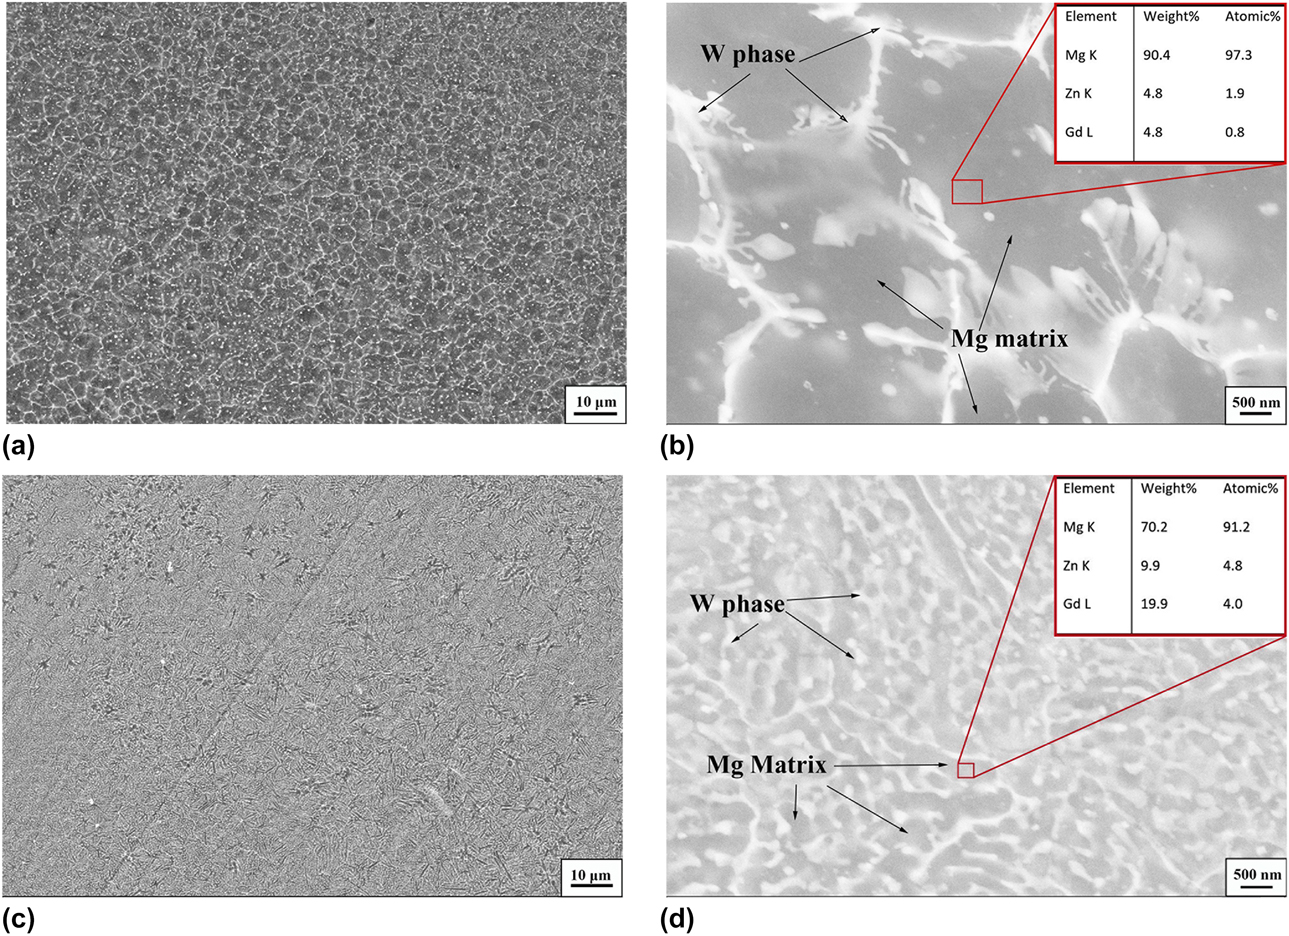
In most as-cast Mg–Zn–RE alloys [Reference Xu, Tang, Liu, Xu and Han13, Reference Jiang, Qiao, Xu, Zheng, Wu and Kamado15], the inevitable W/α eutectic structure with block shape easily forms upon the solidification process. However, the growth of this structure is significantly prevented in the RS ribbons in this study. The sizes of the grains in the Mg97Zn2Gd1 and Mg90Zn5Gd5 ribbons are different. The former ribbon shows equiaxed grains and the W-phase particles mainly distribute on the grain boundaries with the continuous network structure. Meanwhile, a small proportion of the tiny spherical W-phase particles locates on the grains. In the latter ribbon, the W phase is dominant and mostly distributes on the dendritic grain boundaries. Based on the quantitative metallographic technique [Reference International25], the W-phase content in the ribbons is estimated as 28 vol% (volume ratio) in the RS Mg97Zn2Gd1 alloy and 35 vol% in the RS Mg90Zn5Gd5 alloy.
XRD characterization of the sintering alloys
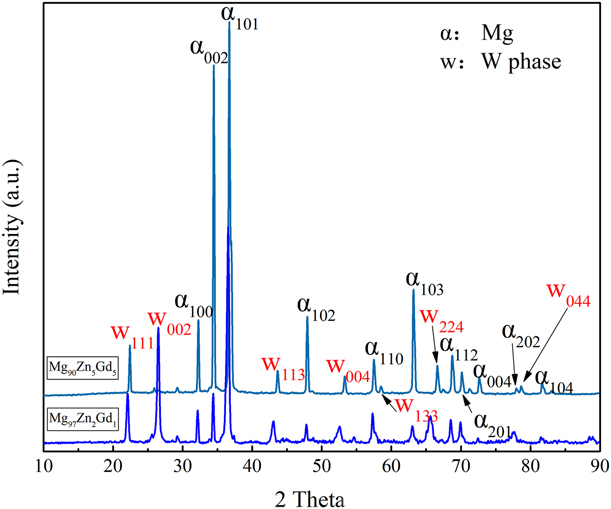
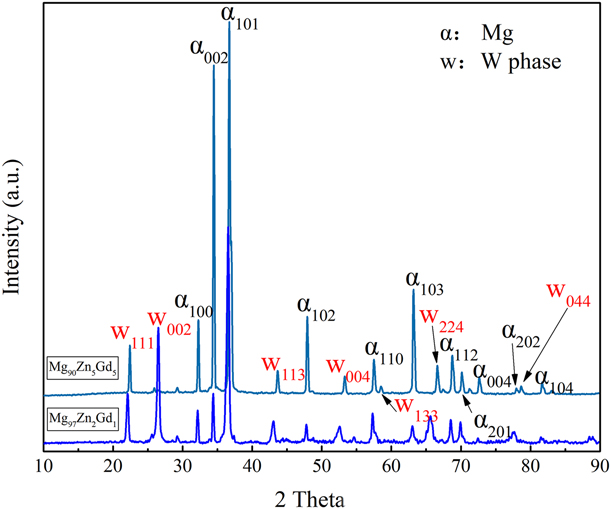
The XRD characterization results for the sintering samples are shown in Fig. 3. In the both bulks, the dominant peaks belong to the hexagonal Mg phase too. Other sets of peaks are confirmed to the W phase in the both the SPS bulks. The result also suggests that the content of W phase increases during the sintering process in both the alloys. Additionally, the main peaks of Mg and the W-phase change from (002)α and (111)w in the RS ribbons to (101)α and (112)w in both the SPS bulks, respectively.
XRD pattern of the sintering Mg97Zn2Gd1 and Mg90Zn5Gd5 alloys.
Microstructure of the SPS samples
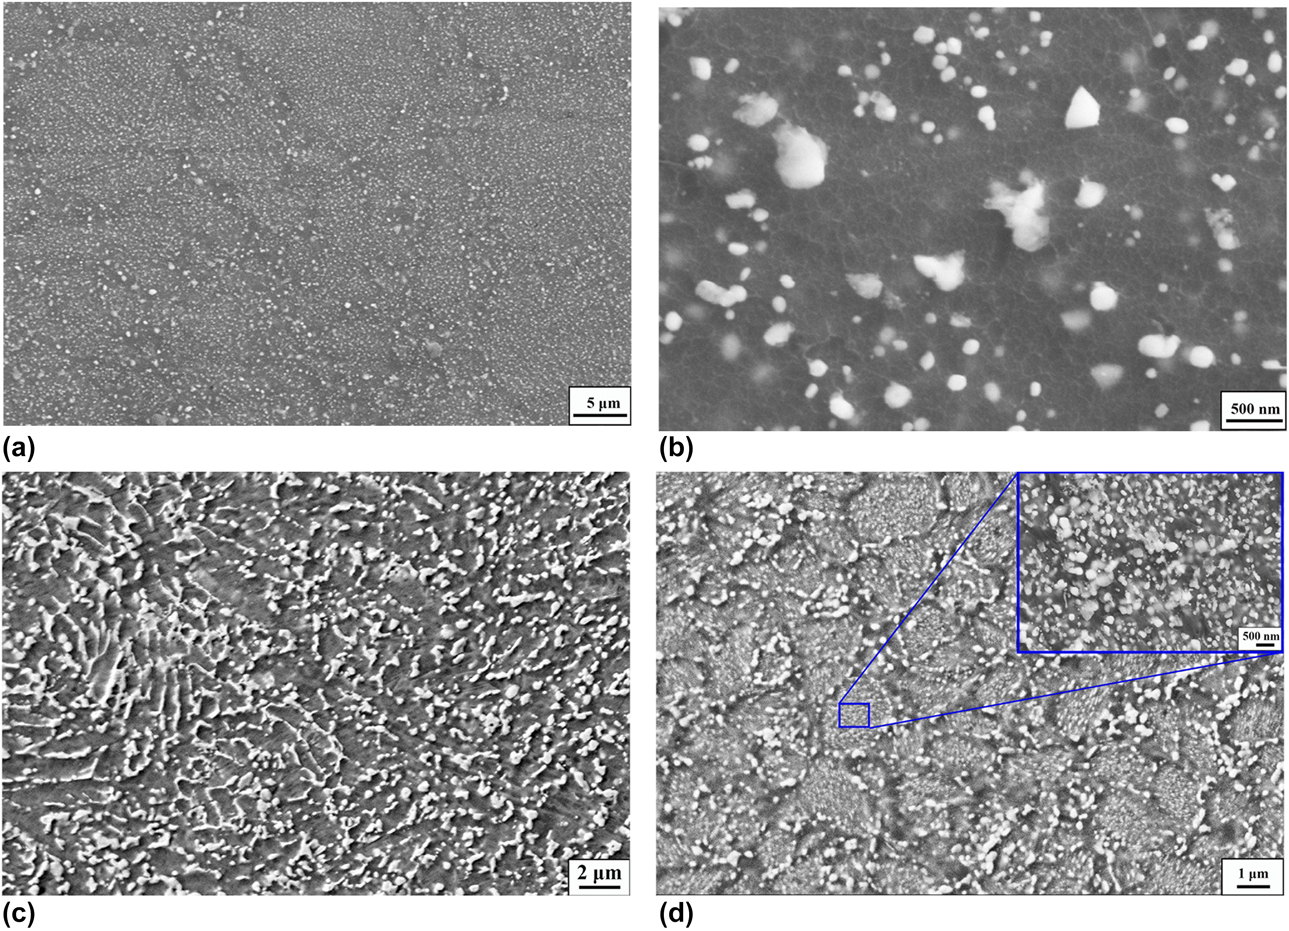
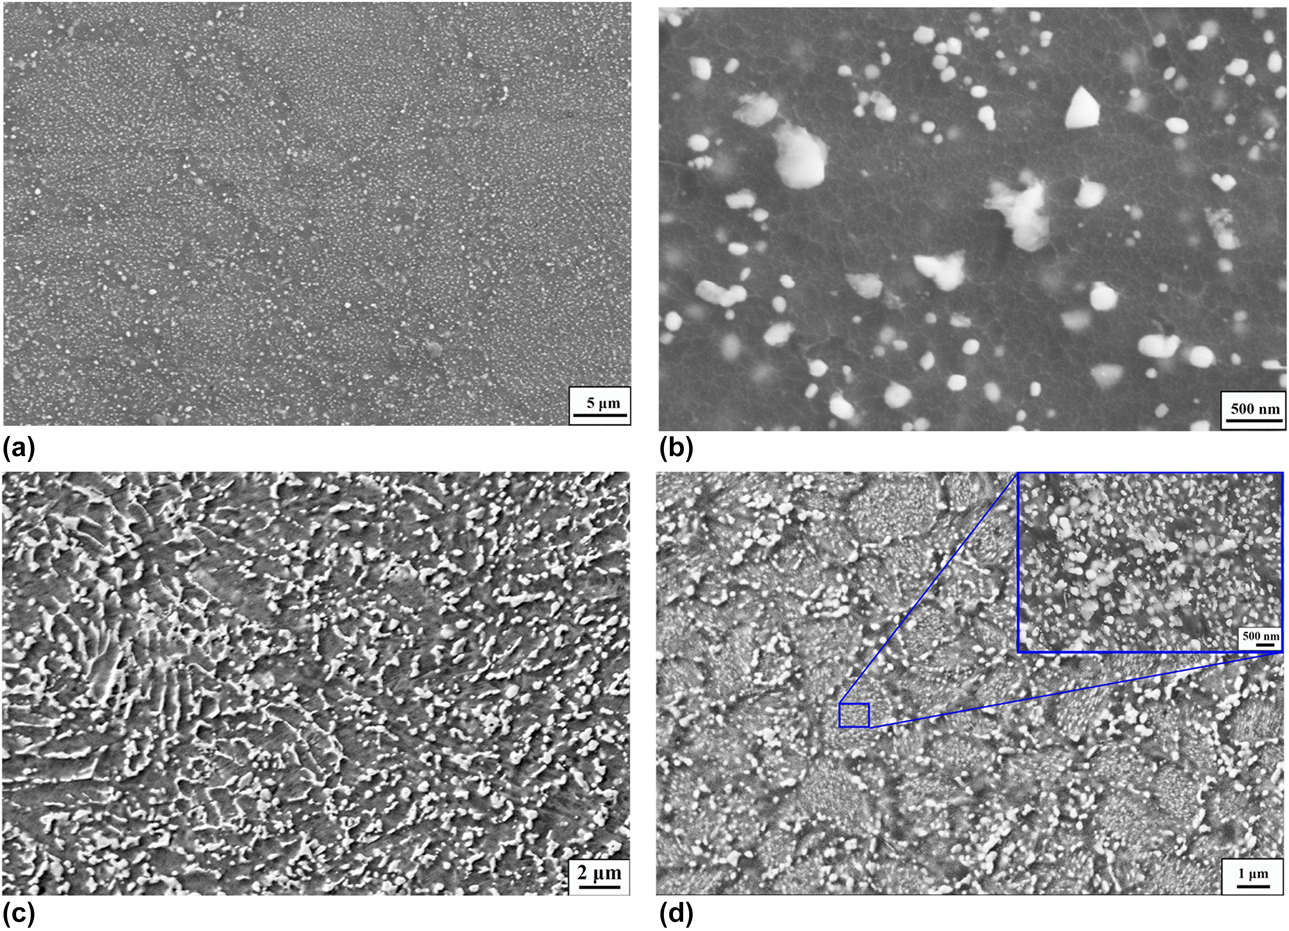
Figure 4 shows the SEM images of the two SPS bulks. Comparison with the microstructure of the corresponding RS ribbons (shown in Fig. 2), the size of the grains increases slightly in both the SPS bulks. After sintering, a significant morphology change is observed where the network W phase almost dissolves, and the abundant W-phase nanoparticles simultaneously precipitate in both the bulks. For the Mg97Zn2Gd1 bulk, finer intragranular W-phase particles distribute uniformly on the equiaxed grains and the larger irregular W-phase particles locate in the vicinity of the grain boundaries. For the Mg90Zn5Gd5 alloy, dendritic grains are prominent, but some equiaxed grains are still developed. The volume fraction of the equiaxed zone is approximately 35 vol%. In fact, the formed equiaxed grains are small, and the mean size of these equiaxed grains is about 2.2 μm. Moreover, additional fine W-phase particles also precipitate on the matrix during the SPS process. W-phase content increases slightly, and its content is approximately 34 vol% and 41 vol% in the SPS Mg97Zn2Gd1 and Mg90Zn5Gd5 alloys, respectively.
SEM images of the SPS alloys. (a and b) for the Mg97Zn2Gd1 alloy and (c and d) for the Mg90Zn5Gd5 alloy.
A transmission electron microscope (TEM) was also used to investigate the microstructure of the bulks and the structure of W-phase particles. Figure 5(a) shows the TEM images of the nano W-phase particles in the SPS Mg97Zn2Gd1 alloy. Figures 5(b) and 5(d) show the selected area electron diffraction (SAED) patterns of the nanoparticle. This fine W phase belongs to an fcc structure with a = 0.693 nm. The W phase in the Mg97Zn2Gd1 alloy is uniformly distributed on the matrix with a bimodal size distribution consisting of regular rectangle grains and smaller spherical particles. The smaller particles likely form during the SPS process, and the mean size of these particles is 12.4 nm. Figure 5(c) shows the high-resolution transmission electron microscopy (HRTEM) of the spherical W phase, and it is observed that the interplanar spacing of (002)w is slightly greater than that of (100)Mg  $\left( {{{\left( {\bar{1}0\bar{1}0} \right)}_{{\rm{Mg}}}}} \right)$. The size of these fine particles in the SPS alloy is smaller than that of the fragmented W-phase nanoparticles in the as-extruded Mg–10.3Zn–6.4Y–0.4Z–0.5Ca (wt%) alloy [Reference Jiang, Qiao, Xu, Zheng, Wu and Kamado15].
TEM images of the SPS Mg97Zn2Gd1 alloy (a–d) and Mg90Zn5Gd5 alloy (e and f). (a) regular W phase, the insert is the corresponding SAED pattern, (b) finer W particles, with the insets showing the corresponding SAED patterns, (c) HRTEM images of the finer W particle, and (d) the SAED pattern of the W-phase particle in (b), the incident beam for the insets in (b) and (d) are parallel to  $\left[ {\bar{1}12} \right]$, [012], and [011], respectively, (e) the clavate W phase, and (f) dark-field (DF) image of the tiny W-phase particles in Mg90Zn5Gd5 alloy.
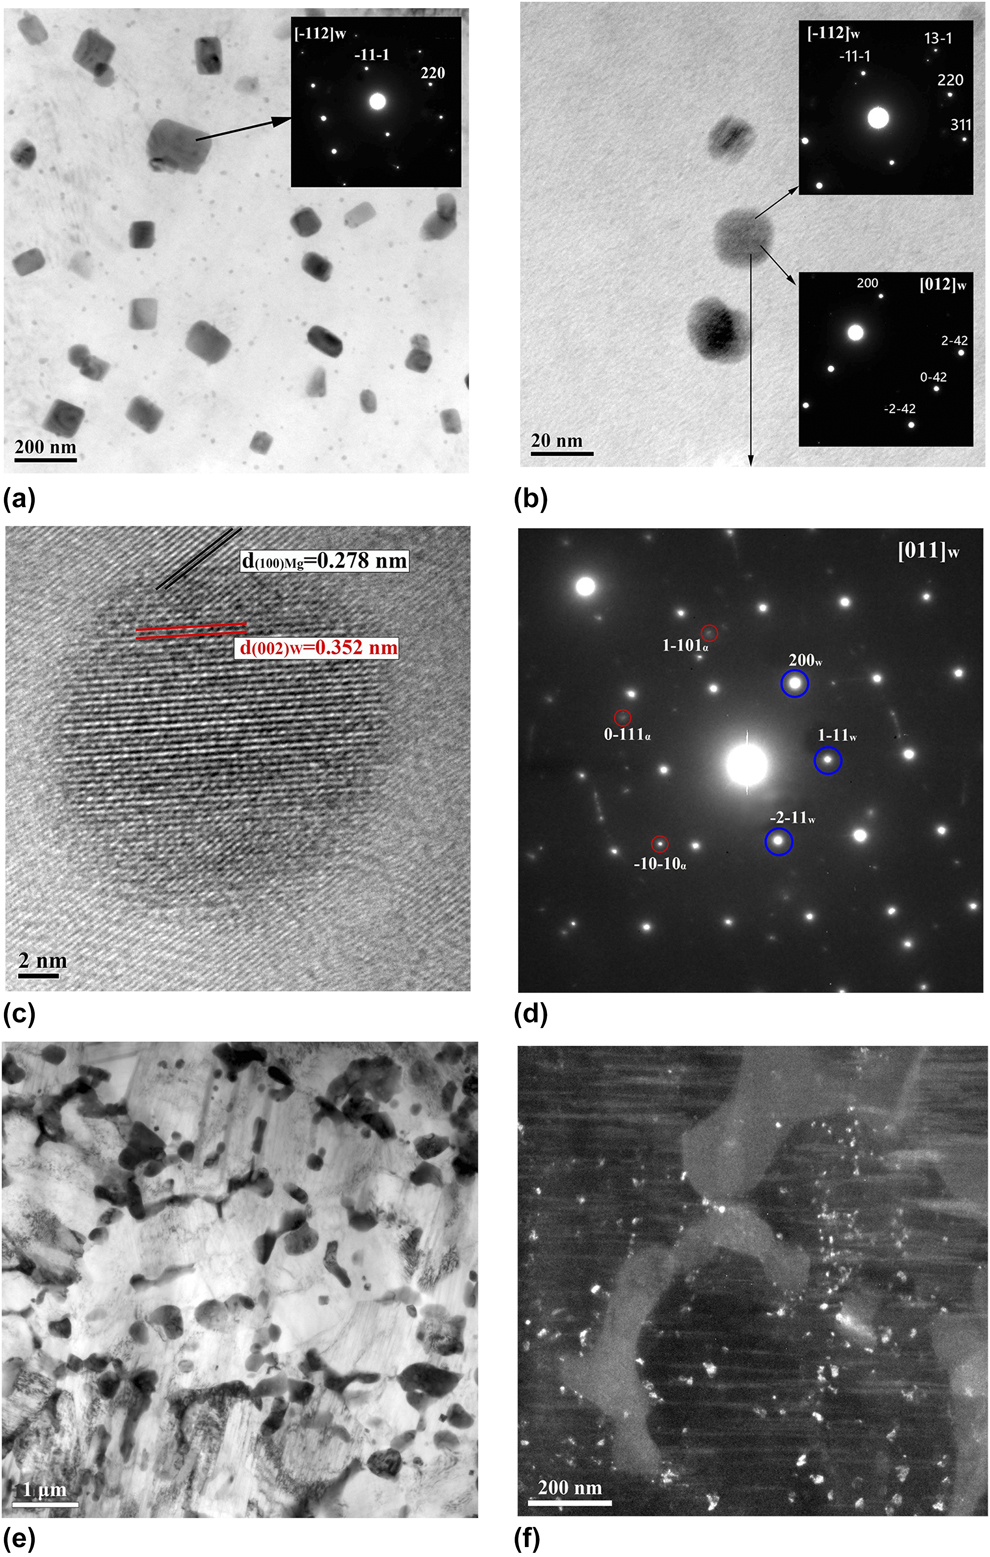
Figure 5(e) shows the TEM images of the SPS Mg90Zn5Gd5 bulk containing a higher W-phase particles content. The size of the W phase in this bulk is clearly larger than that in the Mg97Zn2Gd1 alloy, even though the sintering temperature of the Mg90Zn5Gd5 bulk is lower than that of the SPS Mg97Zn2Gd1 alloy. The network W phase in RS Mg90Zn5Gd5 ribbon has mostly a smaller size and distributes along the secondary dendritic grain boundaries, and their sizes are mainly in the 100–600 nm range. It also must be mentioned that some finer nanoparticles with the mean size of less than 100 nm are distributed on the grains in the high content of additions alloy (Mg90Zn5Gd5), as shown in Fig. 5(f).
Compressive properties of the SPS bulks
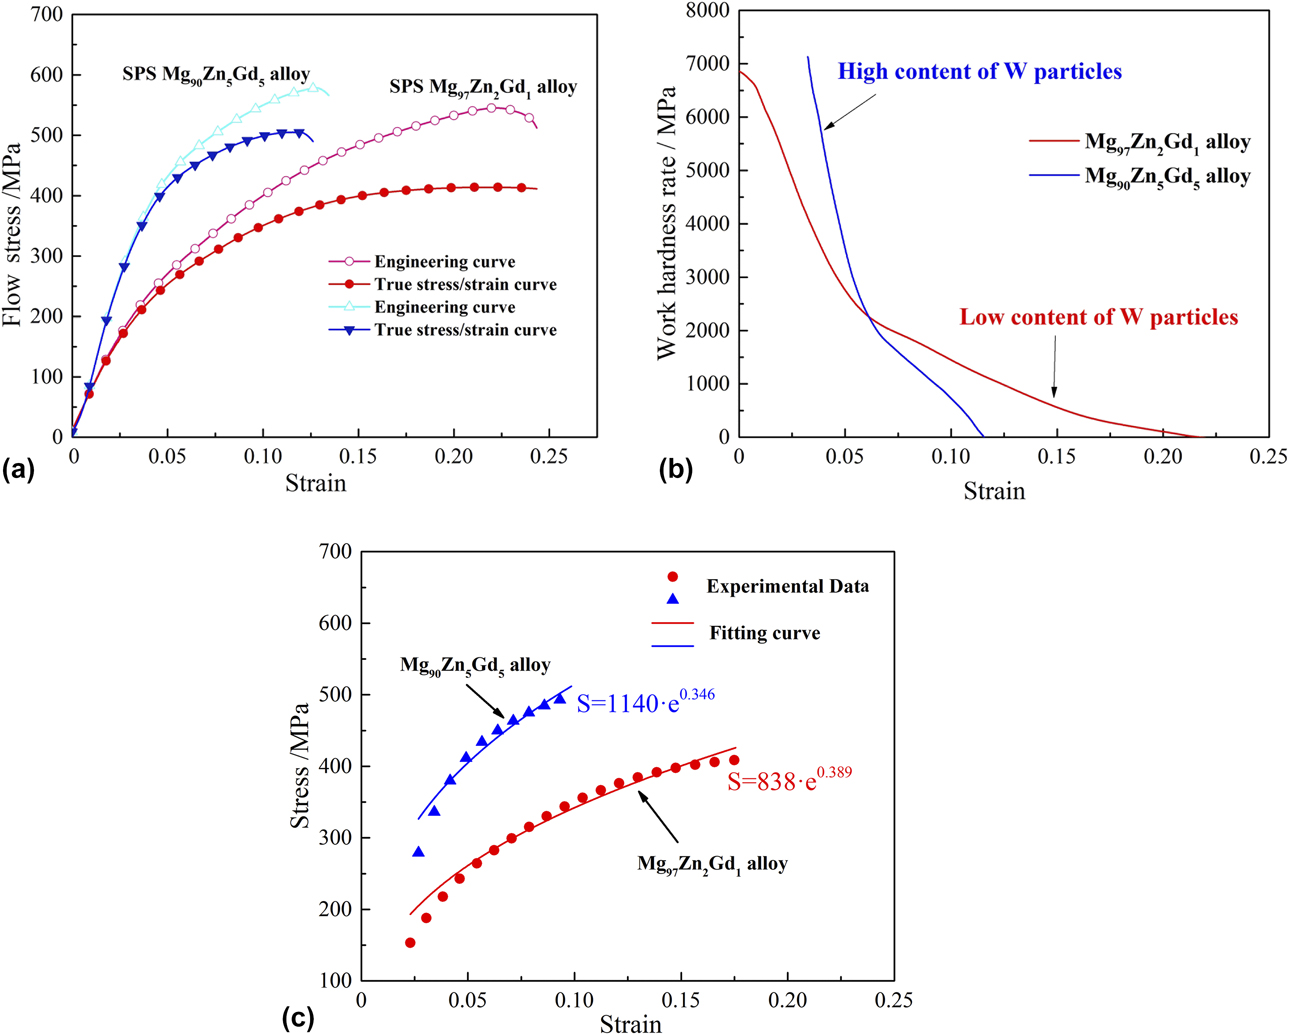
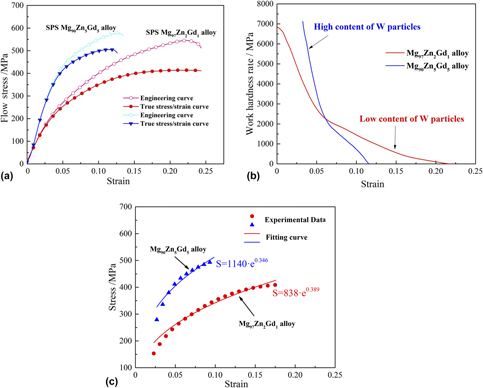
The compressive mechanical properties of the two SPS alloys are shown in Fig. 6(a). The stress–strain curves suggest that Mg90Zn5Gd5 bulk exhibits higher strengths, and its compressive yield strength (CYS) and ultimate strength (CUS) are 313 MPa and 504 MPa, respectively, and the elongation to fracture is 0.14. The Mg97Zn2Gd1 bulk shows lower strengths of 200 MPa for CYS and 390 MPa for CUS but has a higher elongation of 0.24. The work-hardness rate (θ) of the two alloys is also evaluated, as shown in Fig. 6(b). In both the bulk samples, prior to the true strain of ∼0.05, the value of θ rapidly decreases with increasing strain. Although these samples are entering the plastic deformation stage, the work-hardness rate gradually decreases to 0 with a smaller slope. Nevertheless, the Mg90Zn5Gd5 bulk exhibits lower work-hardness rate than that of the Mg97Zn2Gd1 bulk in the plastic deformational stage.
(a) The compressive strain–stress curves of the SPS alloys for the Mg97Zn2Gd1 and Mg90Zn5Gd5 alloys, (b) the work hardening rate (θ), and (c) the fitting curves of the true stress and true strain in the plastic deformation zone.
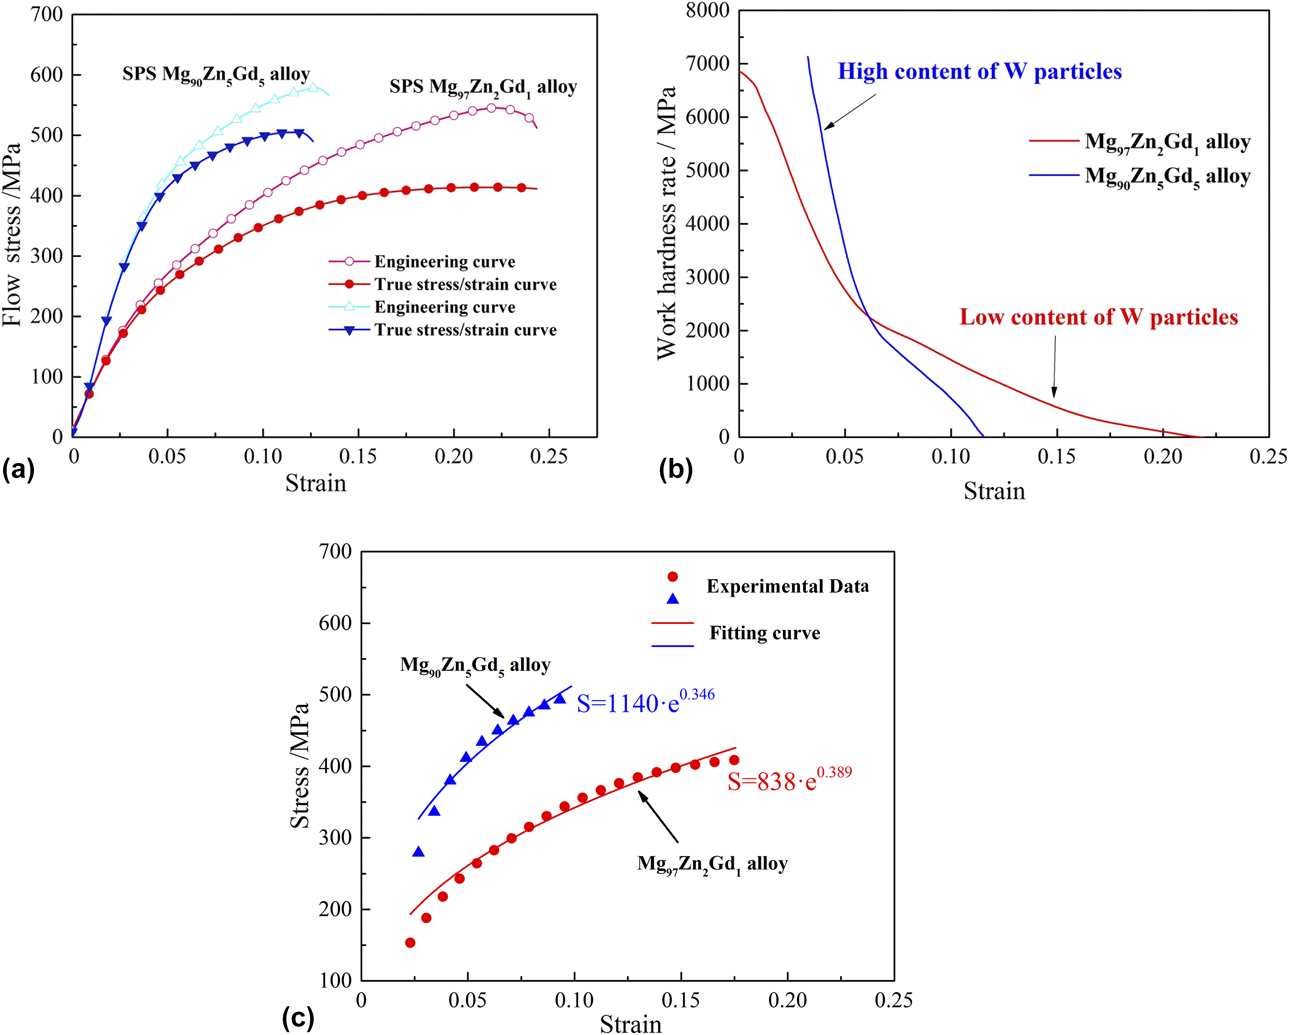
On the other hand, it is known that the strain-hardening behavior is an important consideration in evaluating the plastic deformation of materials, and the strain-hardening exponent (n) is also the most important factor that influences the stretchability when stretching predominates in the forming processes. Therefore, the strain-hardening exponents are calculated for all of the compressive samples. Figure 6(c) displays the fitting curves of true stress (S) and true strain (e) for the two alloys. The Mg90Zn5Gd5 alloy with higher W-phase content shows a smaller work-hardening exponent (0.346) than that of the lower W-phase content alloy (0.389). It means that the high W-phase content will weaken the work-hardness of the alloy, even though the W phase has nanoparticle morphology.
Micromechanical properties of the W/α structure
It is clear that the intrinsic properties of a metallic phase, such as its melting temperature and strength relative to the matrix, are important for the strengthening of the matrix. Similar to most intermetallic compounds, the W phase has an intrinsic brittle and weakly bonded interface with the Mg matrix [Reference Xu, Tang, Liu, Xu and Han13]. Besides, its melting point is high and reaches up to ∼510 °C based on DSC analysis [Reference Xu, Tang, Liu, Xu and Han13]. Nevertheless, the mechanical properties of the W phase are still not well understood. In this section, the mechanical properties of the W phase are analyzed based on the nanoindentation method using the samples from the as-cast ingot (Mg90Zn5Gd5) and the corresponding SPS alloys because the as-cast alloy has the largest W phase size among all of the samples investigated in this study (its size is at least 10 μm in some of the as-cast samples). Prior to discussing the nanoindentation testing, it must be noted that the analyzed zone inevitably contained α-Mg phase (W/α eutectic structure). Additionally, for the studied SPS alloys, the tested zones also contain the W phase because of the distribution of the abundant fine W-phase particles on the grains.
To characterize the hardness of a material, the apparent hardness, H a, is calculated; this value represents the resistance to both elastic and plastic deformations, rather than to the plastic deformation only. Based on the Oliver–Pharr method [Reference Fischer-Cripps26], the value of H a is given by:
 $${H_{\rm{a}}} = {{{U_{\rm{p}}}} \over {{V_{\rm{r}}}}}\quad ,$$
where the U p can be calculated by integrating P with respect to h based on the load–depth curve, P is the load value (mN), and h is the depth of the indentation from the surface (nm). V r is the volume of the indentation that is calculated from Eq. (2) based on the residual impression:
 $${V_{\rm{r}}} = {\pi \over 3} \cdot {\left( {\tan \;\alpha \cdot {h_{\max }}} \right)^2} \cdot {h_{\rm{r}}}\quad ,$$
where α is the effective cone angle (radian) that is equal to 70.3° for the Berkovich indenter used in this study.
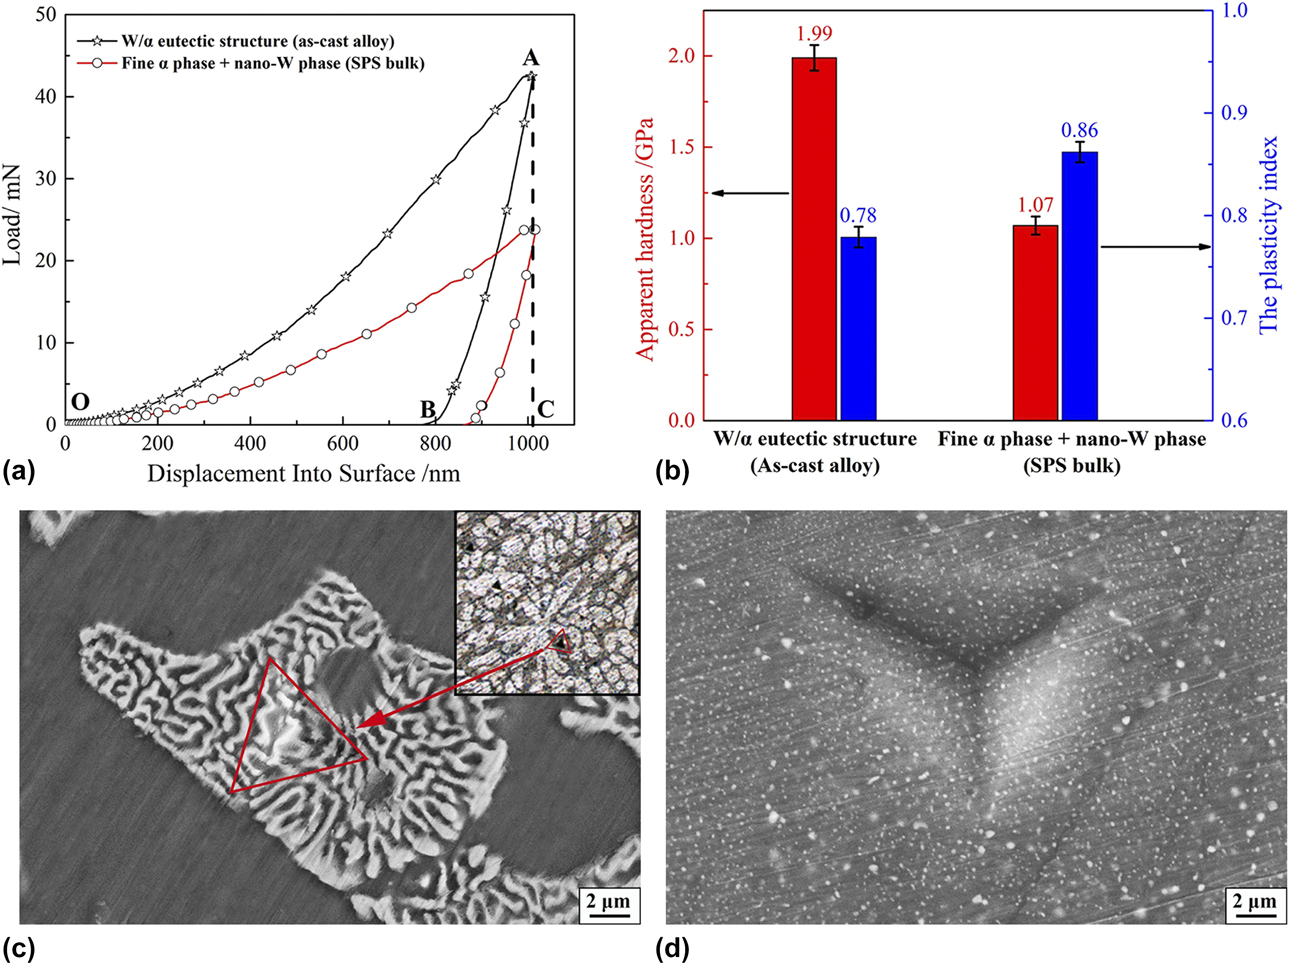
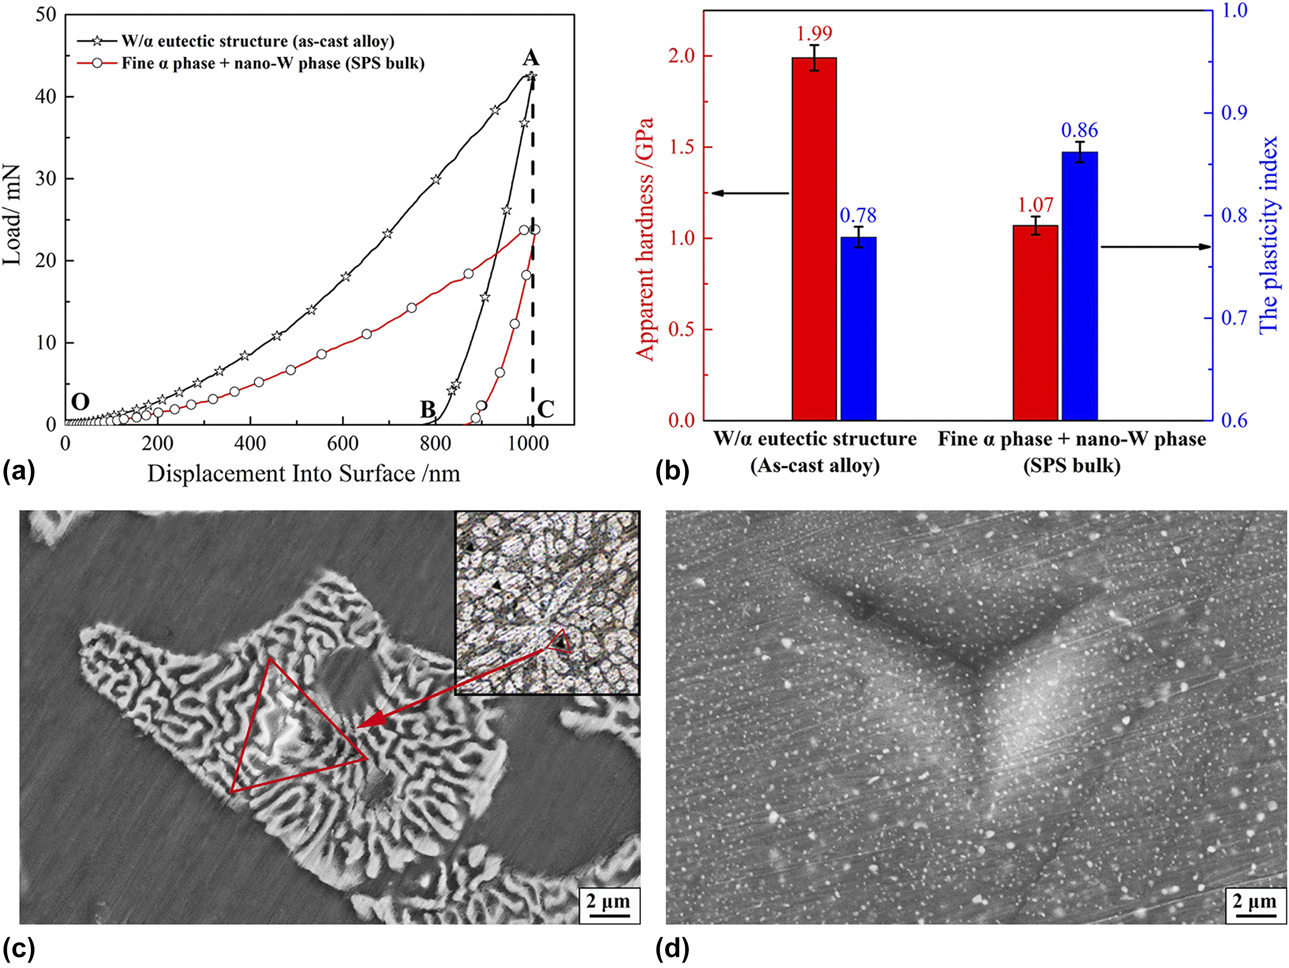
For the as-cast W/α eutectic structure, the values of the maximum load (P max) and indentation depth h (including h max and h r) are got from the load–displacement curves [Fig. 7(a)], and then the plastic deformation energy, U p, is obtained using the area of OAB within the load–depth zone [as shown in Fig. 7(a)]. Thus, the apparent hardness (H a) can be assessed.
Nanoindentation results and the corresponding impresses for the Mg90Zn5Gd5 alloy at the as-cast and SPS states. (a) load and depth curves, (b) the apparent hardness and the plasticity index, and (c) and (d) the indentation impresses in the as-cast sample and SPS sample, respectively, the insert image in (c) was the corresponding optical microstructure of the impresses.
The plasticity index, ψ, is usually a parameter that characterizes the relative plastic/elastic behavior of a material when it undergoes external stresses. For indentation contacts, the value of ψ is obtained from Eq. (3) based on the energy method according to [Reference Wang, Yang and Bao27].
 $$\psi = {{{U_{\rm{p}}}} \over {{U_{\rm{e}}} + {U_{\rm{p}}}}}\quad ,$$
where the elastic deformation energy last U e is obtained by the area of the elastic zone, such as the area of ABC for W/α eutectic structure, as shown in Fig. 7(a).
Figure 7(a) displays the curves between the load and the displacement to the surface in the zone of W/α zones. Figure 7(b) shows the values of the apparent hardness and plasticity index of the corresponding dual phase zone. The W/α eutectic structure shows a higher hardness than the nanoparticles W phase + α-Mg (fine structure) complex, and in fact, the former is more than twice as high as the latter. By contrast, the corresponding plasticity index shows an opposite trend: the fine structure shows better plasticity than larger eutectic structure. This finding is consistent with the results obtained for other Mg alloys where it was found that, whereas the bulk W phase tends to embrittle the Mg matrix the fine W-phase particles enhance the hardness and the ductility of the Mg matrix [Reference Xu, Tang, Liu, Xu and Han13, Reference Jiang, Qiao, Xu, Zheng, Wu and Kamado15]. Moreover, according to the relationship between indentation hardness (HN) and yield strength (compression, σy), HN ≈ 3σy [Reference Fischer-Cripps26], the yield stress for the SPS bulk is calculated as 357 MPa, which is slightly higher than that of the corresponding true yield stress of the SPS bulk (313 MPa). Meanwhile, the yield stress of the W/α zone was estimated as 663 MPa. Figures 7(c) and 7(d) show the indentation impresses in the both samples. The impress of the nanoparticles W phase + α-Mg (fine structure) complex exhibits a larger size than that of W/α eutectic structure; it indicates that the former possesses a lower hardness than that of the latter.
Relation between the W phase and the CYS of the sintering alloys
W phase in the SPS bulks
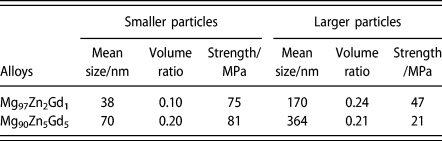
The strength of precipitate-strengthened polycrystalline magnesium alloys depends on the size, distribution, and volume fraction of the precipitates and on the nature of the interface between the precipitates and the matrix [Reference Mordike, Friedrich and Mordike28]. Therefore, the morphology of the W phase and its distribution are considered first in this section. The W phase precipitates from super solid solution when the temperature is higher than 400 °C [Reference Zeng, Zhang, Lu, Ding, Wang and Zhu29]. In the SPS process (≥400 °C), a high load is exerted to increase the possibility of atom migration, and fine W-phase nanoparticles are formed at the short-time stage. Moreover, the bulk W phase that distributes on the grain boundaries has little grown under the high pressure applied in the sintering process. Therefore, the fine W-phase particles in the two SPS bulks have a dual morphology distribution: the smaller ellipsoid-like particles and larger particles with a rectangular or clavate shape. In the SPS Mg97Zn2Gd1 bulk, the total W-phase content is 34 vol%, with ∼10 vol% of smaller particles with the mean size of 38 nm and 24 vol% of larger particles with the mean size of 170 nm. However, in the SPS Mg90Zn5Gd5 alloy, the W-phase size is clearly greater. This difference is mainly because the alloy contains more original coarse W phase found in the corresponding RS ribbons. The total amount of W-phase nanoparticles is approximately 41 vol% in the alloy with high contents of additions, including 20 vol% of smaller particles with the mean size of 70 nm and 21 vol% of larger particles with the mean size of 364 nm.
Strength contribution of W phase to the SPS alloys’ CYS
Orowan strengthening mechanism based on dislocation theory is still a relatively accurate method for explaining the strengthening effect of the particles in metals [Reference Toda-Caraballo, Galindo-Nava and Rivera-Díaz-del-Castillo30, Reference Tahreen, Zhang, Pan, Jiang, Li and Chen31, Reference Nie32]. To evaluate the strength contribution of the W-phase nanoparticles in both SPS alloys, and assuming that the interaction between the dislocation and W-phase particles is through the by-passing rather than the shear mechanism, the Orowan strengthening strength is given by [Reference Nie32].
 $${\sigma _{{\rm{Orowan}}}} = {{Gb} \over {2\pi \sqrt {1 - \nu } \left( {{{0.779} \over {\sqrt f }} - 0.785} \right){d_{\rm{p}}}}}\ln \left( {{{0.785{d_{\rm{p}}}} \over b}} \right)\quad ,$$
where G is the shear modulus of the alloy’s matrix (16.7 GPa for Mg), b is the magnitude of the Burgers vector of the slip dislocations, and because the dislocation gliding on the basal plane of α-Mg phase is predominant during the plastic deformation process, b is determined to be 0.3196 nm, ν is the Poisson’s ratio (0.35 for Mg), d p is the mean precipitate diameter, and f is the volume ratio of the particles. It should be noted that, in this study, the size range of W-phase particles is relatively large: from tens of nanometers to hundreds of nanometers. To simplify the calculation, the synergistic strengthening effect of different W-phase particles is not concerned in this section.
Table I shows the strength contributions of W-phase particles in the two alloys. σOrowan is estimated as obviously different values with various particles size in the SPS Mg97Zn2Gd1 and Mg90Zn5Gd5 alloys. In a word, the strengthening contribution of W phase in the Mg97Zn2Gd1 alloy might be reached about 62% of the yield compressive stress (YCS), but 33% in the Mg90Zn5Gd5 alloy with high content of W particles, without regard to the synergistic effect of different particles size. It suggests that the smaller W-phase particles have greater strength than the larger particles. When the size of the W-phase particles is larger than 100 nm, its strengthening effect clearly decreases despite the strong increase in its content.
Size of W-phase particles and its contribution to YCS in the SPS Mg–Zn–Gd alloys.

In the SPS Mg90Zn5Gd5 alloy, it obviously exists the other main strengthening ways contributing to its YCS. In fact, the solid solution strengthening of this alloy makes an important contribution to its CYS because of its higher Gd and Zn content. Furthermore, the size of the grains (equiaxed grains) in the Mg90Zn5Gd5 bulk is slightly smaller than that in the Mg97Zn2Gd1 bulk, and therefore, the contribution of the grainboundaries strengthening is greater in the former alloy. Thus, the yield strength of the SPS Mg90Zn5Gd5 alloy is significantly greater than that of Mg97Zn2Gd1.
Conclusions
The microstructures and mechanical properties of the SPS Mg alloys with the compositions of Mg90Zn5Gd5 and Mg97Zn2Gd1 containing the W phase were studied in detail in this work, with RS ribbons used as the precursors for the sintering. Then, the results were summarized, and the following conclusions were reached:
The two SPS bulks contain abundant fine W-phase particles with a dual morphology distribution: the smaller ellipsoid-like particles and the larger particles with a rectangular or clavate shape. The mean size of the small particles is smaller than 70 nm, and they mainly distribute in the grains in both SPS bulks. Those W-phase particles with the mean size of more than 100 nm locate both on the grain and their boundaries, particularly for the Mg90Zn5Gd5 bulk, and the mean size of the W-phase particles with the clavate shape is greater than 364 nm.
The CYS and CUS of the SPS alloy with a high content of W-phase particles (about 41 vol%), i.e., the Mg90Zn5Gd5 alloy, are 313 MPa and 504 MPa, respectively, and the elongation is ∼0.14. However, another alloy with a lower W-phase content (about 34. vol%), namely, the Mg97Zn2Gd1 alloy, shows higher ductility (elongation of 0.24) and slightly lower strength (200 MPa and 390 MPa for the CYS and the CUS, respectively). The results of the nanoindentation tests indicate that the hardness of the eutectic W/α structure is twice than that of another zone containing both fine grains and W-phase nanoparticles; however, the latter zone exhibits better plasticity than the bulk W/α structure.
W-phase nanoparticles effectively enhance the Mg alloy as a strengthening precipitated phase. A greater strengthening effect will be obtained with a finer W phase (mean size is less than 100 nm). Based on the Orowan strengthening mechanism, W-phase nanoparticles contribute a big proportion of the yield stress in the Mg97Zn2Gd1 alloy and a relatively smaller ratio of the yield stress in the Mg90Zn5Gd5 alloy.
Experimental section
Materials preparation and sintering process
The as-cast ingots with the compositions of Mg97Zn2Gd1 and Mg90Zn5Gd5 (wt%) were firstly prepared in a resistance furnace under the protection of CO2 + SF6 (99:1 in volume ratio) atmosphere. The raw materials were pure Mg (99.95 wt%), pure Zn (99.95 wt%), and Mg–(30 wt%)Gd. Then, these ingots were remelted by induction heating and subsequently sprayed to obtain the RS ribbons that were processed using the planar flow casting equipment with a single copper roller in the N2 atmosphere (∼500 Pa); here, the speed of the copper roller was approximately 20 m/s. The prepared RS ribbons were several hundred millimeters long, ∼10 mm wide, and 65 ± 15 μm thick.
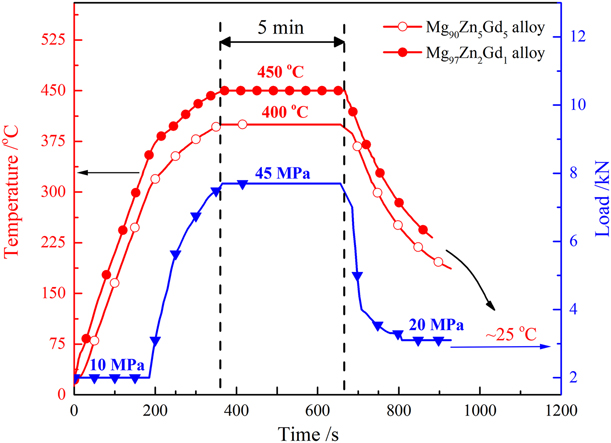
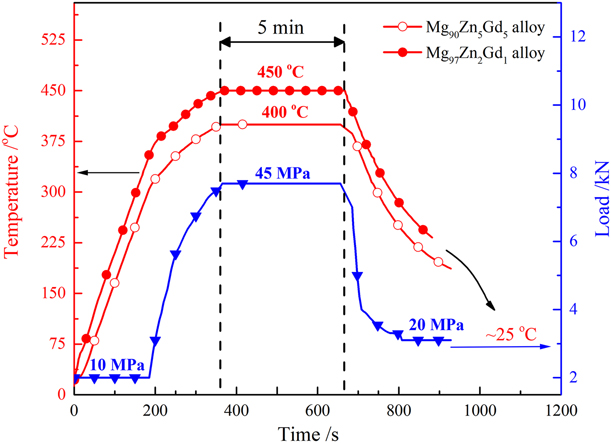
The RS ribbons were subsequently cut to rectangle-like shapes with the dimensions of ∼10 × 10 mm and were placed in a columned graphite die layer by layer. These ribbons were consolidated in the SPS system in a vacuum (<10−2 Pa) (Sumitomo Coal Mining Co., Ltd., Japan). The size of the graphite die is Φ 40 mm × 40 mm in the outer side and Φ 15 mm × 40 mm in the inner hole. Prior to the sintering process, the ribbons in the die were compacted under a load of 10 MPa for 2 min and then the air was degassed. To decrease the friction in the sintering process under high pressure, the interfaces between the die and the ribbons were placed on a 0.2-mm thick graphite layer. The sintering was carried out at 400/450 °C under a load of 45 MPa with holding for 5 min at 400 °C for the Mg90Zn5Gd5 alloy with a lower melting temperature (∼554 °C) and at 450 °C for the Mg97Zn2Gd1 alloy with a higher melting temperature (∼625 °C), and the average heating rate was approximately 85 °C/min in both the processes. The measured temperature was obtained from the inner graphite tool that was located only a few millimeters from the layers. Figure 8 shows the curves of the changing of temperature and the load with increasing of sintering time for the two alloys. At the completion of the sintering process, the samples continued to cool to ∼200 °C with a load of 20 MPa and then cooled to the room temperature without any loading. Finally, the air was aerated into the device and the die was removed. The size of each SPS bulk sample is Φ 15 mm × 6.5 mm.
The sintering temperature and load as functions of time of Mg97Zn2Gd1 and Mg90Zn5Gd5 (at.%) alloys.
Mechanical tests and microstructure characterizing
The compressive tests of the SPS samples were also conducted using a Gleeble-3500 (Dynamic Systems Inc., New York) thermal–mechanical simulator. The samples for the compressive test, with a size of Φ 4 mm × 6 mm, were machined using an electron discharge machining (EDM) machine. The strength and the elongation were obtained based on the mean value of 3 tests in each case at room temperature (25 °C), with a strain rate of 10−3 s−1. Nanoindentation tests were also performed to characterize the micromechanical property of W phase using a Nano Indenter XP tester (MTS, Minnesota) equipped with a Berkovich tip (E i = 1.141 GPa, νi = 0.07). The displacement was recorded as a function of applied loads with high-load resolution (50 nN) and high-displacement resolution (0.01 nm). The measurement parameters were as follows: maximum depth h max = 1000 nm and Poisson’s ratio ν = 0.35. The measured hardness was tested at room temperature (25 °C) and was obtained as the average value of at least 5 sites with similar phase environment.
The phases in the alloy were identified by X-ray diffraction (XRD) (Rigaku Ultima IV 3 kW, Cu Kα radiation, Rigaku, Tokyo, Japan), and the scanning range of 2θ was 10°–90° in each sample. An Olympus-OLS4000 laser (Olympus, Tokyo, Japan) scanning confocal optical microscope was applied for observing the nanoindentation impresses. A Zeiss Auriga-EVO (Zeiss, Jena, Germany) 18 field emission scanning electron microscope (FE-SEM, 0–20 kV) equipped with an energy dispersive X-ray spectrometer (EDS) system was also used to analyze the microstructure of the alloy. Additionally, a Tecnai G2 F30 (FEI, Ohio) transmission electron microscope (TEM) equipped with a HRTEM system was also used to observe the microstructure of the phases and to analyze the parameters of the crystal lattice, with the working voltage of 300 kV. The samples used for SEM were etched in a solution of 4 vol% (volume ratio) nitrate alcohol to reveal grain boundaries. The foils for TEM observation were first mechanically polished to ∼50 μm, punched into discs with the diameter of 3 mm, and then ion-milled using a Gatan plasma ion polisher.
Acknowledgments
This work is supported by the Youth Science Fund Project of National Natural Science Fund of China (51401070). We also gratefully acknowledge Dr. Li You from University of Science and Technology Beijing and Dr. Yu Ren from North China Electric Power University for the helpful discussions.