For most of the eighteenth century, the Bank of Amsterdam (“Bank”) was the premier means of international payment in Europe. This success supported Amsterdam as the center of Europe’s credit and bullion markets. Foreign contemporaries described, with approval, how customers used the Bank (Graumann Reference Graumann1749, Reference Graumann1762; Le Moine de L’Espine and Le Long Reference Le Moine de L’Espine and Le Long1763; Melon Reference Melon1754; Smith Reference Smith1981 [Reference Smith1776]; Steuart Reference Steuart1767). These authors, like the rest of the international community, viewed the Bank as an enhancement of coins, for it was easy to move metal in and out, and the resulting bank money could be easily invested. Better still, the value of bank money was impressively stable, so coins could be reliably and profitably parked at the Bank for extended periods. The Bank, however, neither made policy statements nor shared statistics, so what has remained inscrutable was how the Bank maintained such stability. In modern parlance, what was the Bank’s policy framework, and how did it succeed?
Contemporaries speculated that the Bank had a hoard of coins backing its money. Jean-François Melon guessed the Bank held 100 million guilders in silver and gold (Melon Reference Melon1754, p. 281). James Steuart guessed 60 million, and Adam Smith guessed 33 million (Steuart Reference Steuart1767, p. 304; Smith Reference Smith1981 [Reference Smith1776], p. 487). The actual level in the decade centered on 1770 was 16 million. Foreign observers also figured that the Bank was actively stabilizing the price of its money. Steuart (Reference Steuart1767, p. 302) guessed that the Bank borrowed or lent local Dutch coins. Smith (Reference Smith1981 [Reference Smith1776], p. 486) thought that the Bank was taking deposits. Later authors thought the Bank bought and sold coins mechanically at threshold prices. Instead, this article shows that the Bank of Amsterdam had at best a weak systematic response to the price of its money. Instead, it routinely bought and sold coins to stabilize the quantity of its money. The Bank’s workings were not what they seemed.
To reveal how the Bank supported its money, this article reconstructs for the first time the entirety of the Bank’s balance sheet for the years 1736 to 1791. This completeness allows for the sorting of bank money into a portion controlled by customers and a portion controlled by the Bank. This partition will show that the Bank applied tools similar to a modern central bank towards goals relevant to a commodity-money world.
Like a modern central bank, the Bank of Amsterdam’s money, known as the bank florin, was a fiat account that large firms used to settle financial obligations. Also like today, people used other monies for everyday transactions. In this context, fiat means people cannot deposit or withdraw ordinary money at the central bank. Instead, intermediaries arrange for people to trade monies through a secondary market. In Amsterdam, people used dealers in the form of cashiers (kassiers) to exchange bank florins for local money. The market’s price, known as the agio, was the premium paid to acquire bank florins from an account holder. In present-day New York, the analogous market price is expressed as the effective federal funds rate.Footnote 1 Central banks guide these rates by changing the supply of fiat money. They create fiat money by buying assets from account holders (called outright open market operations) or by lending to customers who offer collateral that is not everyday money (called repurchase agreements). These “tools” are used to steer “market rates” to within a “target range” in what is collectively called a “policy implementation framework.” Eighteenth-century Amsterdam did not use modern terminology, but the Bank of Amsterdam did use analogous tools and targets.
The Bank, however, used its tools to pursue outcomes different from modern practice. The Bank did not have macroeconomic goals such as 2 percent inflation or 4 percent unemployment. Instead, its goal was to provide a money that would attract customers in a competitive international environment. The Bank of Amsterdam’s framework relied on large silver and gold coins, which traded around the world. The Bank of Amsterdam attracted customers when people preferred to park these trade coins at the Bank (Quinn and Roberds Reference Quinn and Roberds2014). They preferred the Bank because there they could borrow against such collateral, using an instrument called a receipt, in a way that was cheap, stable, and almost devoid of counterparty risk. To maintain that accessibility, the Bank of Amsterdam did not alter its terms for loans secured by trade coins. The Bank kept its loan rate at ½ percent, and customers could borrow any amount desired subject to sufficient collateral. In modern terms, the Bank offered the combination of a “standing facility” at a “permazero” policy rate.Footnote 2 In contrast, today’s central banks routinely finesse the principal, rate, maturity, collateral, and other terms of their lending.
Another part of attracting trade coins was the usefulness of the borrowed bank money. Bank florins directly accessed the world of bills and credit that comprised Amsterdam’s money market. To acquire still other assets, such as securities, real property, or consumer goods, bank florins could be converted via the market agio into current guilders, the unit of account for the ordinary money used in the rest of the Dutch economy. Thus, a stable agio was another way to support the bank florin, but the agio had a complicated relationship with easy lending. On the upside, the vigor of the receipt facility created an anchor range for the agio to target. On the downside, the volume of receipt lending could vary substantially, and this article will show that it did. Also, we find that the Bank bought and sold coins to counter these swings. If such swings also upset the agio, then the Bank could use operations to push the agio back towards its target, but we find less evidence of this.
Discovering how the Bank of Amsterdam operated also helps to discern the tension between the outcomes sought by the Bank and by its owner, the City of Amsterdam (“City”). A successful bank florin was a public good supporting a thriving financial sector, and such popularity was profitable. Receipts generated fees, open market operations turned a profit, and unsecured loans to the Dutch East India Company paid interest. Each year, the City took these operating profits instead of allowing the Bank to build a war chest. The lack of retained earnings forced sudden halts in the Bank’s selling, especially during the Seven Years’ War, 1756–1763. Later, unsecured loans proved an even greater problem. During the Fourth Anglo-Dutch War (1780–1784), naval defeats caused massive loan failures which made the Bank effectively insolvent (Van Dillen Reference Van Dillen and van Dillen1964b; Quinn and Roberds Reference Quinn and Roberds2016). Customers abandoned the Bank, and the agio never recovered. In both cases, seigniorage undermined the Bank’s stabilization goals.
This article describes and measures a policy framework that combines what the City wanted from its bank, what the Bank wanted from its own efforts, and how the Bank deployed its tools in pursuit of it all. To create the data series, all transactions altering the Bank’s balance sheet were encoded by hand from original documents. Then each change in the amount of bank florins (liability side) was matched to a change elsewhere on the balance sheet to allow the apportionment of all bank money into three tools: receipts, open market operations, and unsecured lending. Use of these tools suggests four operational targets: maximum receipts, a stable quantity of bank florins, an agio within its anchor range, and prudent loan levels. Of those, receipts were paramount. Those targets worked to support two goals: a popular bank florin and operating profits. During most of the era, that framework delivered to the City both seigniorage and a flourishing financial sector. At two critical junctures, however, decades of profit taking suddenly expressed as instability, and, in the end, the framework failed because the City could not reconcile seigniorage and stability.
CONNECTIONS TO THE LITERATURE
The analysis described later draws on a large literature on the Bank of Amsterdam, including contemporary descriptions (Graumann Reference Graumann1749, Reference Graumann1762; Le Moine de L’Espine and Le Long Reference Le Moine de L’Espine and Le Long1763; Melon Reference Melon1754; Smith Reference Smith1981 [Reference Smith1776]; Van der Oudermeulen Reference Van der Oudermeulen1791) and historical accounts (Mees Reference Mees1838; Van Dillen Reference Van Dillen1925, Reference Van Dillen and van Dillen1934, Reference Van Dillen and van Dillen1964b, Reference Van Dillen and van Dillen1964c; Van der Laar Reference Van der Laar1978; Gillard Reference Gillard2004; Uittenbogaard Reference Uittenbogaard and van Nieuwkerk2009; Dehing Reference Dehing2012). Specific connections and parallels to this literature are discussed throughout, but the core contribution of this article is to reconstruct the Bank’s balance sheet for the years 1736 to 1791. Related quantitative works look at the transition to fiat money in the previous century (Quinn and Roberds Reference Quinn and Roberds2014), at the crisis of 1763 (Quinn and Roberds Reference Quinn and Roberds2015), and at the decline of the bank florin starting in 1782 (Quinn and Roberds Reference Quinn and Roberds2016). In contrast, this article focuses on the many years of the Bank’s stability and success.
Our analysis also carries implications for the general history of central banking. Unusually for its time, the Bank of Amsterdam operated under a quasi-fiat standard, but at the same time it tried to maintain a (de facto) target metallic value for its money. Amsterdam lacked exchange controls (Van Dillen Reference Van Dillen1964a), so the Bank’s adoption of a constant and low policy interest rate and a target exchange rate for its money set the stage for extreme capital flows. This situation is a familiar set of stresses associated with the Mundell-Fleming trilemma (Bordo and James Reference Bordo and James2014). Lacking the modern “lever” of changes in its policy interest rate to manage such flows, the Bank relied instead on open market interventions, which sometimes proved inadequate.
The Bank’s approach to managing the trilemma is perhaps most directly comparable to that of central banks operating during the pre-WWI gold standard. The two leading central banks of the classical era were the Bank of England and the Banque de France, institutions whose policy frameworks have been the subject of recent, detailed studies (Ugolini Reference Ugolini and Bott2013, Reference Ugolini2016; Bazot, Bordo, and Monnet Reference Bazot, Bordo and Monnet2016). These articles show that gold-standard central banks did not always follow the well-known “rules of the game” (which called for manipulation of policy rates to counter gold flows), but instead they used a variety of quantitative interventions to add or withdraw their monies from markets. Such interventions were often employed in preference to changes in discount rates, which were viewed as disruptive to commerce. In the case of France, gold flows were usually completely sterilized, and policy rates changed only as a last resort.Footnote 3 In London, the Bank of England manipulated the bid-ask spread on foreign gold coins,Footnote 4 and Stefano Ugolini (Reference Ugolini and Bott2013, p. 82) concludes that such “gold devices may be seen as the very refined tools of a mature central bank’s policymaking.”
As will be demonstrated later, the policy framework of the Bank of Amsterdam offers an earlier and even more extreme example of this same preference. The Bank’s commitment to its policy rate did not waver, nor did the Bank “realign” its implicit target band as a way of responding to the pressures of the trilemma, as regularly occurred under twentieth-century arrangements such the Exchange Rate Mechanism of the European Monetary System (Eichengreen and Wyplosz Reference Eichengreen and Wyplosz1993; James Reference James2012). Moreover, open market sales and purchases of coins anticipate the tactics of gold-standard central banks by some 150 years. In contrast to these later institutions, the Bank’s commitment to a metallic monetary value was relatively informal, and its interventions correspondingly less consistent.
The literature on extended low policy rates in modern economies offers a range of predictions of their potential consequences. These include the possibility of unstable inflation and subpar growth (Benhabib, Schmitt-Grohé, and Uribe Reference Benhabib, Schmitt-Grohé and Uribe2001; Bullard Reference Bullard2010), unstable policy expectations followed by inflationary breakouts (Bassetto and Phelan Reference Bassetto and Phelan2015), or simply the anchoring of inflation at low levels (Cochrane Reference Cochrane2016). It bears emphasizing that the Bank of Amsterdam, unlike modern central banks operating near the zero lower bound, was not pursuing a conscious policy of macroeconomic stabilization. Nonetheless, the sample studied in the next section offers some noteworthy echoes of these predictions.
Inflation seems to have been well contained in the Dutch Republic over our sample, thanks both to the policies of the Bank and to a 1694 coinage reform (Van Zanden Reference Van Zanden2013; Polak Reference Polak1998). The picture is less favorable on the output side, where available data suggest a stagnation or gradual decline in aggregate output, despite a mid-century peak in Bank payments activity (Van Zanden and Van Leeuwen Reference Van Zanden and van Leeuwen2017). Historians generally attribute this lackluster performance to a heavy fiscal burden and a decline in trade dominance (De Vries and Van der Woude Reference De Vries and van der Woude1997) rather than to monetary factors. Finally, our data reconstructions strongly suggest that the Bank’s monetary regime was at times subject to unstable market expectations and speculative attack. In such situations, the Bank’s monetary framework could then serve to amplify the potential for market disruption, as will be discussed next.
THE BANK OF AMSTERDAM: THREE WAYS TO MAKE MONEY
The Bank of Amsterdam was an agency of the City of Amsterdam chartered in 1609 and liquidated in 1820. It was housed on the ground floor of the town hall. Major policies were set by the city council (vroedschap), more routine guidance and oversight was conducted by the city’s executive council (burgemeesters), and a team of four commissioners (commissarissen), appointed by the city council for renewable one-year terms, managed the Bank’s permanent staff (‘T Hart Reference ‘T Hart and van Nieuwkerk2009, pp. 145–6). The Bank’s credibility followed from consistent political support rather than from a separation from municipal authorities.
The Bank’s primary backing asset was coin. Government securities did not play this safe-asset role in eighteenth-century Amsterdam, in part because the Dutch Republic had relatively fragmented and illiquid markets for government debt (Gelderblom and Jonker Reference Gelderblom and Jonker2011; Van Bochove Reference Van Bochove2013). Instead, this role was played principally by high-denomination, high-metallic-content gold and silver coins produced in the Netherlands and elsewhere. Trade coins were liquid everywhere in Europe, and many had an exceptional liquidity value in certain markets (De Vries and Van der Woude Reference De Vries and van der Woude1997, p. 84).Footnote 5 Trade coins also had a unique status within Amsterdam, due to their eligibility for a receipt. A customer could borrow against trade coins to obtain credit on their Bank account. These accounts were the money the Bank lent at a low rate. At its mid-eighteenth-century peak, the Bank maintained about 3,000 accounts as compared to Amsterdam’s population of 200,000 (Dehing and ‘T Hart Reference Dehing, ‘t Hart, ‘t Hart, Jonker and van Zanden1997).
Bank accounts were valuable because they were the legal means to discharge bills of exchange payable in Amsterdam. As Smith noted, “Every Merchant, in consequence of this regulation, was obliged to keep an account with the bank in order to pay his foreign bills of exchange, which necessarily occasioned a certain demand for bank money (Reference Smith1981 [Reference Smith1776], p. 481).” Bills, in turn, were central to the money market because commercial lending was dominated by direct lending via bills instead of loans arranged by deposit banks (Gelderblom, Jonker, and Kool Reference Gelderblom, Jonker and Kool2016). The Dutch Republic had only rudimentary and underdeveloped deposit banks (Jonker Reference Jonker1996). Instead, the leading financial houses were merchant bankers that lent by purchasing bills and funded this lending by accepting bills instead of deposits. This “matched-book” approach to leverage created an early example of shadow banking.
For much of the period we study, Amsterdam was home to the deepest bill market in Europe (Gillard Reference Gillard2004; Flandreau, Galimard, Jobst, et al. Reference Flandreau, Galimard, Jobst and Nogués-Marco2009; Carlos and Neal Reference Carlos and Neal2011; Dehing Reference Dehing2012). Payments activity through the Bank was correspondingly intense. Turnover in Bank accounts was about 388 million florins in the early 1760s (Dehing Reference Dehing2012, pp. 82, 140), equal in value to almost 3,400 tons of silver, or 1.5 to 2 times annual Dutch GDP (De Vries and Van der Woude Reference De Vries and van der Woude1997, p. 702) or 2.5 times the GDP of the province of Holland (Van Zanden and Van Leeuwen Reference Van Zanden and van Leeuwen2017). Much of this payment activity supported the movement of goods and capital throughout Europe, reflecting the “vehicle currency” status of the bank florin. As a standard of comparison, an analogous ratio for the Federal Reserve (annual value of Fedwire payments over U.S. GDP) comes in at 2.65 at the peak of the Bretton-Woods era in 1955 (Committee on Payment and Settlement Systems 1980).
At its founding, the Bank of Amsterdam was a giro bank that took deposits.Footnote 6 Following a 1683 policy change, the Bank of Amsterdam’s money evolved into a de facto fiat money, in the sense that it carried no inherent right of redemption: the metallic value of the bank florin was what the market determined it to be (Van Dillen Reference Van Dillen and van Dillen1934, Reference Van Dillen and van Dillen1964b; Dehing Reference Dehing2012; Quinn and Roberds Reference Quinn and Roberds2014). As a publicly owned manager of a fiat money, the Bank was similar to a modern central bank. A stylized balance sheet for the Bank is shown in Table 1.
BALANCE SHEET OF THE BANK OF AMSTERDAM (18TH CENTURY)

Source: See text.
The monetary liabilities (denoted M) of the Bank existed only as balances in bank accounts. The Bank never issued circulating currency. These accounts correspond to reserve accounts at modern central banks, and every merchant bank and most large merchants in Amsterdam had such an account. On the asset side, the bulk of the Bank’s portfolio consisted of silver (and to a much lesser extent gold) coin. Following the Bank’s own accounting system, we divide the Bank’s holdings of coins into two categories. If coins were subject to a receipt option, Table 1 labels them encumbered, E. If not, then they are unencumbered, U. Unsecured loans are L. The next three sections explain how the Bank used each type of asset to create account balances.
The Receipt Window
An account holder who wanted to convert trade coin into bank money could sell the coin to the Bank at a posted official price, receiving in return (1) credit to his or her bank account and (2) a receipt for the coin sold. The receipt allowed a person to repurchase the coin for a small fee. A receipt was, in modern terminology, an American call option on the type of coin sold (and no other coin) with an expiration date of six months after the sale, and a repurchase, or “strike,” price slightly above the original sale price.
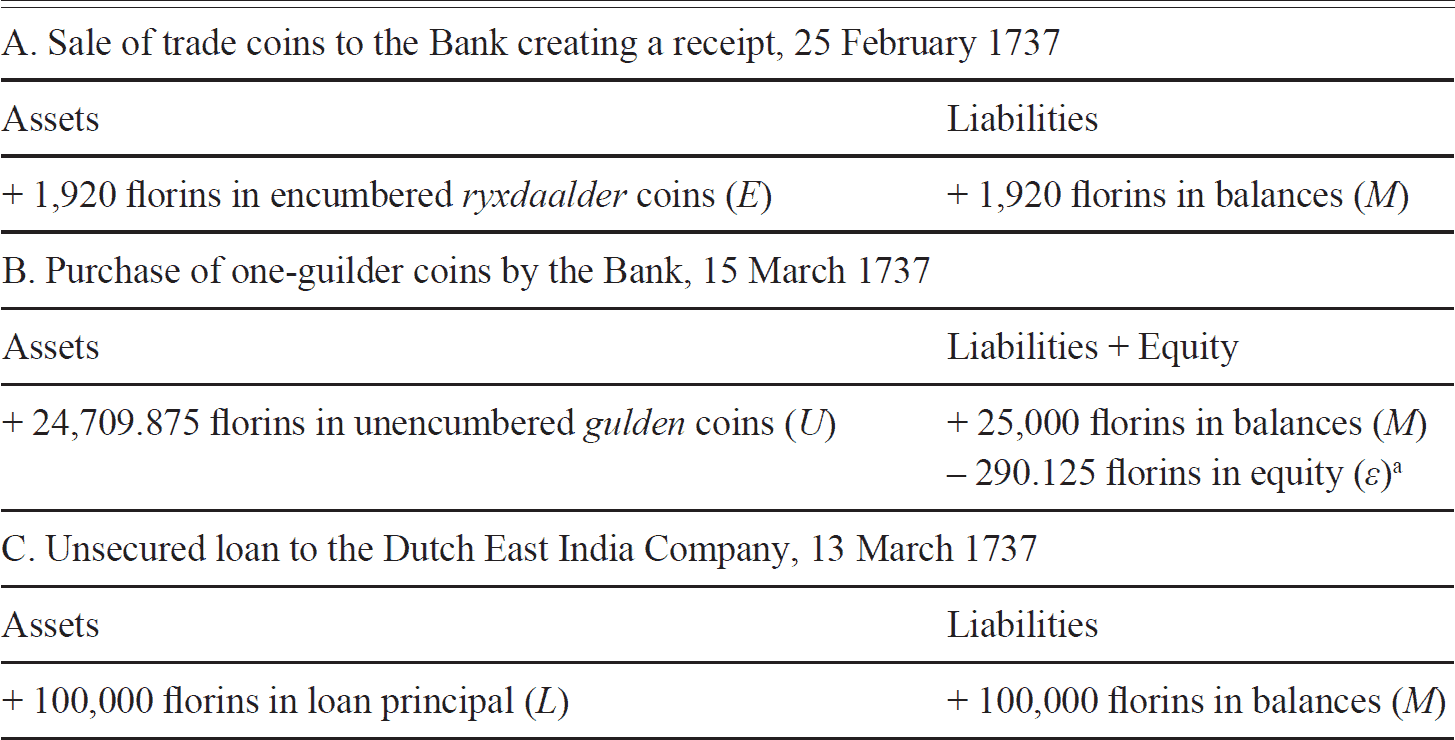
Take, for example, a transaction: in February 1737, Jan Albert Vos sold 800 silver ryxdaalder coins to the Bank for 1,920 bank florins and a receipt. The Bank’s account liabilities increased with a corresponding increase in assets. See Table 2.A. To the Bank, the coins were in effect “encumbered” (E) by the call option embedded in the receipt. Receipts were not deposits in the modern sense of a generalized demandable debt claim against the Bank. Instead, such sales generated a negotiable claim against only a specific type of collateral; that is, a receipt.
THREE WAYS TO CREATE BANK MONEY WITH BALANCE SHEET EFFECTS

a To simplify accounting, the Bank adjusted the assets to a record-keeping agio of 5 percent. At sale, the reverse adjustment creates a profit.
Sources: A. Amsterdam Municipal Archives [hereafter AMA] 5077/297, folio 1308 and AMA 5077/1378, folio 47. B. AMA 5077/1378, folio 44. C. AMA 5077/297, folio 1503.
For the silver trade coins that constituted the bulk of the Bank’s receipt business, the repurchase price of a receipt was generally 1/4 percent higher than the sale price. For a few favored domestic silver coins, this margin fell to 1/8 percent, and it rose to 1/2 percent for gold coins. In the rare instances of rate adjustment, the Bank standardized these outlier rates to 1/4 percent, but such coins were never major sources of receipt business.Footnote 7 Receipts could be extended for another six months at the same cost as for redemption, and receipts were fully negotiable as bearer instruments.Footnote 8
The great majority of the time, the call option inherent in a receipt was “in the money”; that is, the price for repurchasing the coin listed on the receipt was below its market value, so the receipt was eventually redeemed. The function of a receipt was thus much like a modern central bank (term) repo, providing liquidity to the money market against liquid collateral at a policy interest rate.Footnote 9 From the beginning of the receipt system in 1683, the Bank’s implied policy interest rate was simply the redemption fee of 1/4 percent per six months, or about 1/2 percent annualized. Such a low rate was feasible because the Bank scrupulously maintained a complete stock of all trade coins encumbered by receipts. This rate was substantially lower than contemporary rates on relatively secure but uncollateralized instruments, such as bills of exchange (with a mean return of around 4 percent) or the debt of the province of Holland (about 2.5 percent, see ‘T Hart Reference ‘T Hart, ‘t Hart, Jonker and van Zanden1997).
The repo-style credit available through the receipt window was a key advantage of Amsterdam over other contemporary financial markets. Essentially, the existence of this facility (combined with an absence of capital controls) meant that trade coins could be more liquid in Amsterdam than elsewhere, since coins under receipt could be utilized for transactions in the Amsterdam market, pending their shipment to other markets where their highest value could be realized.Footnote 10 By this means, the receipt facility allowed Amsterdam merchants to carry long positions in trade coin at a low cost. Johann Philipp Graumann (Reference Graumann1762, p. 137), an experienced trader in coins and bills of exchange, recognized this function of the receipt facility and described it as follows (our translation):
How advantageous this lending [facility] must be for the merchant community, can be seen from the fact that with this facility, the merchant can put into motion and utilize all the monies [trade coins] that accrue to him. Otherwise he would have to allow the same foreign coins to sit unused, and at going [bill] interest rates lose more money than he would pay for borrowing [at the receipt window]. By this means the money is effectively doubled, or twice put at the disposal of commerce, since the merchant can make use of practically all of the capital that he has placed in the bank. In addition, he remains master of this money, and by repayment of the sum advanced, is authorized to either withdraw it himself, or sell it to others.
Despite the parallels, there is an essential difference between the receipt system and modern central bank repos. The policy interest rate inherent in the receipt system was an administered rate rather than a target for market rates, as is preferred by many central banks today. The quantity of credit generated through this standing facility was not under direct control of the Bank. This, however, did not mean that the Bank was indifferent to fluctuations in its money stock.
Operations in Unencumbered Coin
An alternative way for Amsterdam merchants to acquire Bank funds was to purchase such funds from people with accounts at the Bank. Inside the Bank, florins were transferred from one account to another. Outside the Bank, coins were delivered in the opposite direction. This was typically done through dealers who were active in a secondary market that took place in front of the Bank and charged bid-ask spreads of 1/8 percent or lower.
The coin behind this secondary market was the Dutch silver gulden. It was worth one current guilder and acted as both the unit of account and the basic medium of exchange for the Dutch economy. The prices of goods, services, real estate, taxes, and financial products (other than international bills of exchange) were denominated in current guilders. Purchases could be paid with gulden coins or with private arrangements such as cashier accounts or personal IOUs that represented gulden coins. To clarify presentation, we use “florin” for bank unit of account, “guilder” for current unit of account, and “gulden” for the coin worth one guilder while noting that contemporaries used these terms interchangeably.
The word agio derives from Italian for an exchange rate premium, and in Amsterdam the agio was as the premium of bank florins relative to current guilders. By the eighteenth century, it was the universally acknowledged barometer of the florin’s monetary value. The market agio was routinely reported in the financial press and Amsterdam merchants would have been well informed about its current value. Since the metallic content of a silver gulden coin was largely constant during this time, a stable agio also implied a stable metallic value for the bank florin.
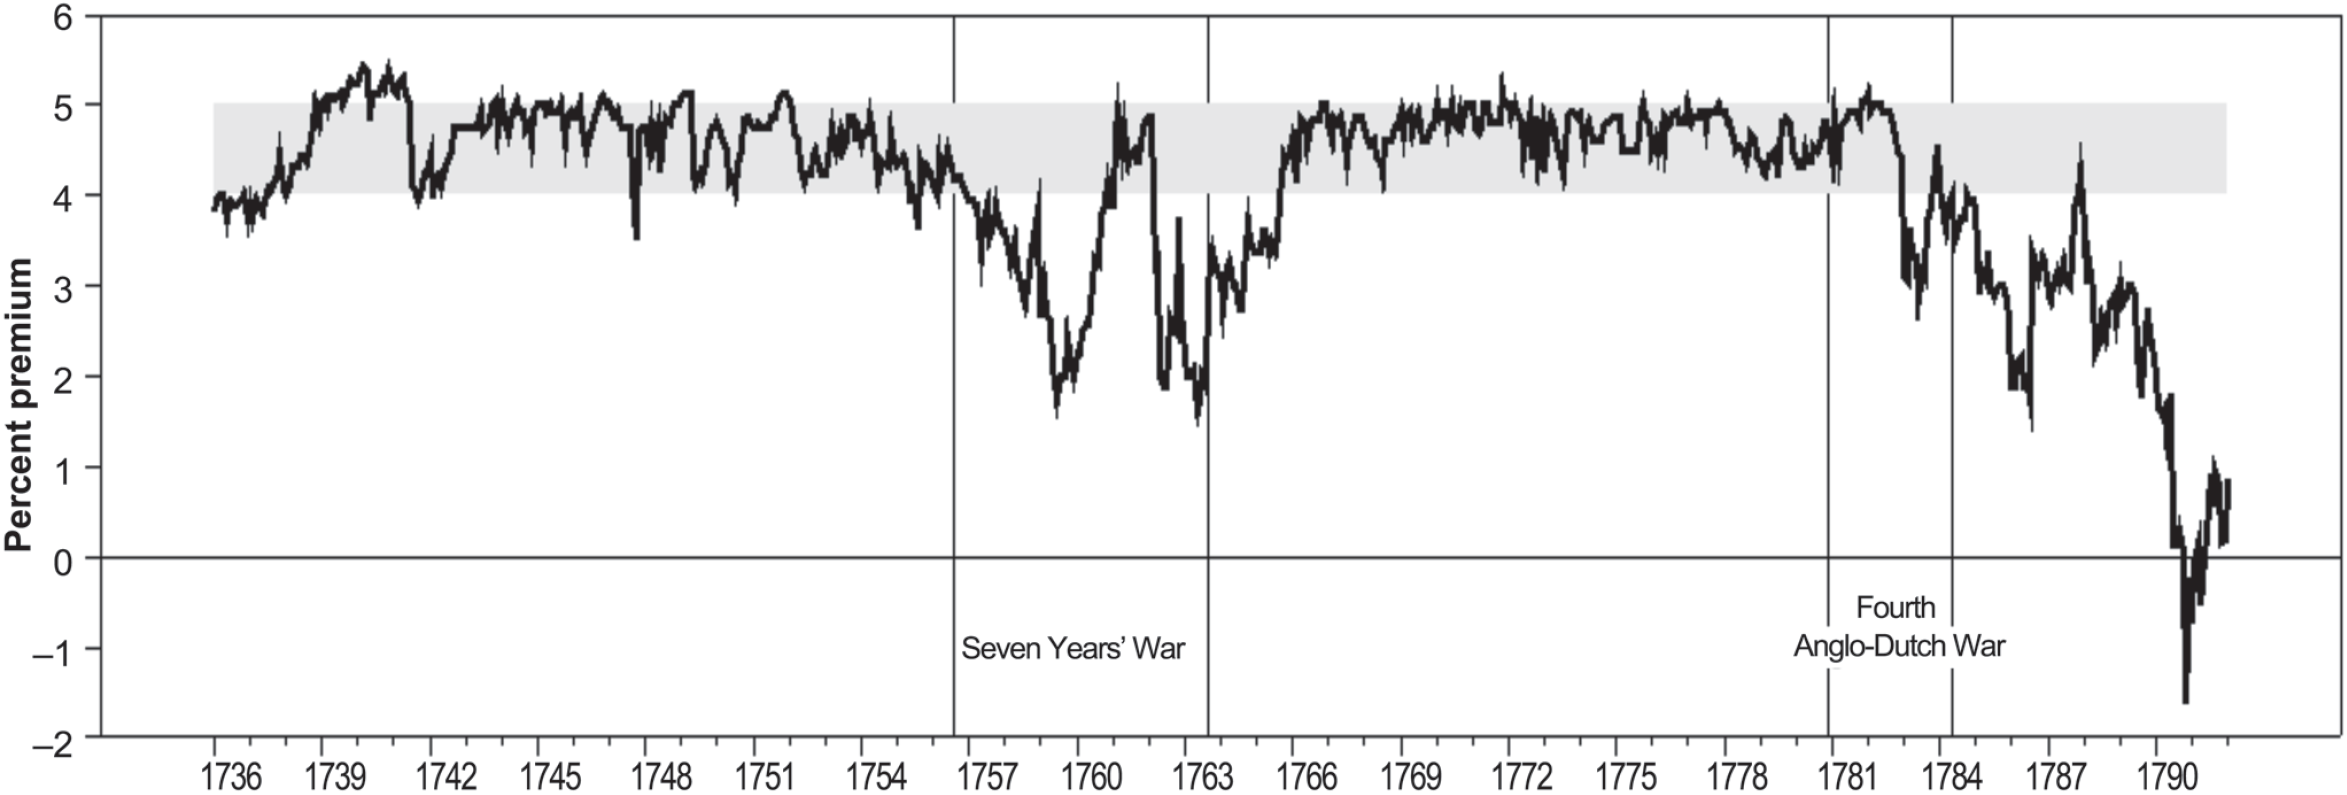
Figure 1 plots monthly values of the market agio from December 1735 to January 1792. A ratio of 1.05 current guilders per bank florin was reported as an agio of 5 percent. The agio stays between 4 and 5 percent for most of the sample except during the Seven Years’ War, and during the period of the Bank’s decline from the Fourth Anglo-Dutch War onward.
MARKET AGIO, 1736:1–1792:1 (Percent Premium Bank Florin over Current Guilders)

The Bank routinely intervened in the agio market by buying and selling large quantities of gulden coins at the going market price in the same way as modern central banks buy and sell securities in outright open market transactions. No receipts were granted for these purchases because gulden coins were not considered trade coins. For an example, we return to 1737. The Bank purchased 25,945.375 current guilders (in the form of gulden coins and small change) from a dealer named Arnoud Borchers at an agio of 3–15/16 percent. Borchers got 25,000 bank florins with a corresponding increase in coin held by the Bank (see Table 2.B). The Bank’s purchase operations, together with trade coins whose receipts had expired, gave rise to a stock of unencumbered coin, U, in the Bank’s vault. Coins acquired in this fashion were owned outright by the Bank and could be readily sold back into the market.
For long periods, the agio traded in a range of 4 to 5 percent. Those thresholds derived from the coinage laws of the Dutch Republic. Each domestic trade coin C had an implicit agio aC, defined by
 $$a_c = 100 \times \left( {\left( {\frac{{{\text{legal value of coin }}C{\text{ incurrent guilders}}}} {{{\text{legal value of coin }}C{\text{ in bank florins}}}}} \right) - 1} \right).$$
For example, ordinances declared each ryxdaalder coin to be worth 2.5 current guilders outside the Bank, versus 2.4 florins within the bank. Ryxdaalder coins put under receipt created an implicit agio of:  $$a_{ryxdaalder} = 100\left[ {\left( {\frac{{2.5}}{{2.4}}} \right) - 1} \right] = 4.167$$. Each Dutch trade coin had a slightly different implicit agio because bank florin and current guilder values varied slightly (see Polak Reference Polak1998). These implicit agios applied to the first “leg” of the receipt agreement and set the floor of the range. These agios were implicit, however, because the bank did not exchange trade coins for current guilders at the receipt window.
To repurchase in the second “leg,” customers also had to pay the 1/4 percent fee, so the implicit agio for each coin leaving the Bank was greater than when entering by that amount. Before the 1683, Bank fees had been higher, and, consequently, the range had been wider (Quinn and Roberds Reference Quinn and Roberds2014, p. 3). The consistently low policy rate translated into the consistently narrow range exhibited in Figure 1.
The range could act as an anchor because of specie-flow incentives. For example, a market agio higher than a coin’s implicit agio encourages the inflow of those trade coins, and the resulting increase in the stock of bank florins would then push down the market agio. As with other specie-flow examples, such as the classical gold standard, these incentives can prove weak relative to liquidity values, expectations of future price movements, and the other reasons people exchange money. In the Dutch case, most of the coins placed at the Bank were foreign with guilder values at market prices. Such coins offered no assurance of arbitrage.
Even the Dutch trade coins accepted by the Bank were rarely used in regular circulation. They traded at a liquidity premium and had to be acquired for a fee from mints or money changers. For example, Graumann (Reference Graumann1749, p. 13) notes that “[d]ue to their widespread use [abroad], Dutch silver rijksdaalders trade several percent higher than their domestic value, and in the Baltic their value is bid up even higher.” And “[b]ecause the Dutch East India Company can sell Dutch silver rijders profitably in the East Indies, they trade at several percent above their Bank price” (Graumann Reference Graumann1749, pp. 13–14). As a result, the market agio could trade outside the implicit target range, especially if few domestic trade coins were under receipt at the Bank.
Also, receipts distorted specie-flow incentives. A market agio below an implicit agio encouraged redemptions, but one had to have a receipt to take advantage. Receipts could be purchased from other people, so Pit Dehing (Reference Dehing2012, pp. 124–26) argues that receipt prices had an inverse relationship to the market agio. While there is insufficient data to confirm the strength of this relationship, paying more to acquire a receipt reduces the arbitrage gains. Similarly, the ability to sell a valuable receipt undermines the disincentives to bring trade coins to the Bank when the agio is low. In contrast, receipts have little value when the agio is above the target range, so incentives are less affected. In the extreme, receipts can have so little value that people do not pay to roll them over. As a result, specie-flow incentives are stronger for agios above the target range than below. In Figure 1, the agio sometimes lingers below the anchor for extended periods. In no period did the agio linger above the anchor.
Unsecured Loans
Yet another way to create bank accounts was for the Bank to engage in unsecured lending. The great bulk of such loans were made to two privileged borrowers, the Dutch East India Company (“Company,” also known by its Dutch initials VOC) and the City.
The Company frequently borrowed balances from the Bank against unsecured notes known as anticipations, which were to be repaid by the sale of goods in transit from Asia to the Netherlands. Loans to the Company show up in the Bank’s balance sheet as increases in loan assets (L) and increases in account liabilities M. For example, a loan of 100,000 florins to the Company increased the stock of bank money by the same amount (see Table 2.C). Such short-term borrowing allowed the Company to outfit one year’s trading fleet and pay out dividends to its stockholders, while awaiting the return of a previous year’s fleet. These loans also helped the Company purchase the large stocks of precious metals that were carried by its fleets to Asia (Gaastra Reference Gaastra and Richards1983). The city council authorized the Company’s line of credit, and the interest earned was an important source of income to the Bank (Uittenbogaard Reference Uittenbogaard and van Nieuwkerk2009). Most of these loans appear to have been granted automatically at the discretion of the Company.
Since the City owned the Bank, its status as a borrower was different. Until the 1780s, loans extended to the City carried no interest and were operationalized through the removal of unencumbered coin U from the Bank’s vault. These had no direct effect on the amount of bank florins outstanding. The City attended to these “loans” when and how (write-down or repay) it wanted, so they functioned as adjustments to the Bank’s equity (ε). This also occurred when the City took the Bank’s residual profits as seigniorage.
City loans enter account transactions only when the City began to borrow bank balances in 1782. The City directed most of these new bank florins to a new municipal lending agency (Stadsbeleeningkamer or “municipal loan chamber”) that the City used to disperse loans to individuals. The loan chamber did reliably repay the bank with 2 percent interest, but the chamber continuously re-borrowed to do so. It is unclear whether the Bank was permitted to ration the supply of credit to the chamber.
TOOLS, TARGETS, GOALS, AND MANDATES
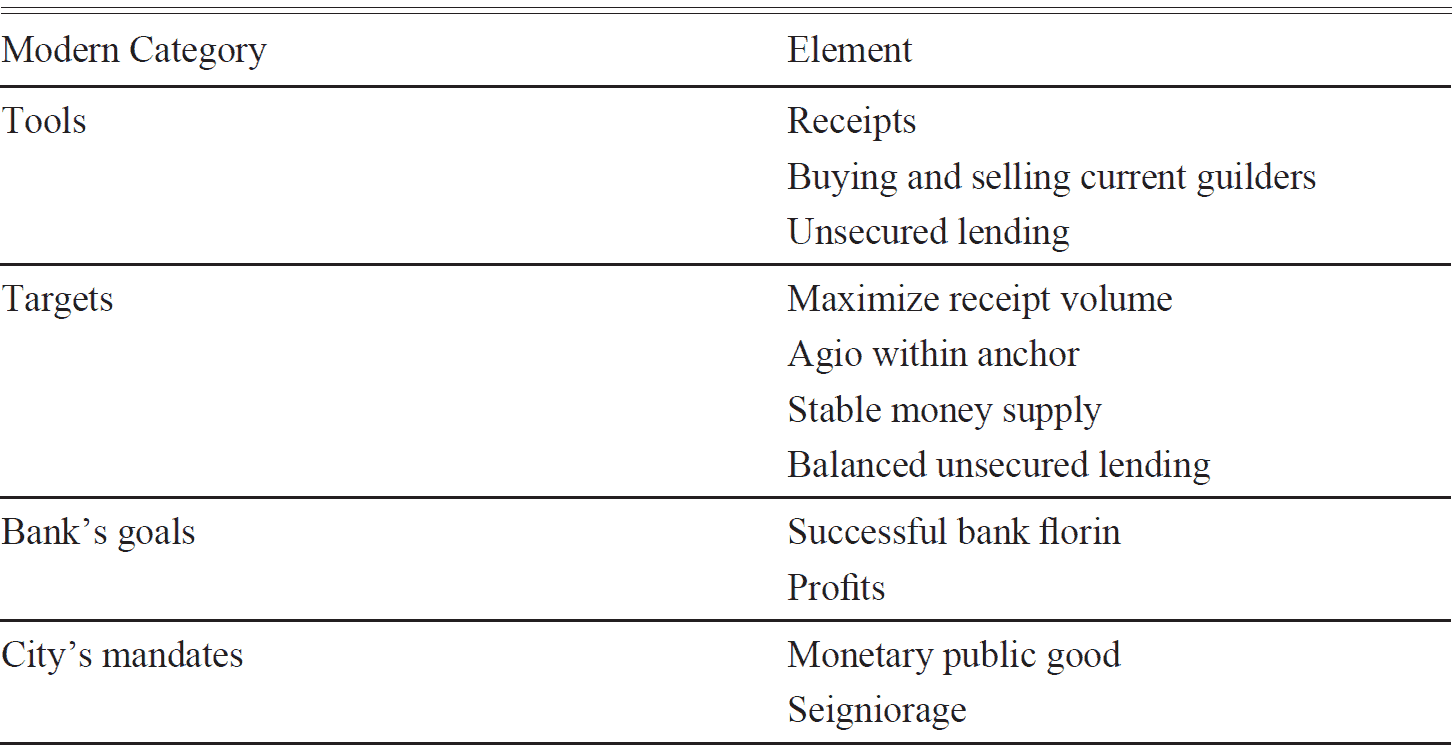
Receipts, operations, and loans were distinct tools, and each served a purpose for the Bank. In modern terminology, tools guide market behavior towards targets, targets promote goals set by a central bank, and goals pursue mandates set by the controlling political authority. To see the distinctions, consider an example. In April 1782, the city’s executive council instructed the commissioners of the Bank to use open market operations to stabilize the agio within its anchor range (authors’ translation of Van Dillen Reference Van Dillen1925, pp. 433–34):
That the agio of bank money shall be held to a constant standard as much as is possible; and in particular, that [the agio] should be as little as possible be driven below four percent, or above five percent. To prevent this, whenever the agio is high, [the commissioners] shall enable the assayer to buy current money with bank money; and they should likewise anticipate that with a fall in the agio, they must exchange current money for bank money. But whenever the commissioners are of the thought that the circumstances are not advantageous for these activities, then they should implement these only as they deem appropriate.
In this instruction, operations are the tool and the anchor range is the target. The instruction does not state why the City wanted the agio stabilized, but circumstances are suggestive. The directive is the only extant of its kind, and it came just as receipts were fleeing the Bank in a massive run. The timing suggests the City wanted the Bank to resuscitate demand for receipts and thought that keeping the agio on-target would help. If so, then their fear was well founded, for the agio fell below 4 percent in January 1783 (see Figure 1). The instruction implies a mandate of a thriving bank florin, and the last sentence grants the Bank latitude to balance goals to achieve that. That flexibility was used in the 1780s. A petition presented to City in 1791 argued that the de facto policy of the Bank had loosened to selling when the agio fell below 3 percent (Van Dillen Reference Van Dillen1925, p. 451), but by then the agio was trading around one percent (see Figure 1).
Looking backwards in time, the instruction of 1782 makes no mention of the Bank’s previous policy, and the instruction itself was likely secret, since it also commanded the Bank’s assayer to keep the terms and purpose of stabilization operations secret (Mees Reference Mees1838, pp. 327–28). Regardless, subsequent authors applied the instruction to earlier decades and made the interpretation more mechanical. Cornelis van der Oudermeulen (Reference Van der Oudermeulen1791, p. 59), postulated a tighter target range: “when bank money rose to 5 percent, the Bank sold bank money at 4–7/8 percent, and took the decision to buy at 4–¼ percent when the agio was depressed.” This range became the standard interpretation (Mees Reference Mees1838, p. 107; Van Dillen Reference Van Dillen and van Dillen1934, p. 102; Van Dillen Reference Van Dillen and van Dillen1964b, p. 404). More recently, Dehing (Reference Dehing2012, pp. 127–9) worked forward from the Seventeenth Century experience to argue that the Bank used transactions in bullion and in receipts rather than in current money; however, no records exist in the era under study here of the Bank creating receipts other than through the receipt window. Also, by 1736, the Bank was winding down transactions in bullion, and it stopped buying bullion altogether in 1753.
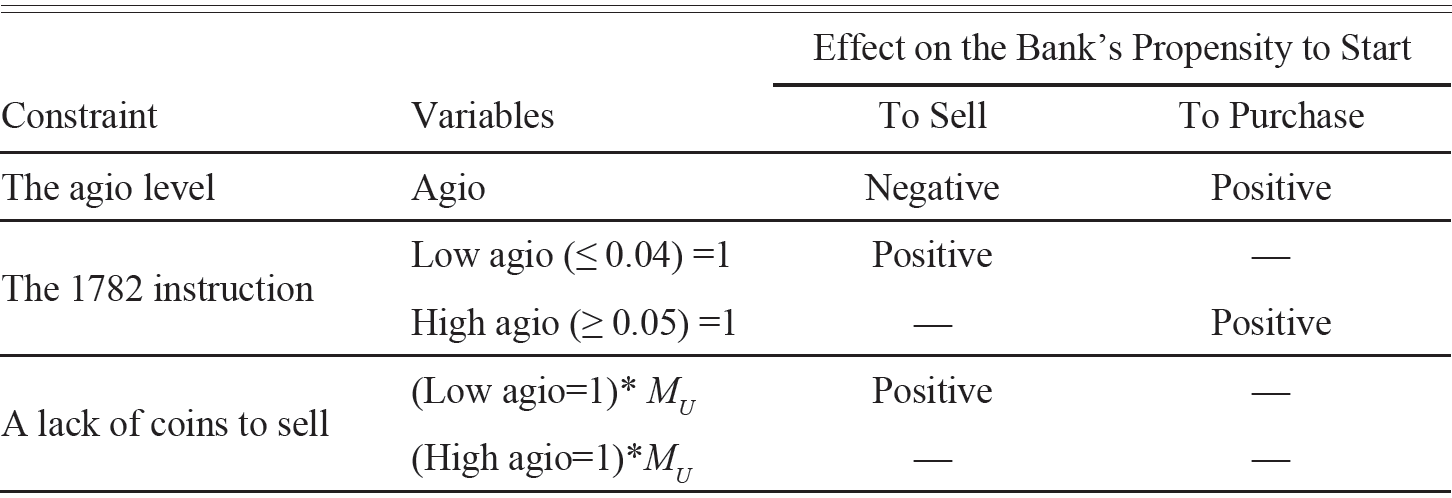
Table 3 organizes these elements of the Bank’s policy framework into the modern categories of tools, targets, goals and mandates. From this perspective, the following sections ask whether the Bank was systematically using operations (a tool) to stabilize the agio (a target) by measuring if agios above or below target triggered appropriate purchases or sales. Also, the market’s application of the underlying dynamic of specie-flow can be evaluated. Does an increasing agio draw in receipts? If so, does the resulting increase in the quantity of money push down the agio? In the process of seeking quantitative answers, the data analysis of the next section reveals that the Bank often used operations to offset changes in receipts. This worked to stabilize the quantity of bank money and suggests an alternate target that is often antithetical to the instruction of 1782. The instruction would accelerate a specie-flow process. In contrast, using operations to sterilize changes in the demand for receipts would thwart the quantity adjustment process. Evidence for intentional sterilization is whether changes in receipts cause offsetting changes in operations but not the reverse.
ELEMENTS OF THE BANK OF AMSTERDAM POLICY FRAMEWORK

Source: See text.
A target of quantity stabilization is not incompatible with agio stabilization, but it does suggest a different mechanism. It was common during the classical gold standard that people expected the combination of a specie-flow mechanism and a supportive central bank to reliably bring rates back into their target ranges, so markets preempted the process and quickly moved rates back themselves (Eichengreen Reference Eichengreen1992, p. 30; Officer Reference Officer1996, p. 197). Moreover, market expectations during this era were actively supported through central banks’ open market operations (Bazot, Bordo, and Monnet Reference Bazot, Bordo and Monnet2016; Ugolini Reference Ugolini and Bott2013, Reference Ugolini2016). If similar expectations were driving agio stability, then the agio would return to the target range before being pushed by quantity adjustments. In statistical terms, the agio should be highly autoregressive, and the purpose of a quantity stabilization target becomes to reinforce market expectations by keeping the agio away from thresholds. Since sterilization is at odds with specie-flow, it follows that the Bank would keep it a secret. If market participants believed that the Bank was actively adjusting quantity to stabilize the agio, then the Bank had no incentive to correct them. Recall that both contemporaries and the subsequent literature thought the Bank was doing just that, despite the Bank never saying it was.
Receipts were a different tool. The constancy of borrowing terms suggests that the City and the Bank wanted reliable and cheap borrowing to encourage customers to bring in trade coins. A robust level of receipts was a desirable goal: receipts anchored the agio, generated fees, deepened the bullion market, and supplied funds for the money market. A downside was that substantial swings in receipt levels destabilized the quantity of money and potentially the agio. A quantity stabilization policy for operations would offset this volatility.
In contrast, unsecured lending was a tool for earning interest that undermined credibility because loans could fail. The lending target was to “generate interest without running major risks” (Uittenbogaard Reference Uittenbogaard and van Nieuwkerk2009, p. 123). Profits from both receipts and loans were a goal of the Bank because collecting those profits was an evident mandate of the City. From 1736 through 1791, the Bank earned 2.8 million florins from receipts and 3.6 million from loans. The buying and selling of current guilders contributed 0.2 million, so it seems unlikely the Bank was conducting operations to as a profit driver. The City took 5 million of the Bank’s profit as seigniorage, and left no retained earnings. A rough estimate has the Bank contributing 6 percent of the City’s ordinary revenue.Footnote 11
The tension between a mandate for the public good created by successful money and a mandate for seigniorage became acute when the takings left the Bank insufficient coins to sell, especially when loans became non-performing. Recent theoretical studies (Sims Reference Sims, Sinn, Widgrén and Köthenberger2004; Del Negro and Sims Reference Del Negro and Sims2015; Benigno and Nisticò Reference Benigno and Nisticò2015) suggest that a lack of capital might have been less consequential if the Bank had enjoyed airtight fiscal guarantees from the City. In practice, however, the fiscal relationship between Bank and the City was exploitative and the extent of the Bank’s fiscal backing was ambiguous. Not until 1791 did the City inject capital into the distressed Bank, and this injection was insufficient to restore the Bank’s international reputation (Quinn and Roberds Reference Quinn and Roberds2016). Christopher Sims (Reference Sims, Sinn, Widgrén and Köthenberger2004) predicts that without clear fiscal backing, central banks in such cases will either (1) accumulate politically unsustainable levels of reserve assets, or (2) transfer such reserves to a fiscal authority and leave themselves vulnerable. By routinely taking much of the Bank’s unencumbered coin, the City chose the second option. Consistent with Sims’ prediction, the resultant vulnerability manifested in two forms.
The first occurred when trade coins became extremely popular. During the Seven Years’ War, more silver entered through receipts than the Bank could sterilize. As a result, the supply of bank florins surged, and the agio fell below target as the anchor failed. This scenario illustrated a dark side of the receipt facility: by providing cheap financing for long positions in trade coin, the Bank was also facilitating short positions in Bank money.Footnote 12 As the agio fell, the value of receipts increased (Dehing Reference Dehing2012, p. 125). Volatility of the agio also increased at this time, which would have worked to further increase receipts’ option value. Also, the bank florins could be used to purchase foreign currency forward (bills drawn on foreign markets), as a hedge against further florin depreciation. The Bank could sterilize the inflows by selling unencumbered metal, but such activity could not be sustained because of the previous decades of seigniorage. That left the Bank either to increase its policy rate to discourage receipts or to live with the other targets failing. It chose the latter.
The other type of pressure followed from an extreme unpopularity of bank money. This occurred in 1782 when the failure of the Dutch East India Company caused people to fear the Bank’s solvency. Demand for bank florins collapsed as receipts were redeemed en masse. The agio fell below target, never to recover.
NEW DATA AND EMPIRICAL ANALYSIS
For many decades the Bank of Amsterdam succeeded in supplying a popular yet profitable fiat money. The existing literature already argues for many of the elements in Table 3, so the next three sections of this article supply new data and analysis to measure these remaining claims: receipt funding was volatile; open market operations sterilized swings in receipts; a standing facility for operations was not used to stabilize the agio; and a lack of current guilders constrained stabilization operations.
Measuring the Three Tools
To measure the three monetary tools, we reconstructed each transaction that altered the amount of bank florins from January 1736 through December 1791 (Quinn and Roberds Reference Quinn and Roberds2019). Records of these transactions exist because the City of Amsterdam maintains the ledgers in its municipal archives. We begin in 1736 when the Bank simplified its internal accounting processes, and end with the last year with complete records. The Bank maintained meticulous double-entry records, so the Bank’s master account contains the relevant transactions, a total of 73,479 entries, or 1,336 transactions per year on average.Footnote 13
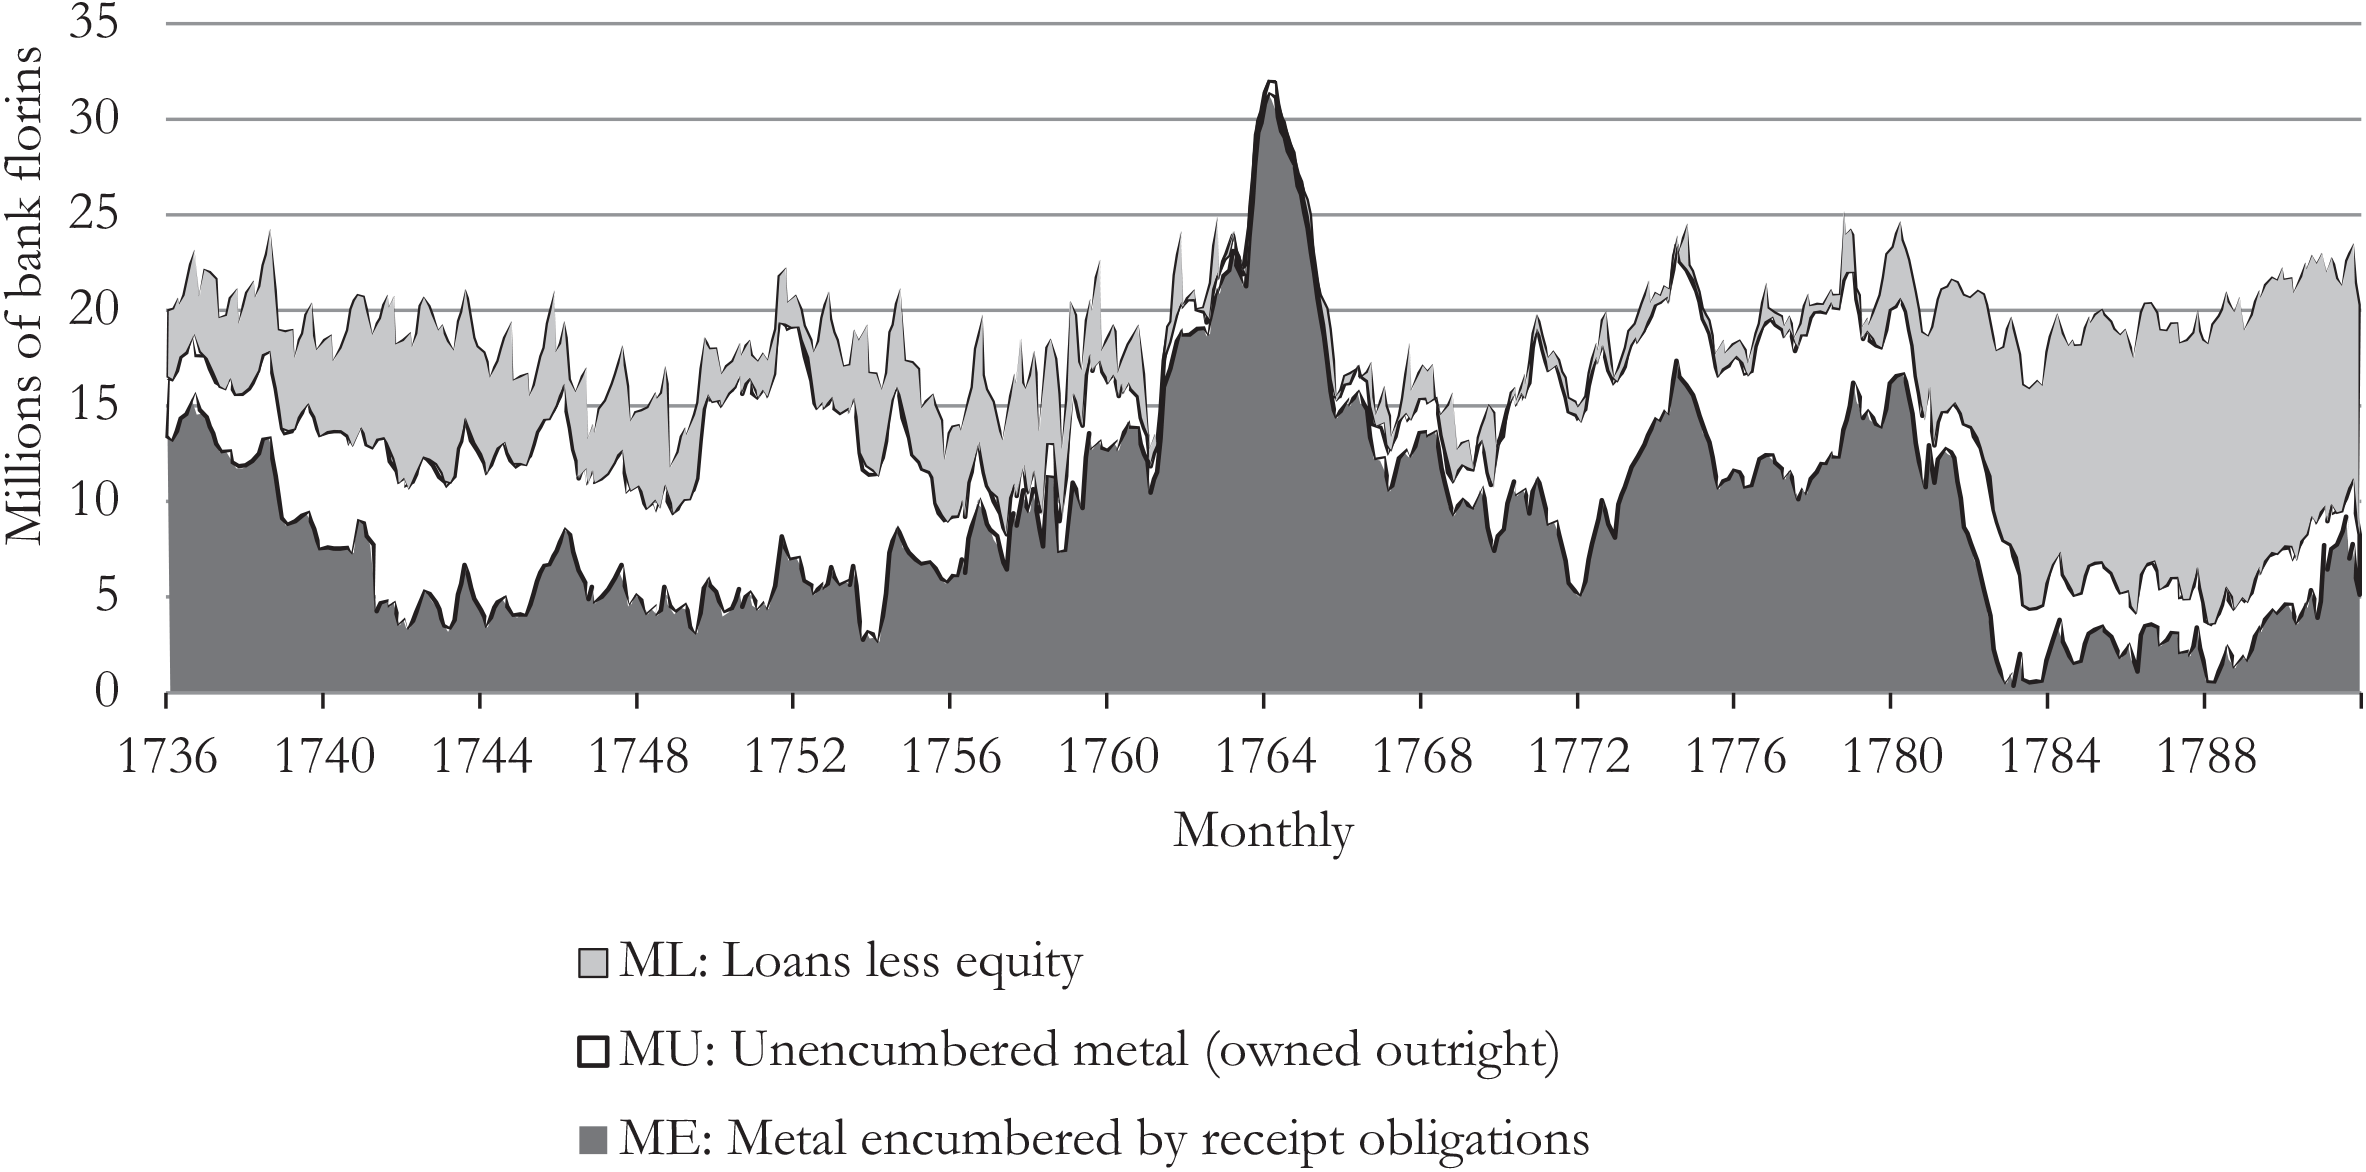
Figure 2 gives the total level of account balances for 672 months. In terms of the balance sheet (Table 1), this is the level of the Bank’s total monetary liabilities M, and that level is stable over long periods of time. The total stays between 15 and 25 million florins for 88 percent of the months. The only major deviation is the peak surrounding the crisis of 1763 (Schnabel and Shin Reference Schnabel and Shin2004). This stability is in no small part explained by active policy on the part of the Bank. To see that, Figure 2 disaggregates the monetary total into encumbered, unencumbered, and loans.
MONETARY LIABILITIES BY BACKING ASSET, 1736–1791

The Bank’s account ledgers do not detail whether a change in Bank balances stems from a receipt/redemption (a change in E), a loan/repayment (a change in L), a purchase/sale (a change in U), or an adjustment in equity (ε) such as from fees and interest payments. That information mostly resides in another set of books that records flows of metal and related fees.Footnote 14 Referring again to Bank’s balance sheet in Table 1, these “cash books” track changes in coins on the asset side of the balance sheet. Through the arduous reconciliation of the two sets, we identify an offsetting change in the balance sheet for each change in monetary liabilities.Footnote 15 Using this information, we can separate monetary liabilities M by the three other constituent parts of the balance sheet through the identity M = ME + MU + ML. The component ME is by definition equal to E, encumbered coin in the Bank’s vault. MU is equal to U, unencumbered coin owned outright by the Bank. ML is L, lending by the Bank primarily to the Dutch East India Company, less ε, the City’s various takings of Bank equity.Footnote 16
This deconstruction reveals considerable movement in the three monetary components. The most striking result is the dramatic variation in the level of money backed by coins under receipt ME. For example, the 1764 peak in total monetary liabilities of 32 million is almost completely backed by receipts. At the other extreme, ME is only 375,000 in 1783. Our period opens with receipts accounting for two-thirds of all bank florins. Eight years later, that is down to one-fifth. At its peak, receipts account for 97 percent of all bank money. At its nadir, encumbered accounts are only 2 percent.
To maintain the stability of its monetary total, the Bank adjusts. The Bank uses its own metal to change monetary levels, and these adjustments cause the level of monetary liabilities backed by unencumbered metal (MU) to range from a high of 12 million (60 percent of bank florins) in 1751 to a low of 0.6 million (2.5 percent) in 1763. Purchased metal seems to offset low receipt levels. In contrast, when receipt levels were strong, the Bank ran out of metal to sell. The Seven Years’ War appears an extreme example.
The third component is money backed by loans less equity (ML). The series exhibits strong seasonal variance, but it has more long-term stability than do the other two series. Until 1760, the Dutch East India Company routinely owes the Bank a few million bank florins in revolving credit. Then, for two decades, the Company repays most advances within a year. Starting 1780, lending to the Company and then to the City grows quickly because of the Fourth Anglo-Dutch War. This regime change coincides with a collapse in receipt funding, default by the Company, and the permanent decline of the agio (Quinn and Roberds Reference Quinn and Roberds2016).
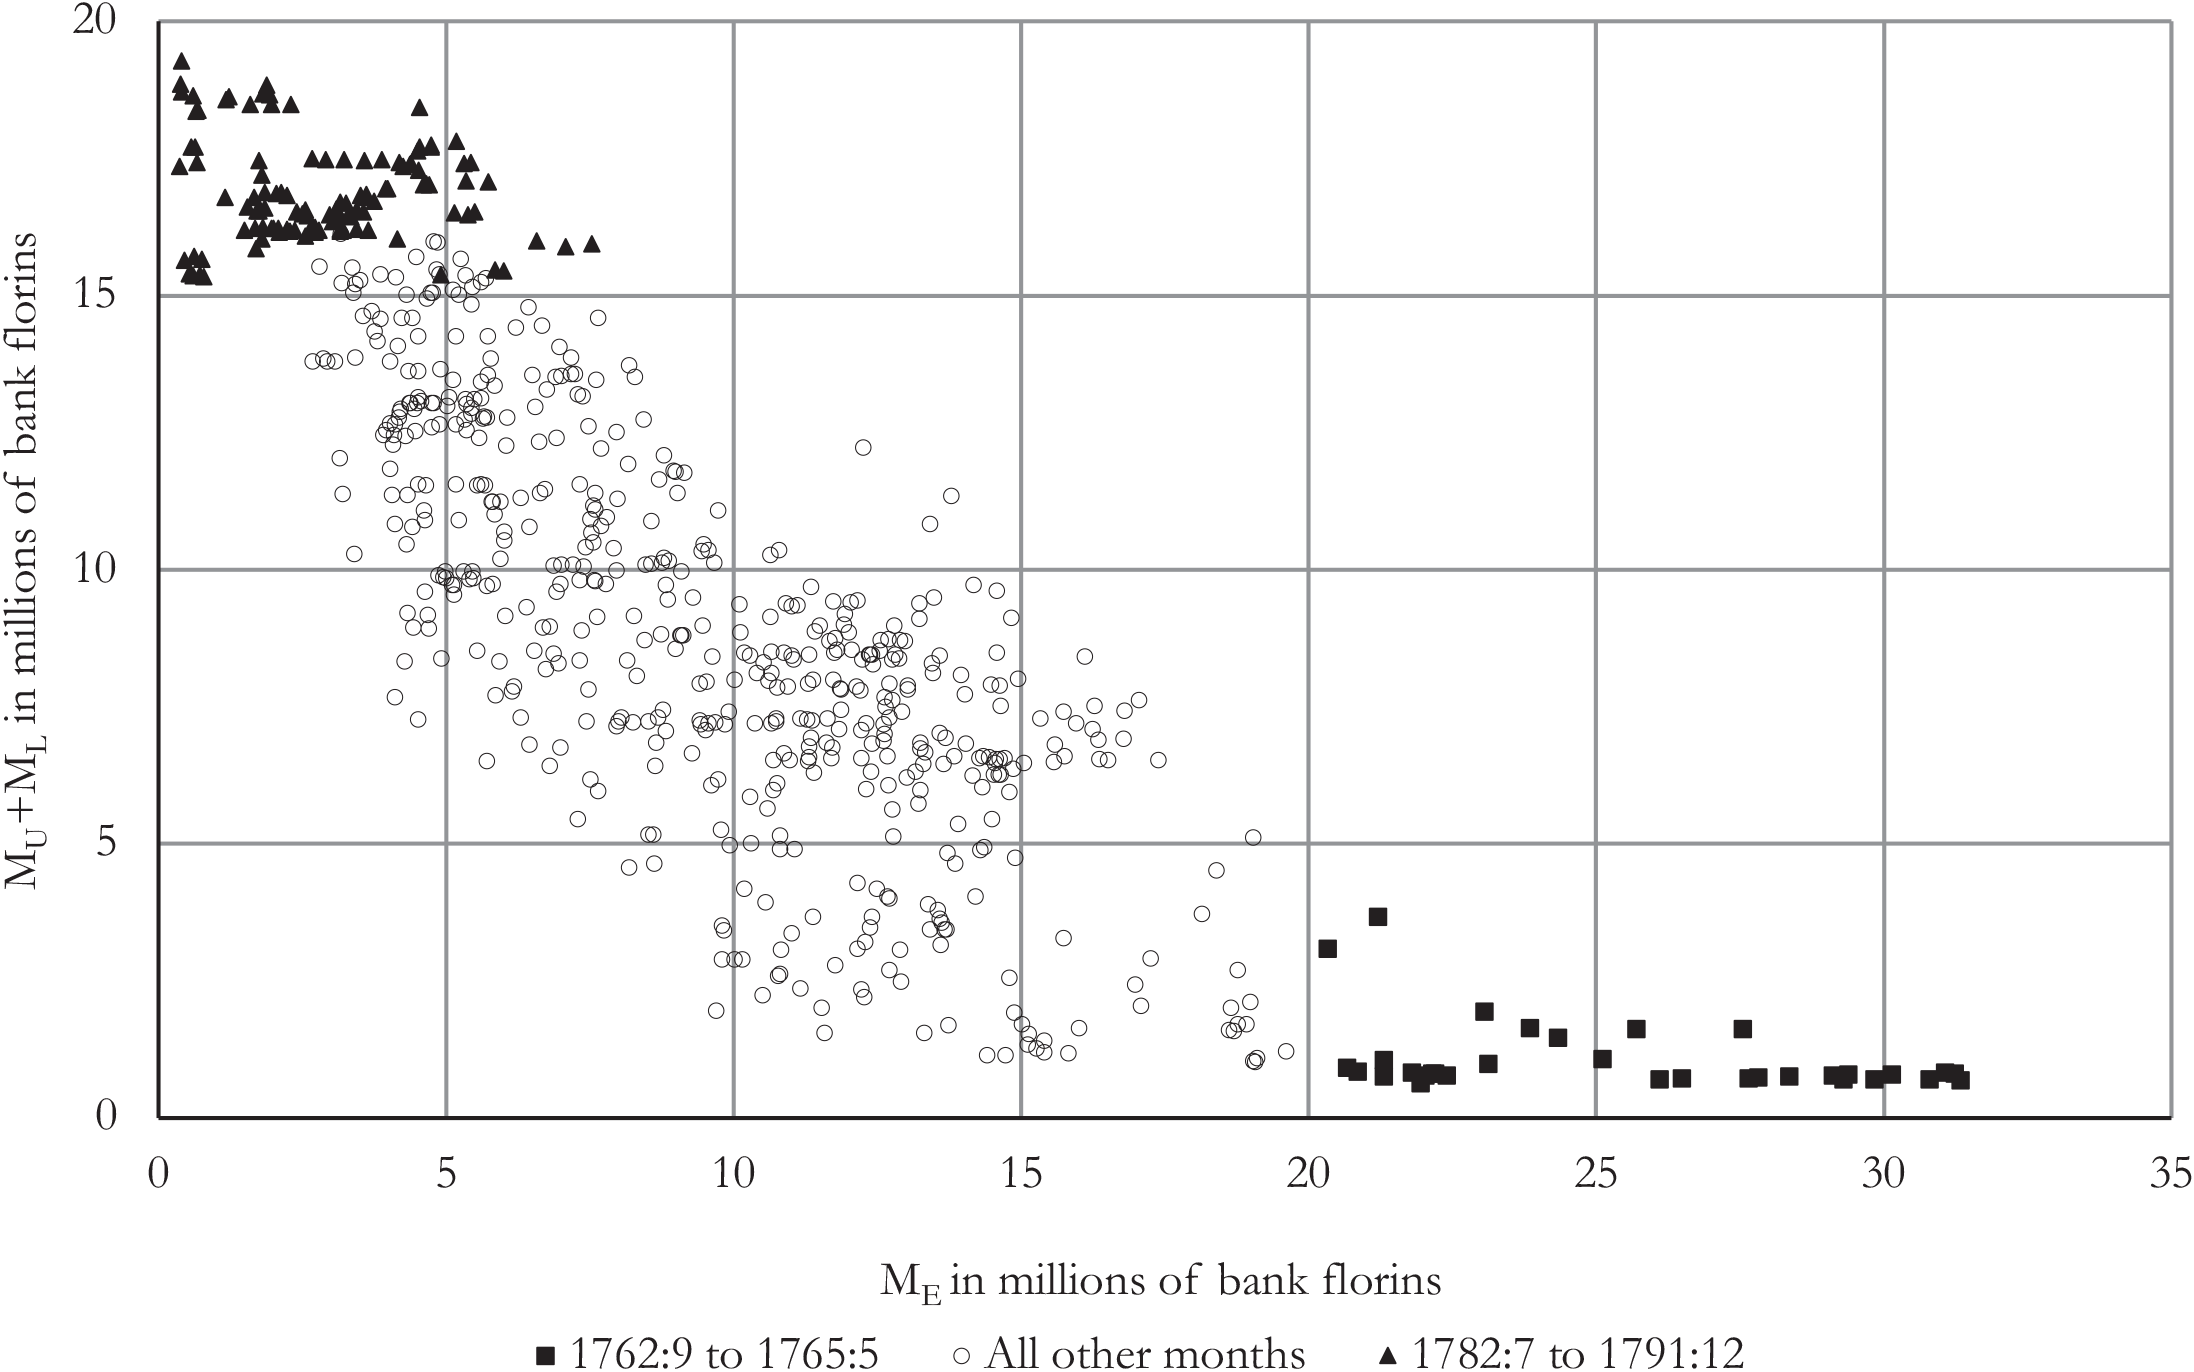
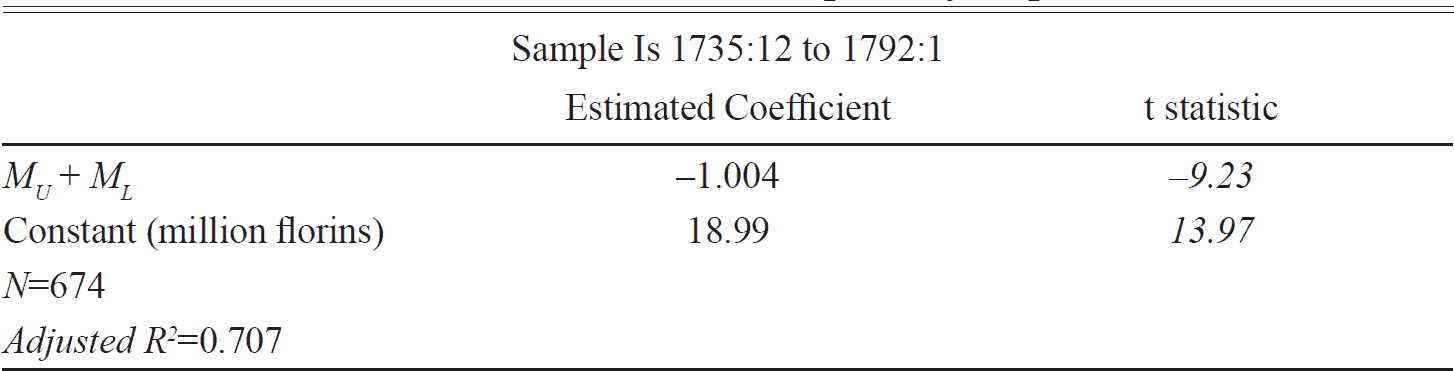
Figure 3 reorganizes the data around the level of receipts ME to emphasize findings relevant to our characterization of the Bank’s policy framework. The horizontal axis displays ME while the vertical axis measures the sum of MU and ML. The horizontal and vertical distance of each observation sums to the total amount of bank florins at that time. Figure 3 illustrates how thoroughly the Bank stabilized the total money supply. For a linear fit, a slope coefficient of negative one would mean the total money supply on average was unchanging as receipt levels varied. For the observations in Figure 3, the estimated slope for a regression of ME on (MU + ML) is −1.004. The estimated intercept also suggests a target quantity of bank florins of 19 million. Such consistency over decades of observations demonstrates impressive stabilization in the face of substantial swings in receipt volumes. The regression analysis in the next section will investigate which of these components responded to keep the total so stable.
MONETARY COMPONENTS BY MONTH, 1736–1791

The extremely high receipt observations from the end of Seven Years War (squares in Figure 3) show that stabilization of the quantity of money was secondary to accessibility. At that time, demand for receipts was booming as very large amounts of metal sought the Bank. After selling what it could (MU), the Bank let the level of bank money break pattern rather than adjust the terms of lending to discourage receipts. In terms of the framework, the goal of a maximum receipts was well satisfied even if the target of quantity stabilization was not. The same applied to the agio. At the end of the Seven Years War, the agio traded well below 4 percent, but the Bank did not respond by tightening receipt terms.
The other telling extreme is the period that we know was covered by the instruction of 1782. During the 1780s (triangles in Figure 3), the level of receipts was low and the agio was in decline (Figure 1). The Bank had more than 3 million in MU that it did not sell. Stephen Quinn and William Roberds (Reference Quinn and Roberds2016, p. 64) argued the Bank resisted because a sales operation might not have been effective. The Bank could neither compel the Company to service its loans nor compel the City to recapitalize the Bank, so loans gone bad undermined the agio more than the available quantity adjustment could correct. The more comprehensive perspective of this article suggests a simpler explanation: quantity stabilization took precedent over agio stabilization. The Bank did not sell in 1780s (triangles in Figure 3) when such action would have reduced the total stock of bank florins to the neighborhood of 13 million. Extreme periods, however, do not reveal how the Bank handled agio targeting during the decades of relative stability that comprise most of the sample.
OLS REGRESSION OF ME ON MU + ML

Note: Standard errors apply the Newey-West (1987) correction for heteroskedacity and serial correlation up to 13 months.
Sources: AMA and authors’ calculations.
Measuring Responses over Time
To see how the three components of the money supply responded to stabilize the quantity of money and how the Bank responded to the agio, we fit a VAR model to the data series. The VAR approach estimates how a movement in one variable alters the later behavior of every variable. The approach delivers a measure of response over time, and it can indicate whether an increase in the level of receipts (ME) leads the Bank to eventually sell, and whether an increase in the agio leads the Bank to eventually buy.
The estimated VAR includes five variables. These are the three components of Bank money balances: ME, ML, and MU, plus the market agio, and bill rates.Footnote 17 Bill rates represent the attractiveness of holding bank florins, and these are calculated as the projected annualized return on bills of exchange circulating between Amsterdam and London.Footnote 18 The VAR was left unconstrained and was estimated by OLS under the usual diffuse-prior interpretation of such estimates. The financial market variables (agio, bill rate) come first in the (Choleski) orderings, the intuition being that these would react quickly to changes in international conditions and market sentiment. The monetary components come second, the intuition being that these could be somewhat slower to react than market prices. Estimated impulse responses are robust to changes in orderings within the two classes of variables.Footnote 19
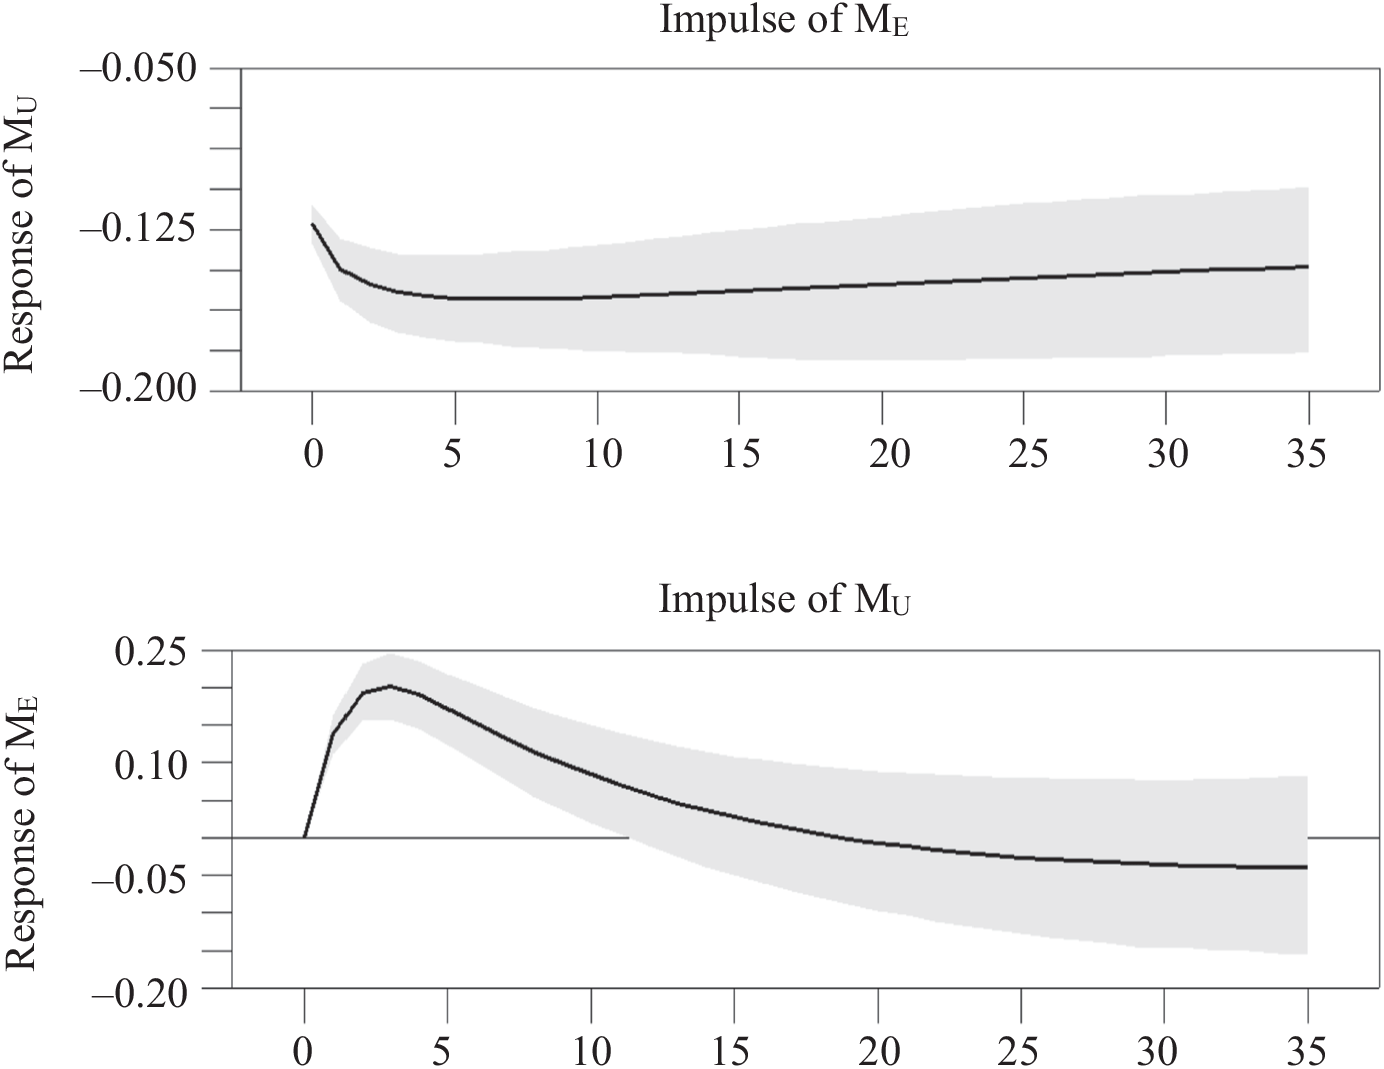
How did the Bank react to receipts? Figure 4 shows the response of Bank operations MU from a change (an impulse) in ME over time. The initial negative value means that an increase in receipts of 670,000 bank florins (one standard deviation) led to the sale of 120,000 bank florins the next month, and the persistence of the negative result means that the response endured. The result is consistent with the Bank having a policy of using operations to counter receipts. In contrast, the second part of Figure 4 shows the response of receipts to a one standard deviation operation (311,000 bank florins). The initial response was positive, but the effect dissipated. From the perspective of a year later, operations responded negatively to receipts, but receipts did not respond to operations.
RESPONSES TO MONETARY IMPULSES (By Month in Millions of Bank Florins with 70 Percent Error Bands)

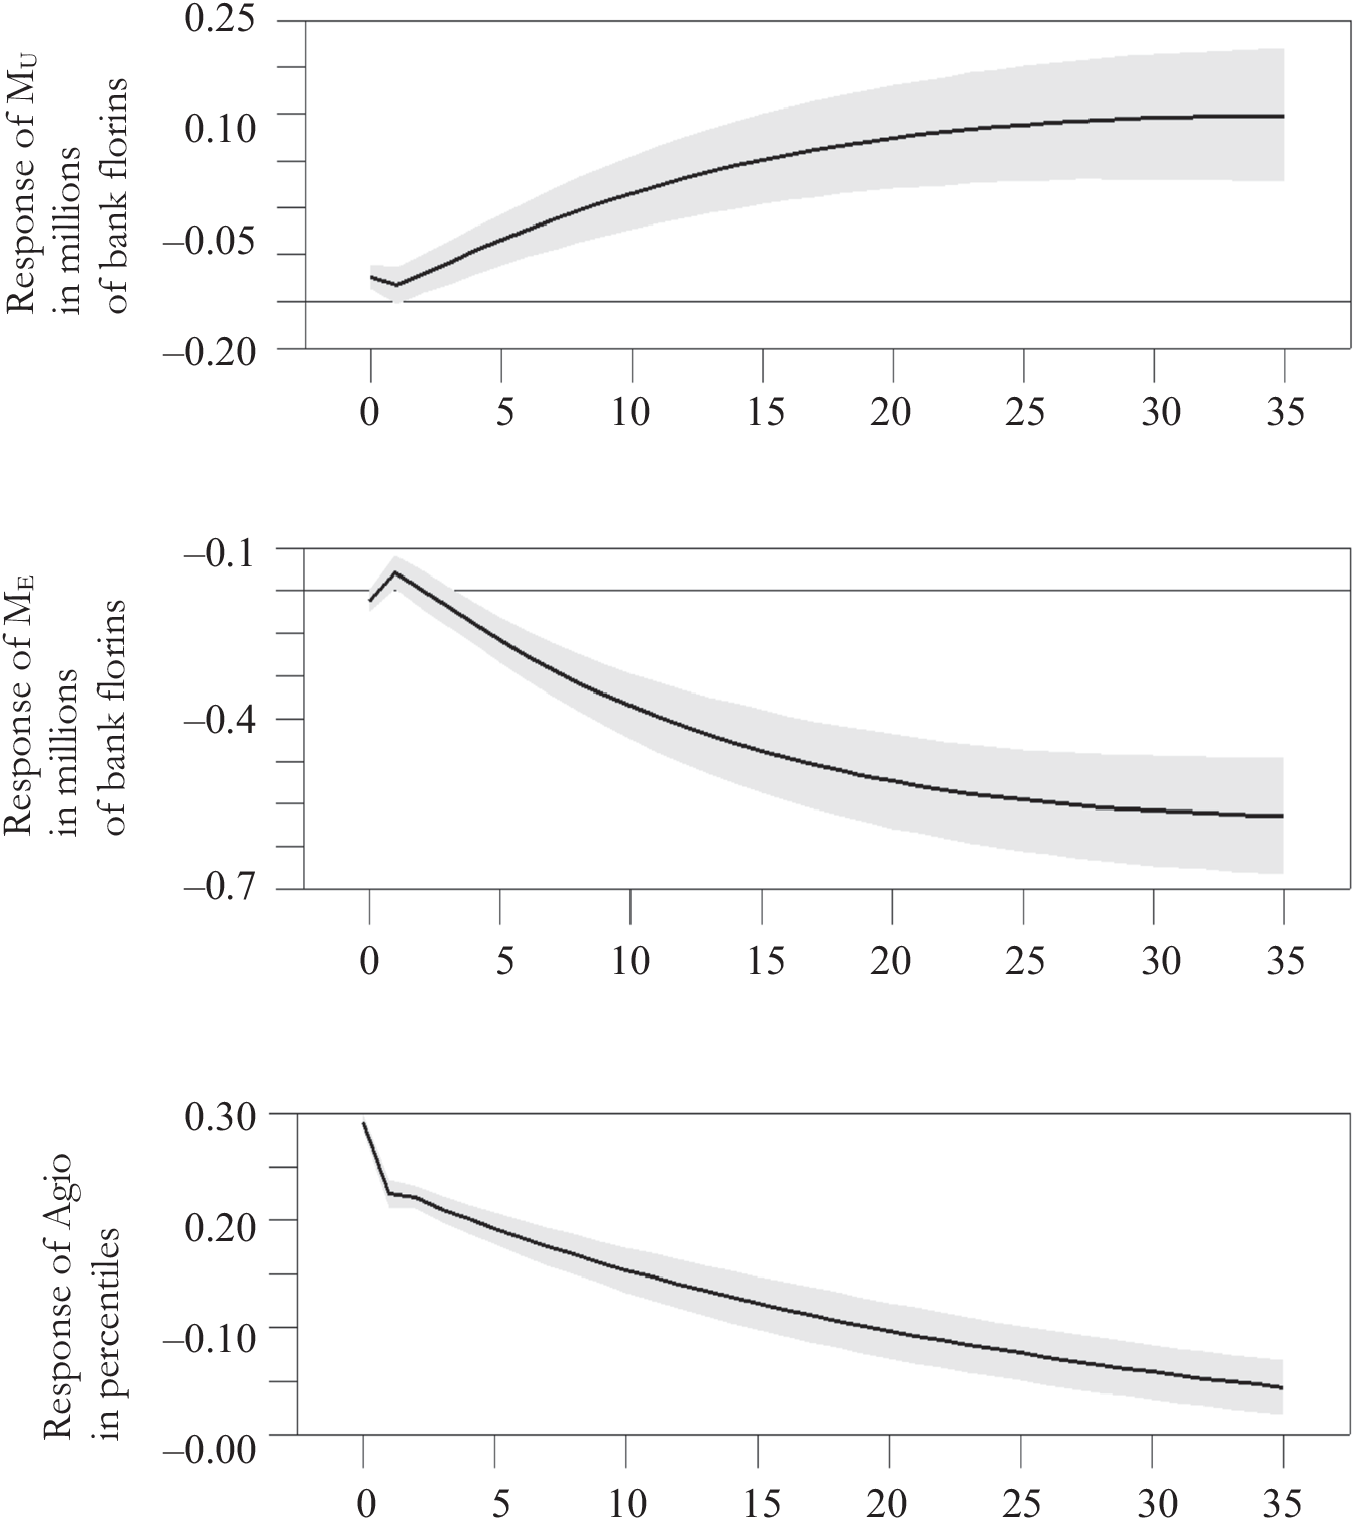
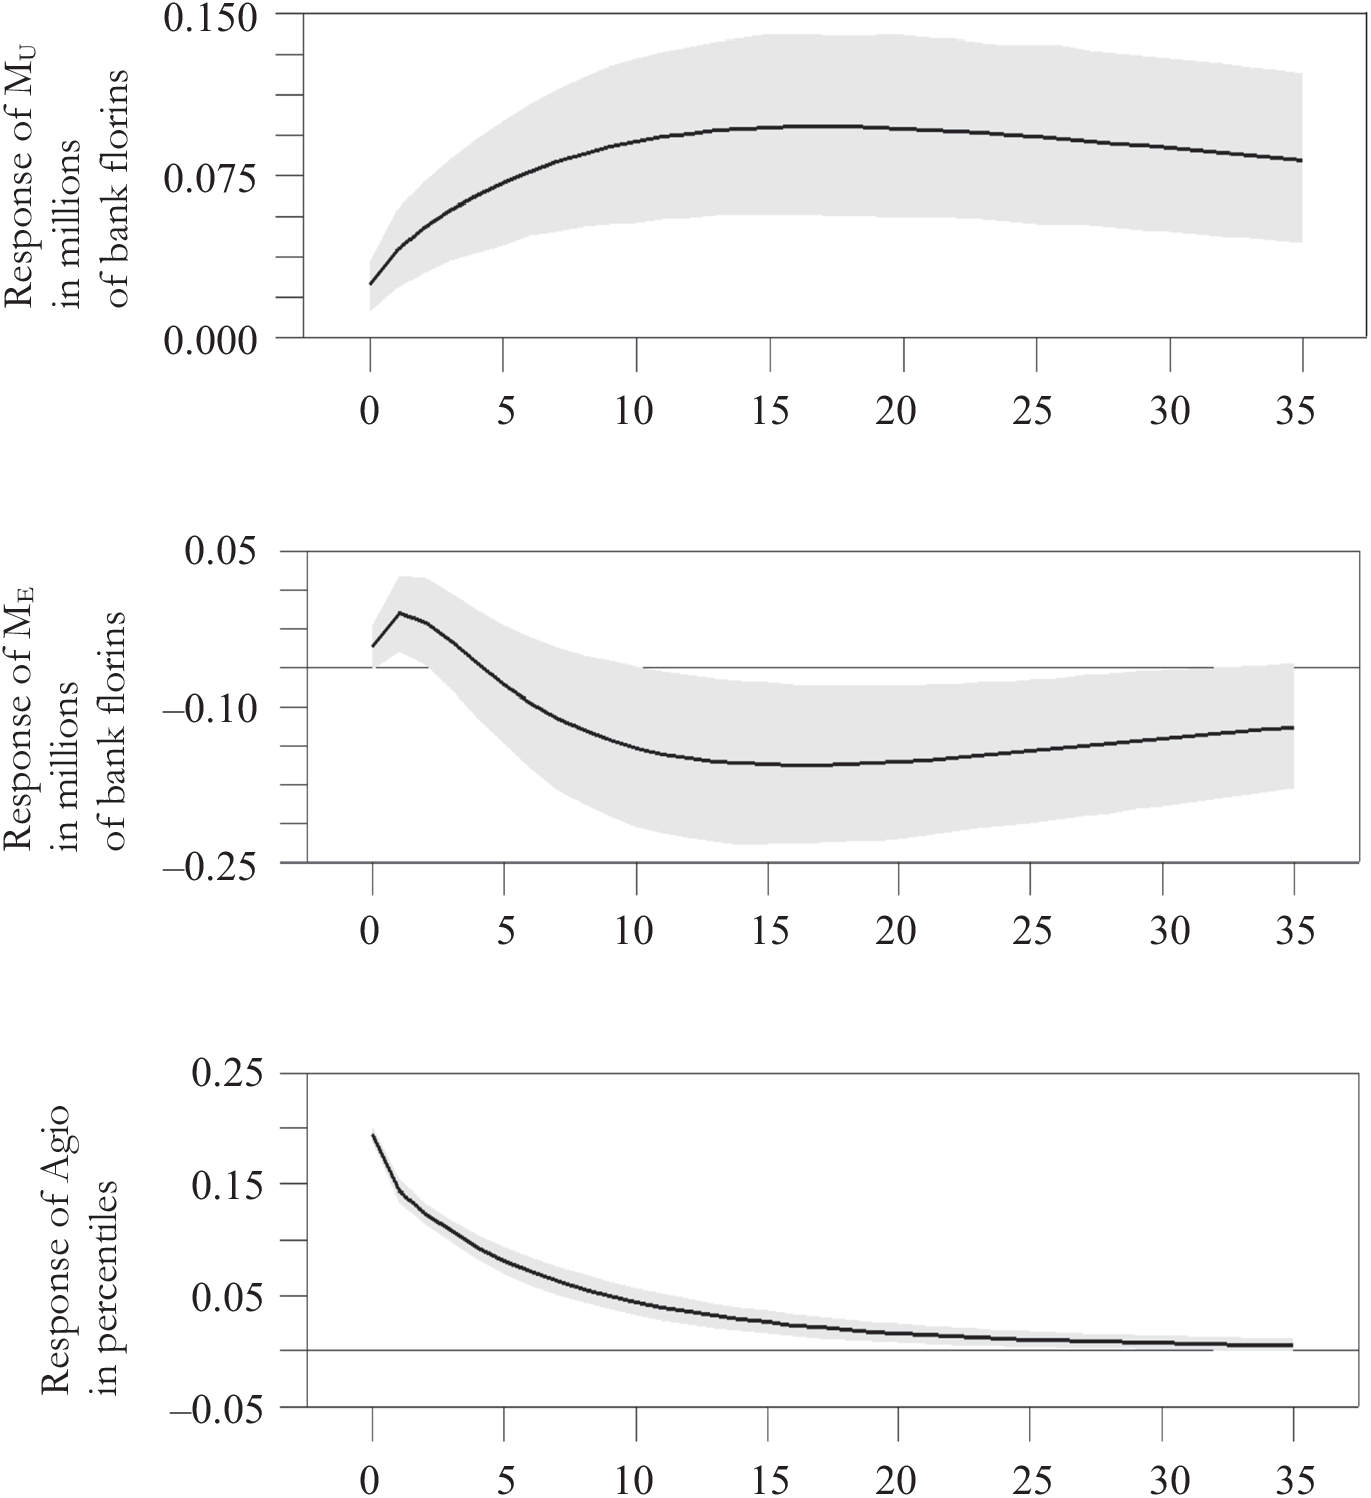
And what about the agio? Figure 5 shows that a change in the agio did encourage operations to stabilize the agio, but a jump in the agio did not send the Bank into action the next month. Instead, the Bank tended to respond if the agio persisted for a few months. That timing, however, corresponds with how receipts were negatively reacting to the agio, in the second part of Figure 5. Figure 4 already shows that operations responded to receipts and not vice-versa, so Figure 5 can be read as another version of the sterilization story. A one-standard-deviation upward shock to the agio (29 basis points) eventually induced a 400,000-florin decline in ME, which was partially offset by a 160,000 increase in MU.
RESPONSES TO AGIO IMPULSES (By Month with 70 Percent Error Bands)

The somewhat ambiguous verdict on agio stabilization might follow from the years when the agio was well below target. To ask the same question of more ordinary months, Figure 6 excludes September 1756 to October 1763 and observations after 1780. The Bank still responded to the agio with operations (first part of Figure 6), but the responsiveness of receipts to the agio is greatly diminished (second part), so the result is stronger support that the Bank was using operations in a manner consistent with agio stabilization.
RESPONSES TO AGIO IMPULSES BY “ORDINARY” MONTHS: 1736:1 TO 1756:8 AND 1763:11 TO 1780:12 (With 70 Percent Error Bands)

The VAR approach also measures whether the agio returned by itself to average levels, rather than from changes in the monetary components. The last part of Figure 5 reports the response of the agio to itself for the entire sample. The agio was auto-regressive with a half-life of 12 months. A year after a 30 basis-point jump, the agio was still 15 basis points above average. The last part of Figure 6 finds that the agio was much more auto-regressive during ordinary times. The half-life falls to three months. This reversion to average supports the contention that the agio market used expectations to auto-stabilize, especially when war was not stressing the system.
What role did loans play? The VAR results (not shown here) find that new credit led to declines in the other two series, but not vice versa.Footnote 20 That supports the conclusions that the Company was choosing borrowing levels and that the Bank countered directly, if modestly: the VAR estimates that the Bank offset about 15 percent of upward shocks to credit through unencumbered coin sales. A one-standard deviation credit shock of 320,000 florins leads to 49,000 florins in sales. The greater response, however, was through receipts, and that took months to develop. Only a persistent change in credit produced an offsetting change in receipts. Finding that customers eventually adjusted to unsecured lending confirms that tension existed between the goals of profit creation and receipt demand.
In summary, the VAR approach finds that the Bank used operations to sterilize receipts and that the agio auto-corrected, especially during ordinary periods. There is also evidence that the Bank responded to the agio with operations, but the relationship is murky because the agio also effected receipts. The VAR, however, is ill suited to test for the non-linearity of operations springing into action when the agio escaped its anchor range. To isolate the response of operations to thresholds, the next section takes a different approach.
Testing for Constraints
The previous section asks how long it took the Bank to respond. This section instead asks what environment coincided with a response. This change concedes explanatory power to gain a model better suited for the testing of non-linear constraints. For example, did the Bank respond when the agio crossed the five or four percent thresholds as suggested by the instruction of 1782? Another asymmetry to model is that the Bank can only sell if it has sufficient coin (MU), but it can always buy. Such a constraint would apply to both quantity stabilization and agio stabilization, so interacting the MU level with extreme agios can test for just the constraint applying to low agios. Table 5 summarizes the expected effect of these constraints on the probability of the Bank beginning an operation to sell or to buy.
EXPECTED SIGNS IF OPERATIONS WERE USED TO STABILIZE THE AGIO

Source: See text.
To conduct the test, we fit a discrete choice (multinomial logit) model. Each month of the sample is assigned to one of three regimes: tightening, easing, or no intervention. A model then estimates the probability of transitioning from no intervention into either tightening or easing during the following month as a function of variables observed during the current month.Footnote 21 Because these models tend to be weakly identified, only sparse specifications were estimated. Explanatory variables are the current month’s regime (a logit model is estimated for each regime), the five series from the previous section (ME, ML, MU, agio, and bill rate) and the variables in Table 5: dummy variables for a high agio and for a low agio, and two variables that interact those dummy variables with the level of coin owned outright. The purpose is to see (1) if the instruction of 1782 was followed, and (2) if a lack of coin impaired the Bank from selling when it otherwise would have.
To perform this analysis, we must define a move to tightening and to easing. As a first step, we partitioned the sample into three observable regimes, based on the sign and magnitude of the Bank’s net interventions over a given month: (1) a “draining liquidity” regime (consisting of months where the Bank substantially reduced the stock of bank money through unencumbered metal sales), (2) an “adding” regime (months with substantial net unencumbered metal purchases), and (3) a regime of “no intervention” (months with neither draining nor adding). Draining (adding) was defined as a monthly rate of open market sales (purchases) in excess of 25,000 florins. The 25,000-florin filter was chosen so as to screen out months where only maintenance-type open market transactions occur, the idea being that larger operations were more likely to result from purposeful policy interventions. The sample Markov transition matrix for the three regimes (draining, adding, no intervention) is given by
 $$\pi = \left[ {\matrix{
{.525} & {.0667} & {.408} \cr
{.057} & {.631} & {.312} \cr
{.119} & {.107} & {.774} \cr
} } \right],$$
where π(i,j) gives the probability of transition from regime i to regime j. The corresponding steady-state distribution over regimes is (.179, .210, .611). In words, the Bank intervened heavily during about 40 percent of our sample (261 out of 672 months), with interventions roughly evenly split between sales and purchases. Regimes were moderately persistent, and it was rare for the Bank to go directly from adding to draining liquidity, or vice versa.
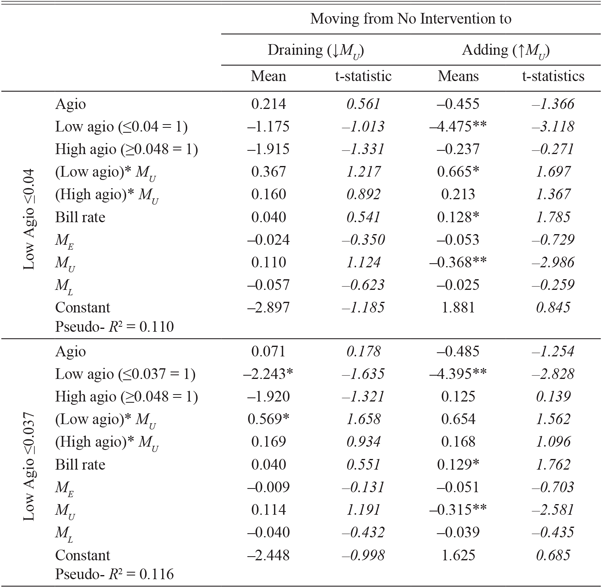
The first result was that a “high” agio of 5 percent or more lacked sufficient observations for meaningful estimation. This is strong evidence that the market discipline rather than the Bank operations kept the agio below this upper threshold. To achieve identification, the model reported in Table 6 instead uses a “high” agio of 4.8 percent, which is the 75th percentile of the agios in our sample. The first version uses a “low” agio of 4 percent as per the instruction of 1782. The second version defines a low agio of 3.7 percent (25th percentile). This mirrors the definition of the high agio (75th percentile) and creates a low agio with timing nearly equivalent to the Seven Years War and the post-1782 eras (see Figure 1). The second version’s low agio corresponds with the two extraordinary periods when the agio anchor failed.
MULTINOMIAL LOGIT MODELS OF TRANSITION PROBABILITIES: POSTERIOR MEANS AND “T-STATISTICS” OF COEFFICIENTS

* = 90 percent credible interval (“Bayesian confidence interval”) for that coefficient not containing zero.
** = 95 percent credible interval (“Bayesian confidence interval”) for that coefficient not containing zero.
Notes: Estimates in the table were calculated with the BRMS package in the R programing language using diffuse priors. Each estimate uses 20,000 draws, sampling every tenth draw. T-statistics are posterior means divided by posterior standard deviations.
Sources: AMA and authors’ calculations.
Table 6 gives results for moving from no intervention to either draining or adding. The results do not support the contention that the Bank mechanically followed a threshold-style policy as described in Table 5. The agio by itself has the wrong sign on transitions to sales (0.214) and to purchases (−0.455). A low agio does not have a positive coefficient on selling (−1.175), and a high agio does not have a positive one on buying (−0.237). An agio story that does emerge has the Bank not buying when the agio is low (−4.475**) and not selling when high (−1.915), but avoidance of unprofitable and destabilizing operations is not the active implementation suggested by the instruction of 1782. The second version of the model, which further restricts a low agio, does not change these results (see the table’s lower panel).
Although the Bank did not start selling just because the agio was low, it did tilt towards a response if the stock of owned metal was substantial enough (0.367). The coefficient suggests that it took 3.2 million bank florins in owned metal (MU) to offset a low agio (0.367*3.2 = 1.175). The average stock of owned metal over our sample is 4.9 million with a standard deviation of 2.8 million, so it took a substantial amount to tip the Bank towards responding to a low agio with a sales operation. This coefficient grows larger and slips into statistical significance (0.569*) in the second model.
In summary, the Bank was not initiating operations in response to the agio crossing upper or lower thresholds. Instead, high agios corrected themselves, and low agios recommended sales over purchases only when the Bank owned plenty of metal. The focus on levels of owned metal also expressed as a powerful urge to purchase as the level of MU fell (−0.368**). The combination of drainages from seigniorage, quantity stabilization, and the difficulties of bolstering low agios made rebuilding unencumbered assets a priority.
CONCLUSION
Receipts were the essential tool of the Bank’s success in a commodity money world. Easy and reliable access to receipt loans encouraged use of trade coins as collateral, thereby increasing the demand for Bank money and deepening the capacity of Amsterdam’s financial markets. Receipts also generated profits that supplied the City with seigniorage. It was, however, no simple matter to sustain a low interest rate regime because the success of bank money also depended on its relationship with the coins of the domestic Dutch economy. Contemporaries and the subsequent literature have thought the Bank kept this relationship stable by mechanically buying and selling current money, but this article shows that was not so. Instead, the Bank used open market operations to off-set the disruptive volatility of receipts levels. The policy suggests a Bank more concerned with keeping the agio within its target range through reinforcement of stabilizing expectations than with pushing a wayward agio back into its target range.
In normal times, the framework worked well to deliver both a flourishing bank florin and seigniorage. In extraordinary times, however, the framework contorted. An insufficient stock of current money meant the Bank could not sterilize a surge in receipts. It also meant that an excessive amount of bad loans could prevent the Bank from restoring the credibility of its receipts. The theoretical literature predicts that such conditions can give rise to intense speculative pressures, and the data in our sample are consistent with this prediction.
A low interest rate policy was thus both a foundation of the Bank’s policy framework and a contributor to its demise. Cheap access to credit made the Bank’s lending facility popular and promoted agio stability over long periods, yet this same popularity could also undermine stability. Large-scale open market sales were the Bank’s primary tool available to address problems with its lending facility, but seigniorage payments to the City meant the Bank did not maintain a sufficient precautionary stock of assets. In the end, the Bank failed because it did not anticipate the extent of tightening necessary to support the credibility of its policy framework. That experience may offer a useful lesson for present-day central banks.