I. INTRODUCTION
Uranium is used in many fields owing to its high-density and nuclear properties. But uranium is easily corroded because of the high reactivity of the metal. It is well known that the performance of uranium materials can be improved when other elemental metals, such as Zr, Nb, Ti, and Mo, are added. Adding Nb can enhance the corrosion resistance of uranium metal. Rich uranium alloys are considered as potential nuclear fuels owing to their higher density and fast heat transfer (Lopes et al., Reference Lopes, Restivo and Padilh2013; McKeown et al., Reference McKeown, Hsiung, Ryu, Park, Turchi and King2014). Therefore, the properties of uranium alloys should be investigated clearly before using as nuclear fuel.
When the content of Nb is between 4.2 and 6.9 wt%, the martensitic structure α″ phase can be formed through rapid quenching (>20 °C/s), which has excellent corrosion resistance and special mechanical properties (Eckelmeyer et al., Reference Eckelmeyer, Romig and Weirick1984; Field et al., Reference Field, Thoma, Dunn, Brown and Cady2001), such as low yield strength, high ductility and toughness, and shape memory effect (SME) (Eckelmeyer et al., Reference Eckelmeyer, Romig and Weirick1984; Brown et al., Reference Brown, Bourke, Dunn, Field, Stout and Thoma2001, Reference Brown, Bourke, Field, Hults, Teter, Thoma and Vogel2006; Field et al., Reference Field, Thoma, Dunn, Brown and Cady2001, Reference Field, Brown and Thoma2005; Clarke et al., Reference Clarke, Field, McCabe, Cady, Hackenberg and Thoma2008, Reference Clarke, Field, Dickerson, McCabe, Swadener, Hackenberg and Thoma2009; Kelly et al., Reference Kelly, Field and Thoma2012). The α″-UNb alloy can be strengthened remarkably through aging at moderate temperatures (<250 °C), while the ductility only decreases slightly. Consequently, the distinctive mechanical properties and the effect of aging are the most interesting for α″-UNb alloy.
It is important to understand the crystallographic relationship and reorientation system of shape memory alloys (SMAs) during deformation and/or phase transformation. X-ray diffraction (XRD) and neutron diffraction (ND) are both used to investigate the reorientation of uranium-rich U–Nb alloys during tensile or compressive testing (Carpenter, Reference Carpenter1985; Brown et al., Reference Brown, Bourke, Dunn, Field, Stout and Thoma2001, Reference Brown, Bourke, Field, Hults, Teter, Thoma and Vogel2006; Tupper et al., Reference Tupper, Brown, Field, Sisneros and Clausen2012; Zhang et al., Reference Zhang, Wang, Xu and Li2015b). Although X-rays penetrate only a few microns into uranium material, the previous works have confirmed that XRD can accurately characterize the deformation properties of the U–Nb alloy and are in good agreement with the results of ND (Zhang et al., Reference Zhang, Wang, Chen and Xiao2015a, Reference Zhang, Wang, Xu and Li2015b). The previous reports also indicate that XRD is a useful method to study the deformation and SME of U–Nb alloys (Vandermeer et al., Reference Vandermeer, Ogle and Northcutt1981; Carpenter and Vandermeer, Reference Carpenter and Vandermeer1983; Carpenter, Reference Carpenter1985). Furthermore, the evolution of microstructure, such as phase structure, lattice parameters, and plane orientation, can also be investigated using in situ XRD during tensile and compressive tests to understand the mechanism of deformation (Wang et al., Reference Wang, Lou, Ståhl, Bednarcik, Franz and Jiang2010; Xu et al., Reference Xu, Zhang, Cheng and Song2012; Dubinskiy et al., Reference Dubinskiy, Prokoshkin, Brailovski, Inaekyan and Korotitskiy2014).
The α″ and γ° phases of uranium-rich U–Nb alloys both exhibit SME (Vandermeer et al., Reference Vandermeer, Ogle and Snyder1978; Vandermeer, Reference Vandermeer1980; Vandermeer et al., Reference Vandermeer, Ogle and Northcutt1981; Brown et al., Reference Brown, Bourke, Field, Hults, Teter, Thoma and Vogel2006; Clarke et al., Reference Clarke, Field, McCabe, Cady, Hackenberg and Thoma2008), which enables alloy to recover from plastic deformation through a subsequent heating treatment. The phase transformation between α″ and γ° is induced easily by ambient temperature and applied stress. Therefore, the crystallography relationship between α″ and γ° was investigated to understand the mechanism of transformation and deformation (Carpenter, Reference Carpenter1985; Field et al., Reference Field, Thoma, Dunn, Brown and Cady2001; Sagaradze et al., Reference Sagaradze, Zuev, Bondarchuk, Svyatov, Shestakov, Pecherkina, Kabanova and Klyukin2013; Zhang et al., Reference Zhang, Wang, Xu and Li2015b). Previous works indicate that the
 $(1\bar 30)$
, (021), and
 $(\bar 172)$
planes are all deformation twinning systems (Field et al., Reference Field, Thoma, Dunn, Brown and Cady2001; Sagaradze et al., Reference Sagaradze, Zuev, Bondarchuk, Svyatov, Shestakov, Pecherkina, Kabanova and Klyukin2013). However, the twinning system was studied most by calculation and ex situ TEM (transmission electron microscopy). Therefore, it is necessary to perform an in situ investigation to understand the mechanism of deformation further.
The work described in the present study investigates the crystal lattice evolution of the aged U–6.2Nb alloy during cyclic tensile loading and unloading using an ancillary tensile device and in situ XRD. The processes of phase transformation and twin reorientation are observed in situ, and the mechanisms of deformation and SME are discussed.
II. EXPERIMENTAL
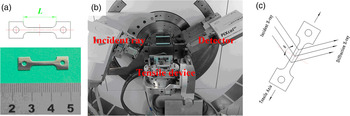
The depleted uranium (238U) alloys used in these experiments were arc-melted by a consumable electrode, where the Nb content was 6.2 weight % nominally. The ingot was heat-treated at 1100 °C for homogeneity, then was kept at 800 °C for 2 h and water quenched (Brown et al., Reference Brown, Bourke, Dunn, Field, Stout and Thoma2001; Hsiung, Reference Hsiung2005). The sample was prepared by electro-discharge machining for tensile deformation and in situ XRD. Figure 1(a) shows the shape and dimension of tensile sample. The tensile device and diffractometer are also showed in Figure 1(b). Figure 1(c) shows the schematic of the diffractometer/sample geometry. The plane normal of diffracting crystallites are parallel to the sample surface normal direction, which means the diffraction vector is perpendicular to the applied load. Sample aging was performed in mineral oil thermostat at 200 °C for about 500 min to produce γ° in the as-quenched U–6.2Nb alloy.
(Color online) (a) The shape and dimensions of U–6.2Nb alloy sample; (b) the tensile device and diffractometer; and (c) the diffraction geometry of sample and detector.

The X-ray penetration depth for CuK α radiation is about 1 µm in U–Nb alloy, and the surface structure of α″ U–Nb alloy is sensitive to stress. Therefore, surface preparation was an important consideration before analysis, which was optimized prior to XRD data collection. The sample was mechanically polished to a 1 µm diamond grit finish, and followed with electropolishing in 5% phosphoric acid. The thickness of the entire sample was reduced about 50% after polishing of both sides, which reduced the thickness from 1 mm to ~0.5 mm. More details of sample's surface preparation are given in reference (Zhang et al., Reference Zhang, Wang, Xu and Li2015b).
A PANalytical Empyrean Advance X-ray diffractometer was used in Bragg–Brentano geometry, and equipped with PIXcel3D detector and with CuKα radiation (generator settings were 40 kV and 40 mA). The maximum scan range of 2θ is 30°−90°, or 32°–42° in detail. The quasi-static tensile test was carried out using a tensile device fixed on the sample station. The sample was fixed on the tensile device, and the X-ray beam irradiated the center zone of the sample during tensile testing. The deformation was kept constant during the XRD measurement. Annealing of sample was done after unloading so as to recover the macroscopic deformation. The annealing was performed in mineral oil at 200 °C for approximately 3 min. The tensile process was controlled by computer, and the rate of deformation was about 1.6 × 10⁻⁴ s−1.
III. RESULTS AND DISCUSSION
A. Phase structure and transformation
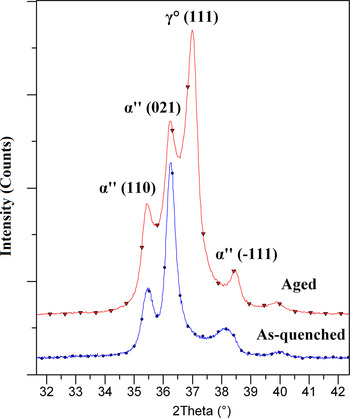
Figure 2 shows the XRD data of the as-quenched and aged U–6.2Nb alloys, respectively. The α″ structure is the sole phase in as-quenched sample, a distorted version of α-U. The γ° phase will form during aging at 200 °C (Zhang et al., Reference Zhang, Wang, Xu and Li2015b), which is a primitive tetragonal structure, a distorted version of γ-U. Consequently, the aged U–6.2Nb alloy contains both α″ and γ° phases. To compare with previous works (Brown et al., Reference Brown, Bourke, Dunn, Field, Stout and Thoma2001; Field et al., Reference Field, Thoma, Dunn, Brown and Cady2001; Tupper et al., Reference Tupper, Brown, Field, Sisneros and Clausen2012), the space group Cmcm of orthorhombic α-U was used to index the lattice plane of the α″ phase. The diffraction peak intensities are very weak at high 2θ angle. For this reason, the diffraction peaks between 32° and 42° 2θ are analyzed primarily in this work.
(Color online) XRD patterns of as-quenched (lower) and aged (upper) U–6.2Nb alloys.

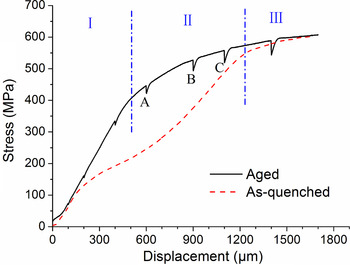
The yield strength of the α″ U–Nb alloy increases with aging time at 200 °C (Volz et al., Reference Volz, Hackenberg, Kelly, Hults, Lawson, Field, Teter and Thoma2007). The tensile test shows that the yield strength is about 140 MPa for the as-quenched sample, and increases to about 440 MPa for the aged sample. The stress-displacement curve of as-quenched sample includes elastic deformation, twinning deformation, and permanent plastic deformation. The twinning deformation, also called as pseudoelastic deformation, can be divided into a low-stress deformation stage and a work-hardening stage (Field et al., Reference Field, Thoma, Dunn, Brown and Cady2001). However, the two stages of twinning deformation are undistinguishable in the aged sample, and marked as stage II (yield flat) in Figure 3. The displacements of 600, 900, and 1100 µm, marked as A, B, and C respectively in Figure 3, were selected to investigate the deformation and shape recovery of aged U–6.2Nb alloy in detail.
(Color online) The stress–displacement curves of as-quenched and aged samples. The curve of aged sample is divided into three stages. The XRD data are collected when tensile displacement reaches at A, B, and C, as discussed in the text.

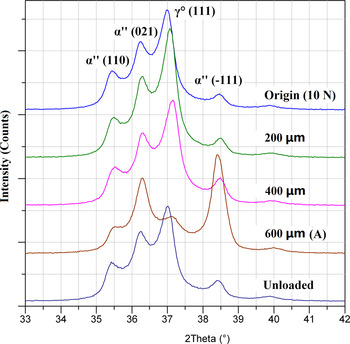
Figure 4 shows the change in the XRD pattern during tension up to A and unloaded. The load under origin (defined as undeformed) and unloaded condition are both equal to ~10 N (~12 Mpa) in this paper. The intensities and number of diffraction peaks have no change during elastic deformation, with the exception of slight lattice parameter shifts because of the applied stress. However, the diffraction peak intensity of γ° (111) decreases dramatically when elongation reaches to A, coincident with significant increase in intensity of α″ (−111). The remarkable peak intensity changes of the γ° (111) and α″ (−111) provide insight into the crystallographic mechanism for stress-induced phase transformation between γ° and α″ (Zhang et al., Reference Zhang, Wang, Xu and Li2015b). It should be noticed that the intensities and shapes of diffraction peaks recover completely after unloading. This indicates that the reverse phase transformation from martensitic phase α″ back to austenitic phase γ° takes place for the unloaded sample. The low-stress plateau of α″ U–Nb alloy is usually attributed to twin deformation. This plateau almost disappears in the aged samples, and the deformation is replaced by phase transformation. The recovery is confirmed by the macroscopic dimension measurement of the sample.
(Color online) XRD patterns of aged U–6.2Nb alloy during tension to A and unloading.

B. Lattice response and SME
Repeat load–unload cycles were done to investigate the lattice response and SME of the aged U–6.2Nb alloy in this work. The maximum deformation is defined as A, B, and C (Figure 3) during load–unload cycles, respectively. The experiment results reveal that the deformation and SME are dominated by phase transformation or twin reorientation during tensile cycling. The mechanism of deformation in each stage is different.
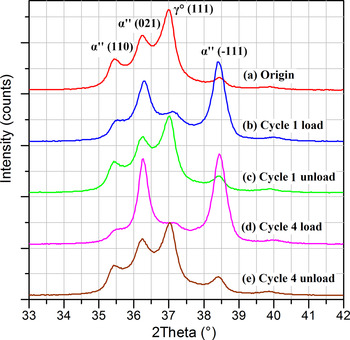
Figure 5 shows the in situ XRD patterns of the aged U–6.2Nb alloy during load–unload cycling for maximum deformation A. In consideration of all cycles 1–4 looking essentially the same, there are just cycles 1 and 4 drawn in Figure 5. It can be seen that the intensities and positions of diffraction peaks remain constant even through several load–unload cycles. That is to say the structure can be recovered entirely when applied stress is removed. On the other hand, the results suggest that phase transformation initiation occurs easier than twinning with the increase of stress during tensile testing.
(Color online) XRD patterns of loaded and unloaded samples during repeat load–unload cycles under A in aged U–6.2Nb alloy.

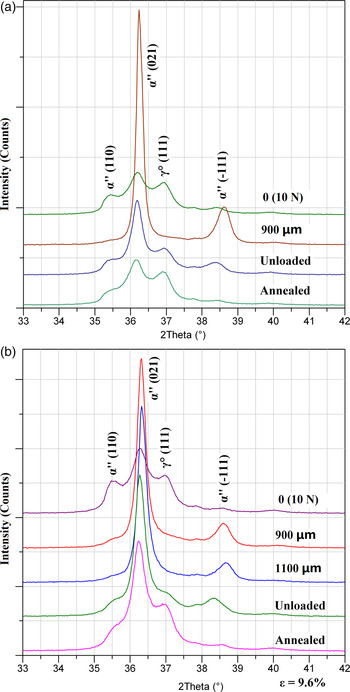
The differences are obvious in the XRD patterns between the loaded, unloaded, and annealed samples when the maximum deformation reaches B or C (Figure 6). The γ° (111) and α″ (110) diffraction peaks nearly disappear. At the same time, the intensities of α″ (−111) and (021) peaks increase dramatically. The enhancement of (021) diffraction peak intensity suggests that the deformation changes from phase transformation to twinning deformation. The diffraction peak intensities recover partly after applied stress unloading. The recovery can increase further after annealing. Compare with deformation B, the recovery of deformation C is less. This suggests that the recovery ability is weaker when tensile deformation increases form B to C. It is possible that part of deformation goes beyond the region of twinning, and consequently the recovery ability decreases with the increasing of deformation. It is very interesting that the γ° (111) and α″ (−111) peaks can almost recover completely after unloading or annealing, even when the displacement exceeds C.
(Color online) XRD patterns of loaded, unloaded, and annealed samples for (a) deformation B and (b) C in aged U–6.2Nb alloy.

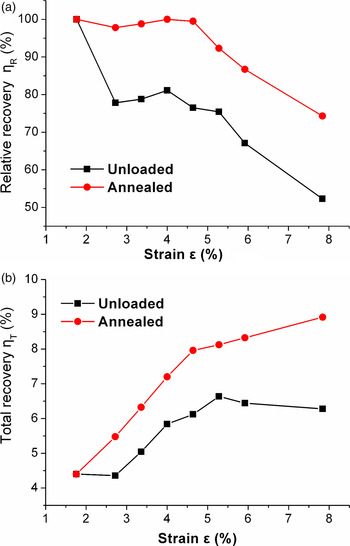
The macroscopic recovery was calculated by measuring the dimension change between the origin sample, unloaded sample, and annealed sample. The recovery mentioned in this paper is divided into two stages: unloaded and annealed. Figure 7 shows the results of relative recovery η R and total recovery η T, which are respectively defined as
 $$\eta _{\rm R} = \displaystyle{R \over D} \times 100\% $$
and
 $$\eta _{\rm T} = \displaystyle{R \over L} \times 100\%, $$
where D (unit μm) is the crosshead displacement for the deformation, and R is the crosshead reverse displacement after unloading or annealing. L is the original length of sample. It is can be seen that the differences of relative recovery η R [Figure 7(a)] between the unloaded and annealed samples are about 20% except for strain A, which means the η R can increase 20% after heating (annealing) for the unloaded sample. The tensile deformations can recover almost completely after annealing until the strain exceeds the second yield (~1100 µm). The total recovery of the annealed sample [see Figure 7(b)] increases with strain, even after the strain exceeds the second yield, which we can assign as -slip deformation. The results suggest that there may still be present a portion of twinning deformation even after the second yield.
(Color online) The relative recovery (a) and total recovery (b) of unloaded and annealed samples.

C. Discussion
The deformation and recovery mechanisms are different between the varied stages of the aged U–6.2Nb alloy. In the earlier yield flat, the microstructure change is dominated by the phase transformation between γ° and α″, which has been illuminated by the atomic stacking conversion between γ° (111) plane and α″ (−111) plane (Zhang et al., Reference Zhang, Wang, Xu and Li2015b). In the later yield flat, the microstructure changes come from two parts – phase transformation and twinning deformation. The results of in situ XRD reveal that the phase transformation, induced by shear stress, is easier than twinning deformation during tensile testing, and the reorientation of α″ (021) plane plays an important role during twinning deformation.
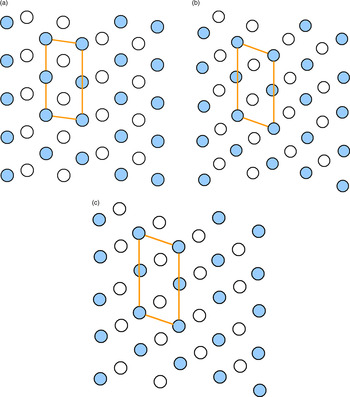
Compared to α″ (−111) plane, the interplanar spacing of the α″ (021) plane is much closer to that of the γ° (111) plane. However, the experimental results indicate that the γ° (111) plane transforms to the α″ (−111) plane, not to the α″ (021) plane during tensile testing. The distribution of plane atoms reveals that there are more similarities between the γ° (111) and α″ (−111) planes. Figure 8 illustrates the atomic distribution of these lattice planes. A parallelogram unit is drawn in each lattice plane, which is defined to compare the differences of atomic stacking between α″ (021), γ° (111), and α″ (−111) planes. The length and angle of the parallelogram are both closer between α″ (−111) and γ° (111), and are visibly difference from the α″ (021). Therefore, the transformation of γ° (111) prefers α″ (−111) to α″ (021) during tensile deformation (Carpenter and Vandermeer, Reference Carpenter and Vandermeer1982, Reference Carpenter and Vandermeer1983; Brown et al., Reference Brown, Bourke, Field, Hults, Teter, Thoma and Vogel2006; Zhang et al., Reference Zhang, Wang, Xu and Li2015b). Similarly, the α″ (−111) plane reverses transformation to the γ° (111) plane during aging (Carpenter and Vandermeer, Reference Carpenter and Vandermeer1982, Reference Carpenter and Vandermeer1983; Brown et al., Reference Brown, Bourke, Field, Hults, Teter, Thoma and Vogel2006; Zhang et al., Reference Zhang, Wang, Xu and Li2015b). Therefore, one can visualize that reversibility of atomic stacking between the α″ (−111) and γ° (111) planes is occurring under applied stress or heating.
(Color onine) Atomic distributions and parallelogram units of α″ (021), γ° (111), and α″ (−111) planes. The interior angles of parallelograms are about 98.1°, 110.0°, and 109.2°, respectively. Solid and hollow circles represent the atomic distribution of the closest lattice plane, respectively.

(a) α″ (021), (b) γ° (111), (c) α″ (−111)
IV. CONCLUSION
In this work, in situ XRD was used to investigate the behavior of the aged U–6.2Nb alloy during tensile testing and load–unload cycling. The experimental results indicate that XRD can accurately characterize the macroscopic deformation and recovery of this alloy, and yield insight into the deformation and recovery mechanism of the SMA.
Two kinds of deformation mechanisms were found in yield flat for the aged U–6.2Nb alloy during tensile testing. The deformation and recovery are controlled by phase transformation in the earlier yield flat, and transform to twinning deformation later. The experiment results suggest that the phase transformation is easier than twin reorientation during tensile deformation in the aged U–6.2Nb alloy, and the deformation can recover completely by reverse martensitic phase transformations from α″ to γ° in the earlier yield flat.
ACKNOWLEDGEMENTS
This work is supported by the National Natural Science Foundation of China (Grant no. 51671176), the Foundation of Science and Technology on Surface Physics and Chemistry Laboratory (Grant no. 9140C660202150C66284), and the Key Laboratory Foundation for Neutron Physics of CAEP (Grant no. 2015BB04). Our deepest gratitude goes to the editor and reviewers, especially one of the anonymous reviewers, for their careful work and thoughtful suggestions that have helped improve the quality of the manuscript.