



Adolescence represents a critical period for brain maturation and a pivotal time for the emergence of self-injurious thoughts and behaviours (SITBs).Reference Paus, Keshavan and Giedd1,Reference Keshavan, Giedd, Lau, Lewis and Paus2 The global prevalence of SITBs among adolescents is alarmingly high, with estimates indicating that suicidal ideation, non-suicidal self-injury (NSSI) and suicide attempts affect approximately 15.1, 6.2 and 2.6% of adolescents, respectively.Reference Knipe, Padmanathan, Newton-Howes, Chan and Kapur3,Reference Liu, Walsh, Sheehan, Cheek and Sanzari4 These prevalence estimates may be conservative due to the tendency to under-report such behaviours,Reference Blanchard and Farber5 which can skew the research on SITBs risk factors that often depend on self-reports and clinical accounts.Reference Franklin, Ribeiro, Fox, Bentley, Kleiman and Huang6 Moreover, previous aetiological research on SITBs has primarily focused on individuals with established behavioural phenotypes, creating a significant research gap in the prospective identification of risk factors in those who have not yet exhibited such behaviours, particularly during the critical transition from childhood to adolescence (ages 9–15 years). Unravelling the biological underpinnings of SITBs during this transitional phase, coupled with comprehensive psychological assessments, is crucial for advancing preventive measures. The absence of such studies represents a significant obstacle to improving suicide risk stratification and developing evidence-based intervention strategies.Reference Liu, Walsh, Sheehan, Cheek and Sanzari4,Reference O’Connor and Robb7
Genetic variation has been observed across the spectrum of SITBs.Reference Mirza, Docherty, Bakian, Coon, Soares and Walss-Bass8 Early twin studies have estimated that the heritability of suicide attempts ranges from 30 to 55%.Reference Voracek and Loibl9,Reference Baldessarini and Hennen10 Recent large-scale Genome-Wide Association Studies (GWAS) have reported liability scale heritability for SITBs, with single-nucleotide polymorphisms (SNPs)-based heritability (h 2 SNP) of suicidal ideation at 11% (marginally significant)Reference Brick, Marraccini, Micalizzi, Benca-Bachman, Knopik and Palmer11 and suicide attempts at 5.7%.Reference Docherty, Mullins, Ashley-Koch, Qin, Coleman and Shabalin12 Due to the polygenic nature of SITBs, which involves numerous SNPs with minor effects, polygenic risk scores (PRS) are employed to capture these minor effects and provide the statistical power needed to detect associations.Reference Docherty, Mullins, Ashley-Koch, Qin, Coleman and Shabalin12–Reference Dudbridge14 Emerging research has applied PRS derived from adult GWAS samples to adolescent data-sets, showing significant associations between adult suicide attempts PRS and SITBs in children.Reference Lee, Doyle, Silberstein, Jung, Liu and Perlis15,Reference Joo, Moon, Wang, Kim, Lee and Kim16 Despite this, most research has concentrated on suicide attempts PRS, highlighting the need to expand investigations to include a broader range of SITBs and their associated genetic factors. A recent study conducted in adults developed an ordinal suicidality phenotype encompassing passive suicidal ideation, ever contemplated self-harm (ECSH), non-suicidal self-injury (NSSI) and suicide attempts. It validated the association between a broad SITBs PRS and suicide.Reference Strawbridge, Ward, Ferguson, Graham, Shaw and Cullen17 Further independent genetic risk studies employing various SITBs PRS could enhance the understanding of genetic variations most influential in SITBs transitions, thereby improving suicide risk stratification and identifying high-risk individuals from pre-adolescence.
An expanding body of neuroimaging research has elucidated various phenotypes associated with adolescent SITBs.Reference Auerbach, Pagliaccio, Allison, Alqueza and Alonso18–Reference Wen, Qu, Zhang, Wang, Cui and Zhang20 Previous studies have identified abnormal structures in the dorsal lateral prefrontal cortex (dlPFC) and posterior cingulate cortex (PCC), along with disrupted resting-state functional connectivities (rsFCs) within the dorsal attention network (DAN), ventral attention network (VAN), default mode network (DMN), auditory network (AUN) and retrosplenial-temporal network (RTN), which can predict SITBs transition within 1 year in children.Reference Wen, Qu, Zhang, Wang, Cui and Zhang20 To fully capture the critical period from childhood to adolescence, exploring neuroimaging biomarkers of SITBs transition over broader time scales is essential. Early identification of these biomarkers, particularly for children with prolonged transition latency periods, can facilitate timely risk stratification.
Considering the polygenic nature of neurodevelopmental genes involved in key functions (e.g. cell adhesion/migration, small GTPase and receptor tyrosine kinase signalling) in suicide attempts, integration of genetic information with neurobiological phenotypes can enhance our understanding of the biological underpinnings of SITBs.Reference Sokolowski, Wasserman and Wasserman21 During prepubescence, the brain undergoes substantial neuroanatomical, functional and chemical restructuring, including synaptic pruning, neural efficiency optimisation and integration of diverse brain structures.Reference Paus, Keshavan and Giedd1,Reference Keshavan, Giedd, Lau, Lewis and Paus2,Reference Fuhrmann, Knoll and Blakemore22 These dynamic changes may influence SITBs transition during adolescence, either by mediating genetic risks or providing protective or compensatory effects. Despite the potential, research at the intersection of brain imaging and SITBs remains relatively underexplored. Clarifying the relationship between genetic variation and SITBs transitions would significantly advance our understanding of their biological aetiology and inform the development of brain imaging-based interventions.
Meanwhile, emerging clinical evidence highlights the high comorbidity of psychiatric disorders and their shared susceptibility to higher-order transdiagnostic factors.Reference Fusar-Poli, Solmi, Brondino, Davies, Chae and Politi23,Reference Krueger and Eaton24 To systematically model this complexity, the bifactor framework has been widely adopted to delineate a hierarchical structure of psychopathology, isolating the p-factor as a latent dimension that captures shared variance across various forms of psychopathology.Reference Caspi, Houts, Belsky, Goldman-Mellor, Harrington and Israel25 Critically, the p-factor has been empirially validated as a robust predictor of SITBs transition within 1 year,Reference Wen, Qu, Zhang, Wang, Cui and Zhang20 aligning with theoretical perspectives that situate SITBs within a transdiagnostic psychopathological domain.Reference Wang and Eaton26,Reference Hoertel, Franco, Wall, Oquendo, Kerridge and Limosin27 This conceptualisation is further supported by evidence that SITBs exhibit genetic, polygenic and neurodevelopmental bases that transcend diagnostic categories.Reference Sokolowski, Wasserman and Wasserman21 Collectively, these observations suggest that shared genetic variation may underlie both the p-factor and SITBs transition. However, recent studies suggest that the p-factor may not adequately capture complex patterns of multivariate associations at both biobehavioural and genomic levels.Reference Grotzinger, Mallard, Akingbuwa, Ip, Adams and Lewis28 Therefore, this study aims to explore genetic variants associated with SITBs transition by integrating the p-factor with other domain-level factors.
Utilising large data-sets is essential for identifying robust genetic and neurobiological factors associated with SITBs transition during adolescence. This study aims to conduct a 4-year longitudinal analysis of children aged 9–10 years from the Adolescent Brain and Cognitive DevelopmentSM Study® (ABCD) data-set, to elucidate the genetic and brain mechanisms underlying SITBs transition during adolescence. The objectives of the study are threefold: (a) to delineate genetic susceptibility associated with SITBs transition during adolescence, with a particular focus on trajectory analysis to identify critical periods of heightened genetic influence; (b) to characterise the structural and functional brain changes linked to SITBs transition during adolescence; and (c) to explore potential neurobiological and clinical mediators of genetic susceptibility to SITBs transition during adolescence (Fig. 1).
Overview of study goals and operational flowchart (right). Our research was conducted on children aged 9–10 years from the Adolescent Brain and Cognitive DevelopmentSM Study (ABCD Study®) release 5.1. This data-set included baseline and follow-up data collected over 4 years, encompassing genetics, imaging and phenotypic information. The primary objectives of the study and the analytical pipeline are illustrated to identify the genetic susceptibility of SITBs transition during adolescence (top left), identify structural and functional brain architecture of SITBs transition during adolescence (centre left) and explore potential neurobiological and biobehavioural mediators of genetic susceptibility on SITBs transition during adolescence (bottom left). KSADS-5, Kiddle Schedule for Affective Disorders and Schizophrenia; CBCL, Child Behaviour Checklist; rsfMRI, resting-state functional magnetic resonance imaging; sMRI, structural magnetic resonance imaging; SITBs, self-injurious thoughts and behaviours; PRS, polygenic risk scores; SA, suicide attempts; ESH, ever self-harm; ECSH, ever contemplated self-harm; NSSI, non-suicidal self-injury; rsFC, resting-state functional connectivity; GMV, grey matter volume; QC, quality control.

Method
Population
Data for this study were derived from the most recent release of the ABCD Study®, specifically the Curated Annual Release 5.1 version, accessed through the National Institute of Mental Health Data Archive (NDA). The initial cohort comprised 11 868 pre-adolescents aged between 9 and 10 years recruited from 21 data collection centres across the USA between 2016 and 2018. Follow-up assessments were conducted annually over 4 years. At the 1-year follow-up (2017–2019), 11 220 participants (aged 10–11 years) were re-evaluated; the 2-year follow-up (2018–2020) included 10 973 participants (aged 11–12 years) and the 3-year follow-up (2019–2021) involved 10 336 participants (aged 12–13 years). Finally, the 4-year follow-up (2020–2022) assessed 4754 participants (aged 13–14 years). Only participants with complete sociodemographic data and outcome variables (baseline SITBs history and longitudinal SITBs data) were included in the analysis. Details regarding the inclusion and exclusion criteria for the analytical sample are shown in Fig. 1. Verbal assent from the pre-adolescents and written informed consent from their caregivers were obtained. All procedures were reviewed and approved by the centralised Institutional Review Board (IRB no. 160091) at the University of California, San Diego, and by local IRBs at each participating site.
Clinical data
SITBs transition assessment
SITBs were evaluated using the child-report version of the suicide module from the validated, computerised Kiddle Schedule for Affective Disorders and Schizophrenia (KSADS, Lifetime version).Reference Kaufman, Birmaher, Brent, Rao, Flynn and Moreci29 The KSADS interview was consistently administered across 5 waves of the ABCD Study®, including baseline and 4-year follow-up. Participants were coded as having SITBs if they exhibited any of the following: suicidal ideation (including passive suicidal ideation, non-specific active suicidal ideation, specific method, active suicidal ideation with intent and active suicidal ideation with a plan), NSSI, suicidal plans (i.e. preparatory action toward imminent suicidal behaviour) or suicide attempts (including interrupted suicide attempts, aborted suicide attempts and actual suicide attempts)Reference Wen, Qu, Zhang, Wang, Cui and Zhang20. Only participants without a history of SITBs at baseline were included in the analysis, and they were then categorised by their SITBs transition period, with each category encompassing the earlier transitions: within 1 year, within 2 years, within 3 years and during adolescence (within 4 years). Detailed SITBs category information is provided in Supplementary Table 1.
Dimensional psychopathology calculation
Dimensional psychopathology was calculated using a validated parent-report version of the Child Behaviour Checklist (CBCL) for ages 6–18 years, with items rated on a 3-point Likert scale ranging from 0 (‘not true’) to 2 (‘very true’).Reference Achenbach and Ruffle30 Next, the p-factor and three subordinate factors (internalising factor, conduct problem and attention-deficit hyperactivity disorder [ADHD] factor) were derived based on the bifactor model, with methodological details described in Supplementary Methods.
Genetic data
Comprehensive protocols for genotyping, quality control and imputation are provided in Supplementary Methods. Following these quality control measures, a total of 5335 genetically unrelated children of European ancestry were included in the PRS analysis. PRS for four categories of SITBs were generated using PRSice-2, including ever self-harm (ESH), ECSH, NSSI and suicide attempts. Central to these distinctions is the role of suicidal intent. ECSH refers to ideational self-harm, while behavioural categories are defined by their explicit linkage to intent: ESH captures self-harm acts regardless of intent, suicide attempts specifically denotes acts performed with the explicit intent to die, while NSSI describes deliberate self-harm to body tissue without suicidal intent. Summary data for European ancestry were used. Detailed information about the base sample of SITBs is provided in Supplementary Table 2. In the models we adjusted for age, gender and the top ten genetic principal components of genetic ancestry, to account for population stratification. Eight thresholds (1 × 10⁻⁵, 0.005, 0.01, 0.05, 0.1, 0.3, 0.5, 1.0) were tested for PRS scores. Sensitivity analyses were performed to assess the robustness of the PRS at different thresholds. For a detailed understanding of PRS calculation and interpretation of PRS results, readers are referred to the PRSice-2 website: https://choishingwan.github.io/PRS-Tutorial/.
Imaging data
Detailed procedures for imaging acquisition and preprocessing are described in Supplementary Methods; only baseline imaging data that met protocol compliance and quality control standards were included (Supplementary Table 1). We then applied harmonisation separately to structural and functional brain measurements to address multisite scanner variability. The impact of this harmonisation on magnetic resonance imaging (MRI) measures is visualised and presented in Supplementary Fig. 1.
Statistical analyses
Genetic analyses
We performed logistic regression analyses to identify the genetic susceptibility of SITBs transition using the R package glm (for Windows, macOS, Linux and Unix, R Foundation for Statistical Computing, Vienna, Austria; see https://cran.r-project.org/). All quantitative measures were z-transformed. The outcome measures (i.e. SITBs transition within 1 year, 2 years, 3 years, 4 years) served as binary dependent variables.
Specifically, we used SITBs PRS (i.e. suicide attempts, ESH, ECSH, NSSI) as independent predictors. We included covariates with sociodemographic information such as age, gender, caregiver highest education and combined household income in the baseline model, as well as the top ten genetic principal components, to control for potential differences in population substructure within European individuals. Next, we checked the associations of SITBs PRS with SITBs transition after controlling for the above covariates. The association of PRS with SITBs transition was estimated using the odds ratio, which represents the likelihood of transitioning to SITBs during a specific period when PRS increases by 1 s.d. from the norm.
Sensitivity analyses
Notably, we assessed the robustness of these associations by varying the P-value thresholds for constructing PRS in sensitivity analyses. Significance was determined using Bonferroni correction for multiple comparisons (false discovery rate (FDR)). We calculated the proportion of variance explained by PRS (Nagelkerke pseudo-R 2, ΔR 2) by comparing the difference in R 2 between models and dividing it by 1 – R 2 of the baseline model. We identified the most predictive PRS for SITBs transition (largest ΔR 2) to determine the optimal P-value threshold, which was then used in mediation analyses to maximise power and limit comparisons.
 $$\Delta {R^2} = {{R_{\text{PRS}}^2 - R_{\text{baseline}}^2} \over {1 - R_{\text{baseline}}^2}}$$
Trajectory analyses
To model SITBs risk over 5 time points within the age range 9–15 years, we employed generalised additive models (GAMs) using the mgcv package. GAMs were chosen for their flexibility in capturing potential non-linear relationships between age and SITBs risk. We applied a smoothing function to the age variable, where the effective degrees of fredom (e.d.f.) statistic quantifies the degree of non-linearity in the trajectory. To appropriately account for the longitudinal nature of the data, an additional smoothing function was included as follows.
 $$\matrix{{SITBs\,ris{k_{ij}}} { = {\beta _0} + {\beta _1}\,PR{S_i} + \sum\limits_{k = 1}^K {{\beta _k}C{V_{ik}}} } \cr {} { + {f_1}(ag{e_{ij}},\,by = PR{S_i}) + {\varepsilon _i}} \cr }$$
Here,
 ${{\beta _0}}$
represents the intercept,
 ${{\beta _1}}$
captures the effect of PRS for SITBs
 ${\sum\nolimits_{k = 1}^K {{\beta _k}C{V_{ik}}} }$
and accounts for the contribution of covariates, including age, gender, caregiver’s highest education, combined household income and the top ten genetic PCs. Meanwhile,
 ${{f_1}(ag{e_{ij}},\,by = PR{S_i})$
models the non-linear age trajectories stratified by PRS groups. The residuals
 ${\varepsilon _i}$
account for unexplained variability.
To assess differences between the genetic susceptibility trajectories, we computed difference curves using the gratia package. These difference curves allow for the comparison of SITBs risk trajectories across genetic susceptibility groups. Significance was determined based on whether the confidence intervals of the difference curves excluded zero, indicating statistically significant differences between the trajectories.
Brain analyses
We continued to perform logistic regression analyses to identify brain correlates of SITBs transition using the R package glm. Specifically, we used all structural (148 regional GMVs) and functional (78 rsFCs) brain measures as predictors. Besides sociodemographic information, the baseline model for structural brain analysis included handedness and global GMV as covariates, while the model for functional brain analysis included handedness and mean motion. We controlled for scanner effects on all brain measures, then assessed the associations between regional brain measures and SITBs transition, estimating odds ratios to represent the likelihood of SITBs transition with each 1 s.d. increase in GMV or rsFC. Notably, all P-values were FDR corrected due to multiple comparisons, with corrected P < 0.05 considered statistically significant. All effects were visualised in brain plots using the R packages ggseg and ggsegDesterieux.
Mediation analyses
We explored how genetic susceptibility influences SITBs transitions during adolescence through neurobiological and clinical mediators, using the R package mediation. Factors significantly associated with SITBs transitions were included as mediators in the analysis. For each model, we conducted two regression analyses: the first examined the impact of SITBs PRS on the mediator (regional GMV, rsFC or dimensional psychopathology factor score) while the second assessed the indirect effect of PRS on SITBs transitions while accounting for the mediator. All relevant covariates were included in the logistic regression models. We evaluated the significance of the direct (average direct effect (ADE)) and indirect (average causal mediation effect (ACME)) paths through non-parametric bootstrap confidence intervals (1000 simulations). The proportion of the effect mediated was calculated, which indicates how much of the genetic effect is explained by the identified neurobiological or biobehavioural pathways.
Results
Sociodemographic characteristics of adolescents with SITBs transition
The participant inclusion and exclusion flowchart is illustrated in Fig. 1. The baseline sociodemographic details of the transition groups over the 4 years are summarised in Table 1. Among participants with completed SITBs reports, 4.1% (n = 384) of children developed SITBs within 1 year, 7.3% (n = 661) within 2 years, 12.9% (n = 1092) within 3 years and up to 29.3% (n = 1312) over the 4-year adolescence period. In the short term, no significant differences were observed in either gender or family socioeconomic status (SES) between those who developed SITBs and those who did not. However, over the full adolescence period, significant differences emerged. Specifically, females were significantly over-represented among those who transitioned (P < 0.001), and this group also had lower household income levels (P = 0.024) and lower parental education levels (P = 0.026).
Sociodemographic characteristics of adolescents with SITBs transition compared with controls

Table 1 Long description
The table compares sociodemographic characteristics of adolescents with SITBs transition and controls over 1 to 4 years. It has 4 sections: SITBs transition within 1 year, 2 years, 3 years, and 4 years. Each section includes columns for Control, Experiment, and P-value. The table has 10 rows with headers: n (%), Age (mean, s.d., years), Gender (%), Household income (GB pounds, %), and Parental highest education (%). Row 1: n (%), Control: 9060 (95.9), Experiment: 384 (4.1), P-value: 0.607. Row 2: Age (mean, s.d., years), Control: 9.91 (0.63), Experiment: 9.93 (0.64), P-value: 0.146. Row 3: Gender (%), Male: Control: 4647 (51.3), Experiment: 212 (55.2), P-value: 0.146. Female: Control: 4413 (48.7), Experiment: 172 (44.8), P-value: 0.146. Row 4: Household income (GB pounds, %), <50 000: Control: 2543 (28.1), Experiment: 110 (28.6), P-value: 0.244. 50 000 and <100 000: Control: 2574 (28.4), Experiment: 122 (31.8), P-value: 0.059. >=100 000: Control: 3943 (43.5), Experiment: 152 (39.6), P-value: 0.146. Row 5: Parental highest education (%), Below high school: Control: 352 (3.9), Experiment: 9 (2.3), P-value: 0.322. High school grad/GED: Control: 731 (8.1), Experiment: 30 (7.8), P-value: 0.867. College: Control: 2236 (24.7), Experiment: 109 (28.4), P-value: 0.146. Bachelor: Control: 2423 (26.7), Experiment: 87 (22.7), P-value: 0.146. Postgraduate degree: Control: 3134 (34.6), Experiment: 139 (36.2), P-value: 0.146.
GED, graduate (grad.) equivalency degree; SITBs, self-injurious thoughts and behaviours.
Genetic susceptibility of SITBs transition during adolescence
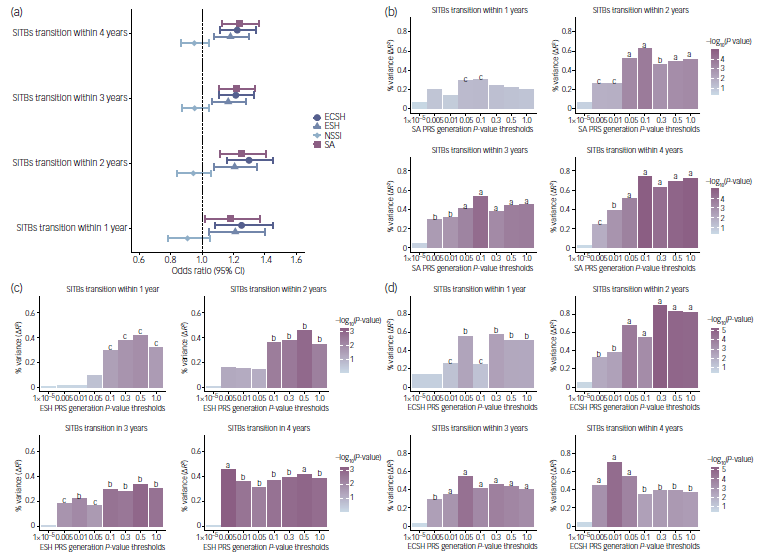
Our analyses revealed significant associations between suicide atempts PRS, ESH PRS and ECSH PRS and all periods of SITBs transition (Fig. 2(a) and Supplementary Tables 3–5). In contrast, the association between NSSI PRS and SITBs transition was not significant at any period (Supplementary Table 6). Sensitivity analyses confirmed that the associations of suicide attempts PRS, ESH PRS and ECSH PRS with SITBs transition remained robust under various conditions (Fig. 2(b)–(d)).
(a) Association of SITBs PRS with SITBs transition during adolescence. Estimated odds ratios and 95% confidence intervals of SITBs PRS associated with SITBs transition. The dotted line represents the null effect (i.e. odds ratio 1.0). The results are displayed in the model using odds ratio (the exponential of the logistic regression β-coefficient) with 95% confidence interval (standard error of regression estimates). (b)–(d) Sensitivity analysis results for (b) SA PRS, (c) ESH PRS and (d) ECSH PRS associated with SITBs transition within 1, 2, 3 and 4 years. The y axis represents the percentage of total variance explained by SITBs PRS (Nagelkerke pseudo-R
2, ΔR
2), which was computed as the difference in R
2 between models and dividing this by 1 – R
2 of the baseline model
 $\Delta {R^2} = {{R_{\text{PRS}}^2 - R_{\text{baseline}}^2} \over {1 - R_{\text{baseline}}^2}}$
, controlling for age, gender, education, income and the top ten principal component covariates. The x axis represents eight P-value thresholds used to generate SITBs PRS. At the top of each bar, the P-value significance of the estimated coefficients surviving multiple comparison corrections for each PRS is displayed. Distinct colours are used to denote the statistical significance of effect size for each SITBs PRS. a P ≤ 0.001. b 0.001 < P ≤ 0.01. c 0.01 < P ≤ 0.05. SITBs, self-injurious thoughts and behaviours; PRS, polygenic risk scores; SA, suicide attempts; ESH, ever self-harm; ECSH, ever contemplated self-harm; NSSI, non-suicidal self-injury.

Specifically, the effect size of suicide attempts PRS on SITBs transition over 4 years (i.e. odds ratio) was 1.24 (Fig. 2(b) and Supplementary Table 3). As the transition period for SITBs increased, the association between suicide attempts PRS and SITBs transition became more pronounced and remained statistically significant across all periods: within 1 year (odds ratio 1.18 [95% CI 1.02–1.37], P adj = 0.029), 2 years (odds ratio 1.25 [95% CI 1.12–1.41], P adj = 1.91 × 10⁻⁴), 3 years (odds ratio 1.22 [95% CI 1.11-1.34], P adj = 8.21 × 10⁻⁵) and 4 years (odds ratio 1.24 [95% CI 1.13–1.36], P adj = 4.68 × 10⁻⁵). The suicide attempts PRS at a P-value threshold of 0.1 accounted for the largest amount of variance in SITBs transition over 4 years (ΔR 2 = 0.74%).
Moreover, the effect size of ESH PRS on SITBs transition over 4 years was 1.18 (Fig. 2(c) and Supplementary Table 4). The association between ESH PRS and SITBs transition strengthened as the transition period extended, remaining statistically significant across all periods: within 1 year (odds ratio 1.21 [95% CI 1.05–1.40], P adj = 0.010]), 2 years (odds ratio 1.21 [95% CI 1.08–1.35], P adj = 0.002), 3 years (odds ratio 1.17 [95% CI 1.06–1.28], P adj = 0.002) and 4 years (odds ratio 1.18 [95% CI 1.07–1.30], P adj = 0.002). The ESH PRS at a P-value threshold of 0.005 explained the largest amount of variance in SITBs transition over 4 years (ΔR 2 = 0.46%).
Similarly, the effect size of ECSH PRS on SITBs transition over 4 years was 1.22 (Fig. 2(d) and Supplementary Table 5). The association between ECSH PRS and SITBs transition remained statistically significant across all periods: within 1 year (odds ratio 1.25 [95% CI 1.08–1.45], P adj = 0.003]), 2 years (odds ratio 1.30 [95% CI 1.16–1.45], P adj = 2.18 × 10⁻⁵), 3 years (odds ratio 1.21 [95% CI 1.11–1.33], P adj = 1.29 × 10⁻⁴) and 4 years (odds ratio 1.22 [95% CI 1.12–1.34], P adj = 8.05 × 10⁻⁵). The ECSH PRS at a P-value threshold of 0.01 explained the largest amount of variance in SITBs transition within 4 years (ΔR 2 = 0.70%).
SITBs developing trajectories over adolescence stratified by genetic susceptibility
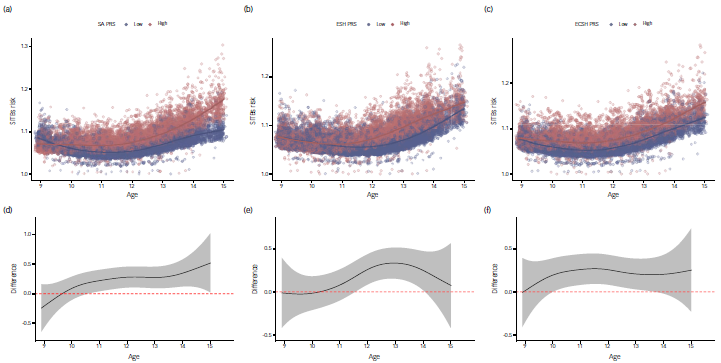
The analysis revealed that the high suicide attempts PRS trajectory group comprised 2549 children (50.7%) at baseline, while the high ESH PRS and high ECSH PRS groups included 2478 (49.3%) and 2485 (49.4%) children, respectively. When stratified by genetic susceptibility, we observed a significant curvilinear increase in SITBs risk across the high suicide attempts PRS group (e.d.f. = 2.91, χ 2 = 59.8, P < 2.0 × 10⁻¹⁶), high ESH PRS group (e.d.f. = 3.19, χ 2 = 54.7, P < 2.0 × 10⁻¹⁶) and high ECSH PRS group (e.d.f. = 2.87, χ 2 = 41.9, P < 2.0 × 10⁻¹⁶). These results indicate that adolescents with high genetic susceptibility experience a more pronounced increase in SITBs risk between the ages of 9 and 15 years (Fig. 3(a)−(c)).
SITBs risk trajectories during adolescence stratified by genetic susceptibility. (a)–(c) SITBs risk trajectories during adolescence stratified by (a) SA PRS, (b) ESH PRS and (c) ECSH PRS displayed on the same scale. The results are displayed in the model using odds ratio (exponentiated β-coefficient derived from generalised additive models [GAMs]) with 95% confidence interval (standard error of estimates). (d)–(f) Pairwise trajectory difference curves quantifying temporal divergence between (d) SA PRS, (e) ESH PRS and (f) ECSH PRS. Differences are expressed as instantaneous odds ratio contrasts (exponentiated β-coefficient differences) with 95% confidence interval (standard error of estimates). Trajectories are considered to be significantly different if the confidence interval does not include zero (dashed red line). Results of GAMs are displayed as the mean estimates (solid lines) ±95% confidence intervals (shaded areas). SITBs, self-injurious thoughts and behaviours; PRS, polygenic risk scores; SA, suicide attempts; ESH, ever self-harm; ECSH, ever contemplated self-harm.

To further explore these trajectories, we plotted difference curves to compare each pair of genetic susceptibility groups (Fig. 3(d)−(f)) The difference curves between the low and high genetic susceptibility groups displayed similar patterns, with a notably steeper increase in SITBs risk for the latter group during specific age ranges: 11–15 years for suicide attempts PRS, 12–14 years for ESH PRS and 10–14 years for ECSH PRS. These findings suggest that adolescence represents a critical window of heightened vulnerability to the influence of genetic risk for SITBs.
Brain architecture of SITBs transition during adolescence
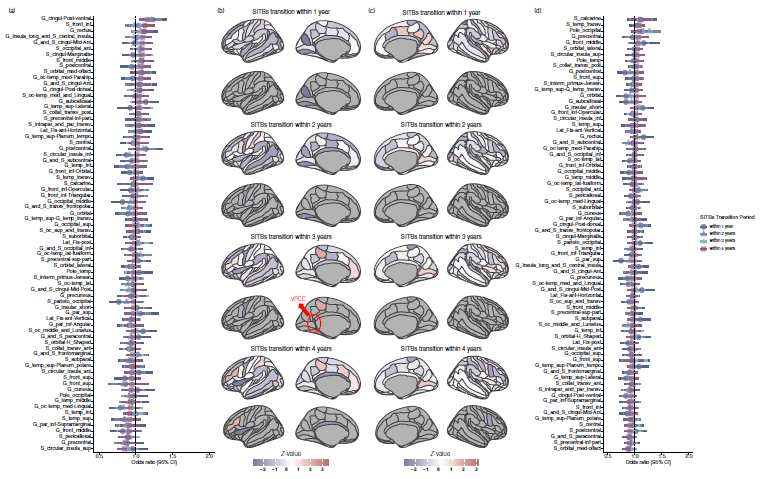
Baseline structural brain signatures accounted for up to 5.3% of the variance in SITBs transition within 1 year and up to 2.9% within 4 years. We found significant associations (P < 0.05) between atypical GMV in 7 key brain regions and SITBs transition over 4 years (Fig. 4 and Supplementary Tables 7–10). These regions include the left superior circular sulcus of the insula, left ventral posterior cingulate cortex (vPCC) and left sulcus of the corpus callosum and bilateral ventromedial prefrontal cortex (vmPFC), comprising the left rectus gyrus and right medial orbital sulcus. Furthermore, the left inferior frontal sulcus (IFS) and right inferior part of the precentral sulcus, both key components of the DAN, were also implicated. Notably, only the left vPCC survived multiple comparisons correction (odds ratio 1.17 [95% CI 1.07–1.28], P adj = 0.043).
Association of structural brain with SITBs transition during adolescence. Association of left and right hemisphere regional GMVs with SITBs transition during adolescence. (a) Forest plot displaying odds ratios and 95% confidence intervals for the 74 regional GMVs in the left hemisphere. The results are displayed in the model using odds ratio (the exponential of the logistic regression β-coefficient) with 95% confidence interval (standard error of regression estimates). (b) Visualised brain plot showing z-values for all regions in the left hemisphere (rows 1, 3, 5, 7) and highlighting statistically significant regions (rows 2, 4, 6, 8). (c) Visualised brain plot showing z-values for all regions in the right hemisphere (rows 1, 3, 5, 7) and highlighting statistically significant regions (rows 2, 4, 6, 8). (d) Forest plot displaying odds ratios and 95% confidence intervals for the 74 regional GMVs in the right hemisphere. Covariates included in the analysis were gender, age, education, income, handedness and intracranial volume. Multisite scanner effect was controlled through harmonisation. The statistical model compared the effect of regional GMVs with a baseline model containing only these covariates. The red arrow indicates the left ventral posterior cingulate cortex (vPCC) that survived false discovery rate correction (P adj < 0.05). SITBs, self-injurious thoughts and behaviours; GMV, grey matter volume; G, gyrus; S, sulcus; ant, anterior; cingul, cingulate; collat, collateral; fis, fissure; front, frontal; inf, inferior; interm, intermedius; lat, lateral; med, medial; mid, middle; oc, occipital; olfact, olfactory; parahip, parahippocampal; par, parietal; post, posterior; sup, superior; temp, temporal; tempo, tempolare; transv, transverse.

In conjunction with structural correlates, we also found that baseline functional brain signatures accounted for up to 3.7% of the variance in SITBs transition within 1 year and up to 2.3% within 4 years. Meanwhile, aberrant rsFCs within or between several networks were significantly associated with SITBs transition over 4 years (Fig. 5 and Supplementary Tables 11–14). These include DMN, DAN, VAN, AUN, RTN, sensorimotor mouth network (SMM), cingulo-opercular network (CON), cingulo-parietal network (CPN), frontoparietal network (FPN), sensorimotor hand network (SMH), salience network and visual network. Notably, two rsFCs associated with DAN survived multiple comparisons correction, with increased rsFC between DMN and DAN remaining associated with SITBs transition within 1 year (odds ratio 1.98 [95% CI 1.37–2.84], P adj = 0.003), 2 years (odds ratio 1.76 [95% CI 1.32–2.34], P adj = 0.001) and 3 years (odds ratio 1.47 [95% CI 1.16–1.85], P adj = 0.015), and increased rsFC within DAN was associated with SITBs transition within 2 years (odds ratio 1.33 [95% CI 1.11–1.59], P adj = 0.028). Additionally, two rsFCs associated with AUN were marginally significant following multiple comparisons correction, with decreased rsFCs between AUN and SMH (odds ratio 0.76 [95% CI 0.62–0.92], P adj = 0.058) and between AUN and RTN (odds ratio 0.80 [95% CI 0.68–0.95], P adj = 0.058) associated with SITBs transition within 4 years.
Association of functional brain with SITBs transition during adolescence. Association of rsFCs with SITBs transition during adolescence. (a) Forest plot displaying odds ratios and 95% confidence intervals for the 78 rsFCs. The results are displayed in the model using odds ratio (the exponential of the logistic regression β-coefficient) with 95% confidence interval (standard error of regression estimates). (b) Relevant brain networks are visualised and colour-coded on the cortical surface. (c) Chord diagrams emphasising statistically significant rsFCs. Covariates included in the analysis were gender, age, education, income, handedness and mean motion. Multisite scanner effect was controlled through harmonisation. The statistical model compared the effect of rsFCs with a baseline model containing only these covariates. Red asterisks denote rsFCs surviving false discovery rate (FDR) correction (P adj < 0.05), while black asterisks indicate rsFCs with marginal significance following FDR correction (P adj = 0.058). SITBs, self-injurious thoughts and behaviours; rsFCs, resting-state functional connectivities; AUN, auditory network; CON, cingulo-opercular network; CPN, cingulo-parietal network; DAN, dorsal attention network; DMN, default mode network; FPN, frontoparietal network; RTN, retrosplenial temporal network; SMH, sensorimotor hand network; SMM, sensorimotor mouth network; SN, salience network; VAN, ventral attention network; VN, visual network.

Potential mediators of genetic susceptibility on SITBs transition during adolescence
Mediating role of structural and functional brain
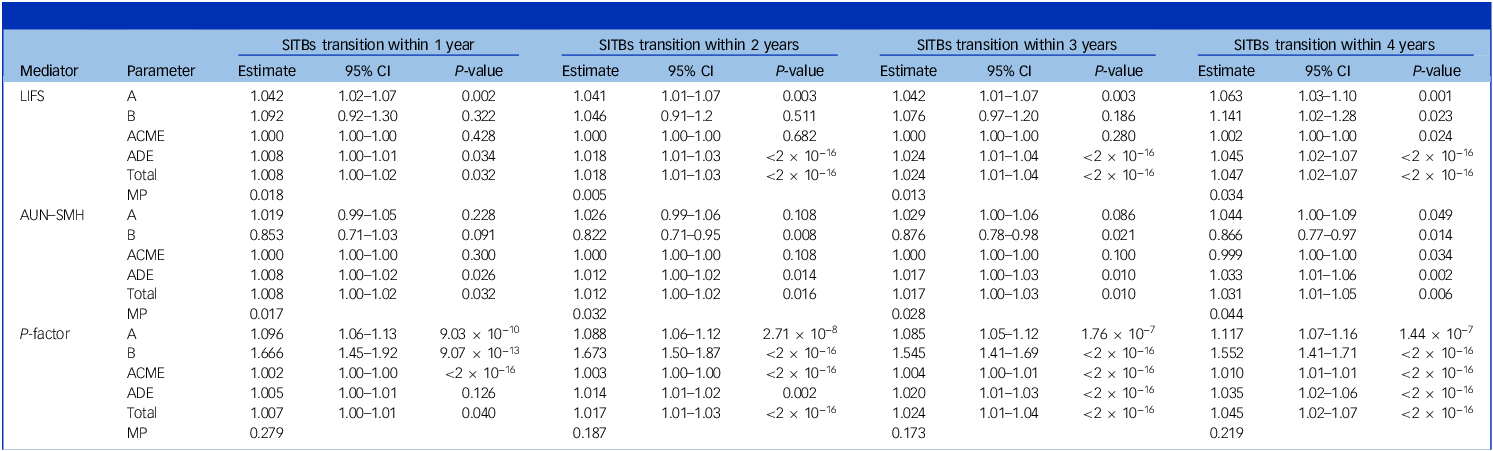
Our findings revealed that the effect of suicide attempts PRS on SITBs transition within 4 years was partially mediated by GMV changes in the left IFS (Fig. 6(a)); the GMV of the left IFS accounted for 3.4% of the total effect of suicide attempts PRS on SITBs transition.
(a) Mediation of neurobiological and clinical factors on the association between SA PRS and SITBs transition, with the GMV of the IFS as mediator, with (b) resting-state functional connectivity between AUN and SMH as mediator and (c) the p-factor as mediator. A, the effect of the independent variable on the mediator; B, the effect of the mediator on the dependent variable. We evaluated the significance of the direct (average direct effect, ADE) and indirect (average causal mediation effect, ACME) paths through non-parametric bootstrap confidence intervals (1000 simulations). The results are displayed in the model using odds ratio (OR; the exponential of the logistic regression β-coefficient). The proportion of the effect mediated (MP) was calculated, which indicates how much of the genetic effect is explained by the identified neurobiological or biobehavioural pathways. Detailed information about the models are demonstrated in Table 2. SA PRS, suicide attempts polygenic risk scores; SITBs, self-injurious thoughts and behaviours; GMV, grey matter volume; IFS, inferior frontal sulcus; AUN, auditory network; SMH, sensorimotor hand network.

In addition, we also found that the effect of suicide attempts PRS on SITBs transition over 4 years was partially mediated by rsFC between the AUN and SMH (Fig. 6(b)). Notably, the increased rsFC between AUN and SMH exhibited a suppressive effect on the risk associated with suicide attempts PRS, suggesting that enhanced connectivity between these networks may partially mitigate the genetic risk for SITBs transition during adolescence.
Mediating role of dimensional psychopathology
Our analyses found that baseline dimensional psychopathology accounted for up to 2.5% of the variance in SITBs transition within 1 year and up to 4.6% within 4 years. Among all the dimensional psychopathology factors, we found that only the p-factor and internalising factor remained associated with all periods of SITBs transition during adolescence following FDR correction (Supplementary Table 15), including SITBs transition within 1 year (p-factor: odds ratio 1.48 [95% CI 1.34–1.64], P adj = 1.23 × 10⁻¹³; internalising factor: odds ratio 1.16 [95% CI 1.04–1.28], P adj = 0.011), 2 years (p-factor: odds ratio 1.54 [95% CI 1.42–1.66], P adj < 2.0 × 10⁻¹⁶; internalising factor: odds ratio 1.11 [95% CI 1.2–1.2], P adj = 0.032), 3 years (p-factor: odds ratio 1.45 [95% CI 1.36–1.55], P adj < 2.0 × 10⁻¹⁶; internalising factor: odds ratio 1.09 [95% CI 1.02–1.16], P adj = 0.024) and 4 years (p-factor: odds ratio 1.44 [95% CI 1.34–1.54], P adj < 2.0 × 10⁻¹⁶; internalising factor: 1.10 [95% CI 1.03–1.18], P adj = 0.007). However, the ADHD factor showed significant association with SITBs transition only within 3 years (odds ratio 1.08 [95% CI 1.01–1.14], P adj = 0.026) and 4 years (odds ratio 1.12 [95% CI 1.05–1.19], P adj = 0.001).
Furthermore, mediation analyses demonstrated that the impact of suicide atempts PRS, ESH PRS and ECSH PRS on SITBs transition across all periods was partially mediated by the p-factor (Table 2, Fig. 6(c) and Supplementary Table 16). We compared the associations between different types of SITBs PRS and SITBs transition, finding that approximately 17–28% of the effect of suicide attempts PRS, 14–20% of ESH PRS and 8–10% of ECSH PRS on SITBs transition could be explained by the p-factor. These results suggest that the p-factor is particularly influential in the relationship between suicide attempts PRS and ESH PRS with SITBs transition. Further analysis showed that, in the short term (within 1 year), the p-factor serves as a crucial mediator for all three types of PRS on SITBs transition. However, as adolescence progresses (up to 4 years), the genetic risks associated with suicide attempts PRS and ESH PRS increasingly exhibit a direct relationship with SITBs behaviour, rather than being mediated solely through the p-factor.
Mediation model testing the significance of brain and clinical signatures as mediators of suicide attempts PRS and SITBs transition during adolescence association

Table 2 Long description
A table comparing the effects of different mediators on the transition of self-injurious thoughts and behaviors (SITBs) within 1 to 4 years. The table has 12 rows and 16 columns. Column headers include Mediator, Parameter, and various time frames (1 year, 2 years, 3 years, 4 years) with sub-columns for Estimate, 95% CI, and P-value. Row labels include mediators like LIFS, AUN-SMH, and P-factor, with parameters such as A, B, ACME, ADE, Total, and MP. Each cell contains specific values for estimates, confidence intervals, and p-values. Notable trends include varying estimates and p-values across different mediators and time frames, indicating the significance of different factors in mediating SITBs transitions.
PRS, polygenic risk scores; SITBs, self-injurious thoughts and behaviours; A, path A (predictor to mediator); ACDE, average causal mediation effect; ADE, average direct effect; B, path B (mediator to outcome); LIFS, left inferior frontal sulcus; AUN, auditory network; SMH, sensorimotor hand network; MP, mediated proportion. The results are displayed in the model using odds ratio (the exponential of the logistic regression β-coefficient) with 95% confidence interval (standard error of regression estimates).
Discussion
In this study, we identified a robust correlation between genetic susceptibility and SITBs transition during adolescence using the ABCD data-set, focusing on three SITBs PRS: suicide attempts PRS, ECSH PRS and ESH PRS. Notably, our analysis of SITBs developmental trajectories highlighted the ages 10–15 years as a critical window during which genetic risk has the most pronounced impact. We then examined the structural brain correlates of SITBs transition over 4 years, revealing notable abnormalities in regional GMV of the left vPCC. Meanwhile, our exploration of functional brain correlates identified significant disruptions in rsFCs in DAN and DMN. Mediation analysis further revealed that the association between genetic risk factors and SITBs transition is partially mediated by GMV in the left IFS, rsFC between the AUN and SMH and the p-factor.
Our study significantly advances the understanding of genetic factors in suicide research among children and adolescents in several key ways. First, we expanded the scope of research on the spectrum of SITBs in children. The relationship between NSSI and suicide ideation has long been debated, with some researchers advocating for their distinction,Reference Butler and Malone31 as shown in a recent study that developed an ordinal suicidality phenotype based on suicide ideation, ECSH, NSSI and suicide attempts.Reference Strawbridge, Ward, Ferguson, Graham, Shaw and Cullen17 However, limitations in that study suggest that their approach might misclassify individuals with ECSH/ESH or suicide ideation, misaligning them with their actual suicidality predisposition. Others recommend caution in distinguishing these behaviours,Reference Kapur, Cooper, O’Connor and Hawton32 noting that the strong correlation between NSSI and suicide ideation is primarily driven by overlapping genetic factors, suggesting a shared biological basis.Reference Maciejewski, Creemers, Lynskey, Madden, Heath and Statham33 Our findings support this view, revealing that an increased genetic burden for ESH, ECSH and suicide attemts – rather than for NSSI alone – is significantly linked to a higher risk of SITBs transition. This suggests that considering the combined genetic risk for these behaviours offers greater explanatory power for understanding SITBs.
Additionally, our results build on previous evidence of intergenerational suicide risk transmission, which has linked SITBs risk in children and adolescents to multigenerational familial SITBs, and this influence may begin as early as childhood.Reference Wen, Qu, Liu, Shu, Zhao and Wu34 In our study, we found that even at ages 9–10 years, children predisposed to transitioning already showed genetic risk for adult SITBs despite lacking any clinical SITBs phenotype. This association grew stronger and more consistent as the observation period extended from 1 to 4 years, highlighting the enduring impact of genetic factors on SITBs risk across developmental stages.
Our findings underscore the potential of integrating genomic information in the early identification of children at risk for suicide.Reference Lopes and McMahon35 We demonstrate that genetic variations related to suicide attempts, ESH and ECSH can effectively explain SITBs transitions in children. For short-term transitions (within 1 year), ECSH PRS showed greater explanatory power for SITBs transition than both ESH and suicide attempts PRS. However, over the entire adolescence period, both suicide attempts and ECSH PRS exhibited strong explanatory power. Prior research indicates that suicide attempts PRS accounts for 1.51% of suicide attempts variance in children and 0.68–0.88% in adults,Reference Lee, Doyle, Silberstein, Jung, Liu and Perlis15,Reference Mullins, Kang, Campos, Coleman, Edwards and Galfalvy36 while only ESH PRS, not ECSH PRS, explains 0.20% of this variance in adults.Reference Campos, Verweij, Statham, Madden, Maciejewski and Davis37 Although genomic information alone has limited clinical utility compared with phenotypic, socioeconomic and psychosocial factors,Reference Franklin, Ribeiro, Fox, Bentley, Kleiman and Huang6 their potential to inform risk before suicide attempts onset suggests value in integrating genetic information with other risk factors to enhance suicide prevention in children, especially in the absence of existing biomarkers.Reference Lee, Doyle, Silberstein, Jung, Liu and Perlis15
Furthermore, our study identified key structural brain correlates of SITBs transition during adolescence, especially for the left vPCC. The vPCC is integral to mnemonic processes, especially effortful episodic memory retrieval and semantic processing.Reference Foster, Koslov, Aponik-Gremillion, Monko, Hayden and Heilbronner38 Previous studies have shown that negative maternal parenting behaviours are closely related to the structural network organisation of the insula, vmPFC and vPCC in children.Reference Richmond, Beare, Johnson, Allen, Seal and Whittle39 Our study extends these findings by revealing the association between structural abnormalities in vPCC and SITBs transition during adolescence in offspring, suggesting that this region may constitute a key neurobiological substrate through which early environmental factors, such as adverse parenting, shape the developmental trajectory leading to SITBs. These findings enhance our understanding of the neurobiological mechanisms underlying SITBs development and offer new insights into potential prevention and intervention targets for children at risk of SITBs.
The human cerebral cortex matures over decades, following a sequential trajectory from basic sensory and motor regions in early life to higher-order association areas responsible for executive and socio-emotional functions during adolescence.Reference Sydnor, Larsen, Bassett, Alexander-Bloch, Fair and Liston40 This spatiotemporal pattern of development reflects the evolutionary principle of the sensorimotor-to-association axis of cortical organisation. Crucially, our study also identified a series of brain functional networks associated with SITBs transition during adolescence, including early-developing networks such as the AUN, SMH and RTN, which are considered to develop relatively early in life, exhibiting refined and mature structural and functional characteristics even in infancy. In contrast, late-developing networks, including the DAN, VAN and DMN, tend to mature later, continuing to refine throughout adolescence and early adulthood.Reference Sydnor, Larsen, Bassett, Alexander-Bloch, Fair and Liston40,Reference Nielsen, Kaplan, Meyer, Alexopoulos, Kenley and Smyser41 Additionally, the disrupted connectivity patterns in these early-developing networks, as seen in individuals with multigenerational familial SITBs,Reference Wen, Qu, Liu, Shu, Zhao and Wu34 suggest that such familial factors may elevate SITBs risk in offspring by interfering with the normal connectivity of these networks. Understanding these connectivity disruptions provides insight into the biological mechanisms underlying SITBs, and highlights the potential for early intervention strategies to improve clinical outcomes by targeting these network abnormalities.
Our study found that both structural and functional abnormalities of the DAN serve as predictors of SITBs transition during adolescence. These findings of altered inter- and intra-network rsFCs within the DAN align with earlier reports observing dynamic functional connectivity attenuation in weakly connected states among people with major depressive order with a history of suicide attempts.Reference Xu, Zhang, Li, Chen, Zhang and Zhou42 The consistency of these observations suggests that such disruptions in functional connectivity of the DAN may not only reflect a heightened vulnerability to suicide attempts but could also serve as a fundamental component of the neurobiological mechanisms that drive suicide attempts. The altered connectivity patterns of the DAN may impair the network’s ability to maintain effective attention and cognitive control, particularly under stress or emotional duress,Reference Mao, Xiao, Ding and Qiu43,Reference Majerus, Péters, Bouffier, Cowan and Phillips44 thereby increasing the likelihood of maladaptive responses such as SITBs. Clinically, this underscores the potential role of DAN dysfunction as a critical biomarker for identifying individuals at elevated risk for SITBs, and emphasises the importance of targeting these network disruptions in both preventive and therapeutic strategies aimed at mitigating SITBs transition.
Remarkably, we found that altered GMV of the left IFS partially mediated the effects of genetic predisposition to suicide attempts on SITBs transition during adolescence. The IFS is crucial for cognitive processes such as working memory and executive functions, with the left IFS specifically involved in language-related tasks and semantic processing.Reference Ruland, Palomero-Gallagher, Hoffstaedter, Eickhoff, Mohlberg and Amunts45 As part of broader networks encompassing language and cognitive control, the IFS plays a pivotal role in integrating these functions. Additionally, our findings demonstrated that altered rsFC between the AUN and SMH partially mitigated the genetic risk of suicide attempts on SITBs transition. These results suggest that the neurobiological mechanisms underlying SITBs transition during adolescence are influenced by genetic factors and are modulated by structural brain features and network connectivity across the brain. While genetic predisposition significantly impacts suicide risk, the development and connectivity patterns of brain networks may exert a modulatory effect. Thus, even though familial suicide risk might increase SITBs risk in offspring by altering connectivity in early-developing networks, these networks may also exhibit adaptive or compensatory mechanisms that can partially buffer the impact of genetic risk. In summary, alterations in the connectivity patterns of early-developing networks could reflect the profound influence of genetic factors and early-life experiences on mental health outcomes. The structural and functional states of these networks may serve as potential biomarkers for predicting the risk of SITBs transition during adolescence. Early identification of abnormal activity or connectivity within these networks could provide a critical window for personalised intervention. Moreover, the continued maturation of late-developing networks presents additional opportunities for intervention. Future research should focus on integrating genetic information with neuroimaging data to develop more effective strategies for identifying and preventing SITBs transition in high-risk youth.
Finally, our study identified the p-factor as a crucial mediator between SITBs PRS (i.e. suicide attempts PRS, ESH PRS and ECSH PRS) and the risk of SITBs transition during adolescence. Notably, the p-factor exhibited a significant mediating effect in these associations, highlighting shared genetic variation between it and SITBs transition. Previous studies have demonstrated that the p-factor represents a broad psychopathological liability, underpinned by genetic influences that transcend individual psychiatric disorders, suggesting a shared genetic architecture that contributes to a general vulnerability across a wide range of mental health conditions.Reference Allegrini, Cheesman, Rimfeld, Selzam, Pingault and Eley46 Our findings corroborate this perspective, revealing that the p-factor not only contributes to the risk of SITBs but also plays a pivotal role in mediating the relationship between genetic predisposition and the manifestation of SITBs during adolescence. The results suggest that targeting the p-factor could be an effective strategy to reduce the risk of SITBs transition in genetically predisposed children and adolescents. Unravelling the biological underpinnings of SITBs during this critical developmental phase, alongside rigorous psychological assessment, is vital for enhancing suicide risk stratification and informing targeted, evidence-based interventions aimed at mitigating SITBs onset and progression.
Although the current study showed that it is possible to triangulate SITBs transition during adolescence with the genetic and brain effects, several limitations warrant attention. First, the analysis was limited to participants of European ancestry. This restriction arises because the GWAS data used were predominantly derived from European cohorts, which may constrain the generalisability of our findings to other ethnic groups. Future research should aim to include diverse populations to enhance the applicability and robustness of the results across different genetic backgrounds.Reference Martin, Kanai, Kamatani, Okada, Neale and Daly47 Second, the effect sizes of the genetic and brain correlates identified in this study are relatively small. This limitation suggests that neither genetic predispositions nor brain abnormalities alone are sufficient to predict SITBs transitions at the individual level with high precision. Consequently, integrating genetic information, neuroimaging data and behavioural phenotypes is crucial for developing more effective suicide prevention interventions. A multifaceted approach that combines these data sources may provide a more comprehensive understanding of SITBs risk and improve predictive accuracy. Lastly, our study did not fully address the influence of environmental factors on SITBs behaviours and their genetic and neurobiological underpinnings. The complexity of gene–brain–behaviour relationships may involve intricate interactions that our modelling could not fully capture. Future research should explore how environmental factors, such as familial SES, parenting practices and other contextual elements, contribute to SITBs and interact with genetic and brain-based factors. By incorporating these variables, future studies can provide a more nuanced view of the environmental influences on SITBs and their interplay with genetic and neurobiological mechanisms.
Despite these limitations, our findings represent a substantial advancement in understanding the genetic and neurobiological mechanisms underlying SITBs transition during adolescence. This research addresses critical gaps in the sparse literature concerning suicide genetics in youths. By leveraging recent GWAS data on SITBs and combining these with a comprehensive, population-based cohort of young children and adolescents, our study provides new insights into the robust genetic and neurobiological foundations of SITBs transition. Notably, the identification of ages 10–15 years as a critical window for genetic risk highlights the need for targeted early interventions during this pivotal period to prevent SITBs in vulnerable youth. We also identified potential neurobiological and clinical mediators of genetic susceptibility on SITBs transition, shedding light on the pathways through which genetic risk may translate into SITBs. These findings suggest that the brain’s maturation processes during this developmental window may interact with genetic vulnerabilities, heightening the risk for SITBs.
This study carries significant translational implications for advancing suicide prevention paradigms in adolescent psychiatry. The incorporation of PRS into clinical practice could fundamentally transform risk stratification frameworks by providing quantifiable biological markers that complement existing psychosocial assessments.Reference Murray, Lin, Austin, McGrath, Hickie and Wray48 Particularly noteworthy is the cost-efficiency of genome-wide genotype data acquisition, which may be incidentally obtained through routine medical care in other specialties.Reference Murray, Lin, Austin, McGrath, Hickie and Wray48 When synergistically integrated with neuroimaging biomarkers and clinical phenomenology, this multimodal approach addresses a critical gap in current suicide prediction models that predominantly rely on subjective symptom reporting. The establishment of such an evidence-based system could enable earlier identification of high-risk subgroups through objective biological signatures, while simultaneously facilitating personalised intervention planning informed by individual neurogenetic profiles. Importantly, this integrated approach not only enhances clinical decision-making at the individual level but also creates opportunities for optimising the allocation of limited mental health resources through biologically informed risk stratification.
Supplementary material
The supplementary material is available online at https://doi.org/10.1192/bjp.2025.10300
Data availability
Data are from the ABCD Study®; access to these data is restricted to protect participants’ privacy. Users must create an account through the National Institute of Mental Health (NIMH) Data Archive, and they may then complete the necessary steps to gain access (https://data-archive.nimh.nih.gov/abcd). Processed data from this study (including those for MRI and resting-state functional MRI [rsfMRI]) have been uploaded to the NIMH Data Archive (NDA). Information on how to access ABCD data through the NDA is available on the ABCD Study® data-sharing webpage: https://abcdstudy.org/scientists_data_sharing.html. The ABCD Study® data used in this report were accessed from https://doi.org/10.15154/z563-zd24 (ABCD release 5.1) and https://doi.org/10.15154/1519007 (genotyping data). All variables included in the current study are listed and described in Supplementary Table 1. All data processing and statistical analyses were completed by September 2024.
Acknowledgements
We thank the ABCD participants and their families for their time and dedication to this project. Data used in the preparation of this article were obtained from the ABCD Study® (https://abcdstudy.org) and are held in the NDA. This is a multisite, longitudinal study designed to recruit more than 10 000 children aged 9–10 years and follow them over 10 years into early adulthood. The ABCD Study® is supported by the National Institutes of Health (NIH) and additional federal partners under award nos U01DA0401048, U01DA050989, U01DA051016, U01DA041022, U01DA051018, U01DA051037, U01DA050987, U01DA041174, U01DA041106, U01DA041117, U01DA041028, U01DA041134, U01DA050988, U01DA051039, U01DA041156, U01DA041025, U01DA041120, U01DA051038, U01DA041148, U01DA041093, U01DA041089, U24DA041123 and U24DA041147. A full list of supporters is available at https://abcdstudy.org/federal-partners.html. A listing of participating sites and a complete listing of the study investigators can be found at https://abcdstudy.org/principal-investigators/. ABCD Consortium investigators designed and implemented the study and/or provided data, but did not necessarily participate in the analysis or writing of this report. This manuscript reflects the views of the authors and may not reflect the opinions or views of the NIH or ABCD consortium investigators. The ABCD repository grows and changes over time. The ABCD® Study data used in this report were accessed from https://doi.org/10.15154/z563-zd24 (ABCD release 5.1) and https://doi.org/10.15154/1519007 (genotyping data). DOIs can be found at nda.nih.gov. This study was supported by Beijing Natural Science Foundation (7254462), National Natural Science Foundation of China (82441005), Capital’s Funds for Health Improvement and Research (2024-1-4111), Beijing Nova Program (20230484425) and STI2030-Major Projects-2021ZD0200702.
Author contributions
X.W. formulated the research questions, analysed and interpreted the data, created the tables and figures and wrote the first draft of the manuscript. Y.S. assisted in calculating PRS and in revising the manuscript. S.W. assisted in double-checking the data analyses. W.Y. and R.C. assisted in formulating the research questions, and revising the manuscript critically. All authors contributed feedback and approved the final manuscript.
Declaration of interest
None.


 ΔR2=RPRS2−Rbaseline21−Rbaseline2






eLetters
No eLetters have been published for this article.