INTRODUCTION
Self-sufficiency and recirculation of nutrients within the farm are central elements in the organic principles (European Commission 1991; IFOAM 2007). As such, necessary supplements such as vitamins for farm animals under organic settings should be of natural sources if possible (European Commision 1999). When deemed to be insufficient, extra vitamin E is supplemented in animal feeds as an antioxidant and also because of its diverse physiological roles (Dersjant-Li & Peisker Reference Dersjant-Li and Peisker2010). Some of the functions of vitamin E are effects against testicular degeneration, muscle dystrophy, resorption of foetus and lipid peroxidation (Jensen & Lauridsen Reference Jensen and Lauridsen2007; Bouwstra et al. Reference Bouwstra, Goselink, Dobbelaar, Nielen, Newbold and van Werven2008). Vitamin E is also important for ruminant meat and milk quality to protect membrane lipids and myoglobin from oxidation (Liu et al. Reference Liu, Lanari and Schaefer1995; Lee et al. Reference Lee, Kim, Liang and Song2003; Al-Mabruk et al. Reference Al-Mabruk, Beck and Dewhurst2004).
Dairy cow diets contain different levels of vitamin E depending on type of feed and the proportion of ingredients in the diet (NRC 2001; Beeckman et al. Reference Beeckman, Vicca, Van Ranst, Janssens and Fievez2010). Therefore, supplemental sources are mandatory when the levels are below what is required by animals for a given production. The additives exist mainly in two commercially available forms of vitamin E; namely, RRR-α-tocopheryl acetate (natural, derived from vegetable oil) and all-rac-α-tocopheryl acetate (synthetic, α-tocopherol produced by chemical synthesis) (Dersjant-Li & Peisker Reference Dersjant-Li and Peisker2010). It is well established that RRR-α-tocopheryl acetate has higher bioavailability than all-rac-α-tocopheryl acetate in peri-parturient dairy cows (Meglia et al. Reference Meglia, Jensen, Lauridsen and Waller2006; Weiss et al. Reference Weiss, Hogan and Wyatt2009), but less is known about the availability of the tocopherol-isomers in mid and late lactating cows. Still, the recommended intake of total (supplemental plus feedstuff origin) vitamin E, i.e. 2·6 IU/kg of body weight (NRC 2001), is the same for cows during late gestation and in lactation.
Recent surveys and experiments have indicated that the diets of organic winter-fed dairy cows have varying α-tocopherol contents and that cows, particularly during peripartum, have low plasma vitamin E concentration (Govasmark et al. Reference Govasmark, Steen, Strøm, Hansen, Singh and Bernhoft2005; Sivertsen et al. Reference Sivertsen, Overnes, Osteras, Nymoen and Lunder2005; Beeckman et al. Reference Beeckman, Vicca, Van Ranst, Janssens and Fievez2010; Lindqvist et al. Reference Lindqvist, Nadeau, Persson Waller, Jensen and Johansson2011; Mogensen et al. Reference Mogensen, Kristensen, Søegaard, Jensen and Sehested2012). As such, it is recommended that diets of dairy cows on organic farms should be supplemented with vitamin E. However, in organic farming, all necessary supplementation to the basic diets should ideally be of natural origin (European Commission 1999). As there are few or no alternatives, the Nordic countries have a present derogation from the EU regulations and may use synthetic vitamins A, D and E (European Commission 2005). Thus, it is deemed important to look for natural anti-oxidant sources to replace the synthetic ones.
Recent work has suggested that supplementation with a meal prepared from the macro algae Ascophyllum nodosum, a seaweed, or treatment of endophyte-infested pasture with A. nodosum product had positive effects on product quality (improved beef shelf-life) and stress tolerance (improved immune function) (Allen et al. Reference Allen, Pond, Saker, Fontenot, Bagley, Ivy, Evans, Brown, Miller, Montgomery, Dettle and Wester2001). Alginates containing high proportions of mannuronic acid polymers, such as A. nodosum, have been documented to be non-specific immunostimulants, through stimulation of the cytokine production by human monocytes (Otterlei et al. Reference Otterlei, Ostgaard, Skjaak-Braek, Smidsrød, Soon-Shiong and Espevik1991) and by increasing the superoxide production in macrophages from fish in vitro (Rokstad et al. Reference Rokstad, Espevik, Skjåk-Bræk, Vadstein, Brown, Gudding, Lillehaug and Midtlyng1996) and in vivo (Skjermo & Bergh Reference Skjermo and Bergh2004). Historically, A. nodosum has been used as supplementary feed for ruminants in Norway and is currently harvested, dried and milled commercially and sold as a feed supplement. A dairy cow experiment in the late 1960s demonstrated improved performance (+6 % in total milk yield) when lactating dairy cows were supplemented daily with 160 g A. nodosum (Jensen et al. Reference Jensen, Nebb and Sæter1968). However, the effects of A. nodosum supplementation in mid-lactation dairy cows on the adaptive immune response has so far remained elusive.
The objective of the current study was to test the consequences of feeding two different sources (forms) of supplemental vitamin E (RRR-α-tocopheryl acetate = NatvE or all-rac-α-tocopheryl acetate = SyntvE) on α-tocopherol and its stereoisomer content of plasma and milk and also on immune response of mid-lactation dairy cows relative to seaweed meal and control. The hypotheses were that supplementation of dairy cows with vitamin E, regardless of its form, would increase plasma and milk α-tocopherol compared with the non-supplemented cows and this increment would be bigger with NatvE than SyntvE. Furthermore, supplementation with vitamin E, regardless of its form, would provide an improved adaptive immune response to immunization compared with the control group, and cows given the seaweed meal supplementation would produce better adaptive immune response following immunization than cows in the control group.
MATERIALS AND METHODS
Animals, treatments and experimental design
The experiment was conducted from 22 August 2011 to 9 December 2011 with 24 (16 primiparous and 8 multiparous) Norwegian Red cows (NR) in their mid-lactation period at the start of the experiment (164 days in milk, s.d. = 30; BW = 511 kg, s.d. = 64 kg) at the Animal Production Experimental Centre, Norwegian University of Life Sciences, facility at Aas, Norway. The experiment was carried out in a 4 × 4 Latin square design (four groups over four periods) with six replicates (squares). During each of the experimental period that lasted for 4 weeks, the first 3 weeks were used for adaptation and the last week was used for sampling. Cows within each of the six squares were matched for age, stage of lactation and level of production.
The experiment was carried out according to the laws and regulations controlling experiments on live animals in Norway, the Norwegian Animal Research Authority, Oslo, Norway.
Feeds and chemical composition of feeds
Cows grazed a summer pasture before the commencement of the experiment and were provided with supplements of silage and concentrates produced for the experiment in the last week of grazing as an adaptation. Mineral and vitamin supplements were also given during the adaptation week.
Basal feed
During the experimental period the cows were fed on silage and concentrates that were produced according to standards for organic production (European Commission 1991). The silage was prepared from the first and second cut of a grass/clover ley preserved in round bales and fed ad libitum as an equal mixture of the two cuts through individual feeding gates, and the concentrate was given at a flat rate of about 3·0 kg/cow per day through computerized dispensers. Silage samples were taken for analysis each day of the sampling week by hand collection of representative amount immediately after offering.
Experimental supplements
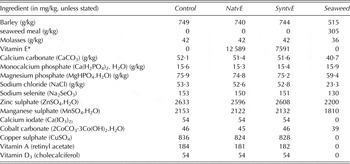
In addition to the basal feed, the cows in each group were fed one of the following four experimental supplements: NatvE (vitamin E added as RRR-α-tocopheryl acetate, Vitfoss A/S, DK-6300 Gråsten, Denmark), SyntvE (vitamin E added as all-rac-α-tocopheryl acetate, Zhejiang 138 Medicine Co Ltd, Zhejiang, China), seaweed (commercially available dried and ground macro algae A. nodosum, AlgeaFeed 3.5, Algea AS, Lødingen, Norway) and Control (with no added vitamin E or macro algae). The Control, NatvE and SyntE consisted (g/g DM) of barley (0·74), molasses (0·04) and a premix of minerals and vitamins A and D (0·21) supplied by Normin AS (Hønefoss, Norway) (Table 1). The seaweed was a mixture of macro algae (0·30), barley (0·52), molasses (0·04) and minerals (0·14) to achieve recommended supplementations of some important minerals in order to be similar to the other treatments with respect to total mineral supplementation. The NatvE and SyntvE supplements were formulated to provide 3800 mg α-tocopheryl acetate/kg supplement and an extra supply of 2275 mg α-tocopherol per cow daily. The Control, NatvE and SyntvE supplements were offered at a daily rate of 0·7 kg/cow and the Seaweed supplement at a rate of 0·8 kg/cow in order to maintain iso-energetic levels, assuming that the A. nodosum meal had a net energy content of 3·9 MJ/kg DM (Jensen et al. Reference Jensen, Nebb and Sæter1968).
Ingredient composition of the four experimental supplements prepared with no added vitamin E (Control), RRR-α-tocopheryl acetate (NatvE), all-rac-α-tocopheryl acetate (SyntvE) and seaweed and fed to cows in their mid-lactation as a source of α-tocopherol on top of the basal feed

* SyntvE: 500 000 mg All-rac-α-tocopherylacetate/kg vitamin E-product, i.e. 3800 mg α-tocopherylacetate/kg supplement. RRR: 301 000 mg RRR-α-tocopherylacetate/kg vitamin E-produc, i.e. 3800 mg α-tocopherylacetate/kg supplement.
The amount of seaweed meal per cow per day was approximately the same amount as was given in a previous experiment by Jensen et al. (Reference Jensen, Nebb and Sæter1968), where Black Sided Trønderfe and Nordlandsfe (STN) cows were given c. 160 g seaweed per day. This corresponded to c. 0·35 g seaweed meal per kg body weight. An NR cow weighed between 550 and 650 kg, and therefore was given c. 200 g of seaweed meal daily to provide the same amount in relation to body weight as in the experiment by Jensen et al. (Reference Jensen, Nebb and Sæter1968).
The experimental supplements were fed at milking hours, mixed manually with concentrates in the parlour to avoid discriminating refusal by cows. However, any feed refusal (concentrate + experimental supplements) was collected and weighed. The cows had free access to drinking water.
Feed samples were collected daily during the sampling week and mixed to one sample for each feed and period. The samples were stored at −20 °C, freeze dried (Christ LCM-2, Beta 1–16 and Christ LOC-1 m, Alpha 1–4, Martin Christ, Osterode am Harz, Germany; Hetosicc, Birkerød, Denmark), milled (1·0 mm screen) (Retsch SM 100, Retsch GmbH, Haan, Germany) and stored at −20 °C in plastic bags prior to analysis of chemical constituents. The samples were then analysed at Eurofins Food and Agro Testing, Moss, Norway, for dry matter (DM) (European Commission 2009), ash (European Commission 2009), crude protein (CP) (European Commission 2009), and neutral detergent fibre (NDF) was determined with an ANKOM220 fibre analyser (ANKOM Technology, Fairport, NY, USA) according to (Mertens Reference Mertens2002) using sodium sulphite, alpha amylase and ash correction (aNDFom). Undried silage samples (10 g) were homogenized and diluted with 40 ml of deionized water and stored at 4 °C for 24 h before pH was measured with a Termo Orion 420A+ pH-meter with Orion 9107BN electrode (Thermo Scientific, Beverly, MA, USA). Ammonia nitrogen was analysed with MAN-TECH PC-titrate (Guelph, ON, Canada) using an Orion ion analyser 901. Silage samples (20 g) were homogenized and diluted with 40 ml deionized water and stored frozen, then thawed and filtered before analysing organic acids and ethanol by HPLC using a VA 300/7.8 Nucleogel Ion 300 OA column (Machery-Nagel) at 50 °C (mobile phase, 0·010 m H2SO4 at 0·6 ml/min) with an UV spectrophotometric detector for lactic acid and a refractive index detector for other acids and ethanol.
For analysis of fatty acids (FA), fat was extracted in a mixture of chloroform and methanol according to Bligh & Dyer (Reference Bligh and Dyer1959) after acidification by boiling in 3 mol/l hydrochloric acid (HCl) for 60 min (Jensen Reference Jensen2008). The FA was analysed as FA methyl esters as described by Jensen & Nielsen (Reference Jensen and Nielsen1996) by gas chromatography (Hewlett Packard 6890 series, Agilent Technologies, Palo Alto, CA, USA) equipped with an automatic on-column injector (Hewlett Packard 7673) (Split ratio 4.325:1); a capillary column of 30 m × 320 μm inner diameter; 0·25 μm film thickness (Omegawax, Supelco 4-293-415, Sigma-Aldrich, St. Louis, MO, USA) and a flame ionization detector using C17:0 as an external standard.
For α-tocopherol analysis, 2 g dried material was suspended in 70 ml ethanol, 30 ml methanol, 30 ml ascorbic acid in water (200 g/l) and 20 ml potassium hydroxide-water (1:1 w/v). This mixture was saponified for 30 min at 80 °C in the dark and cooled in cold water. Exactly 2 ml of the saponified mixture was diluted in 1 ml water after which tocopherol was extracted twice using 5 ml heptane and analysed by HPLC (Perkin Elmer HS-5-Silica column, 4·0 × 125 mm, Waltham, MA, USA) as described by Jensen & Nielsen (Reference Jensen and Nielsen1996) and Jensen et al. (Reference Jensen, Jensen, Jakobsen, Engberg, Andersen, Lauridsen, Sørensen, Skibsted and Bertelsen1998). Stereoisomers of α-tocopherol were analysed by HPLC as follows: The remaining heptane extract was evaporated to constant DM under a stream of nitrogen at 50 °C and 50 μl ethylene glycol dimethyl ether and 25 μl KOK were added to the dried samples. Thereafter the tubes were filled with argon and 45 μl dimethyl sulphate was added. The samples were shaken for 1 h (IKA-VIBRAX-VXR, Janke & Kenkel, Germany), evaporated and 100 μl water and 1·5 ml heptane added. The samples were then vortexed and centrifuged for 10 min at 3000 rpm. The supernatant were transferred to cap tubes and the stereoisomers determined according to Jensen & Lauridsen (Reference Jensen and Lauridsen2007).
Response to immunization
All cows were injected subcutaneously with 1 mg each of human serum albumin (HSA; Sigma-Aldrich, lot no: 035K7566), ovalbumin (OVA; Sigma-Aldrich, lot no: 120K1201), equine serum albumin (EQSA; BIOWORLD, lot no:ESA62-887) and canine serum albumin (CSA; BIOWORLD, lot no:CASA62-1076) mixed each with Aluminum Hydroxide Gel Adjuvant (Brenntag Biosector, Alhydrogel, lot no: 4601) (1:4) in saline, 6 days before the start of the feeding experiment. Blood was collected from a vein at the tail into five EDTA-tubes from each cow, just before immunization and on day 24 of the first period. Two samples were spun on site and the supernatant plasma was taken and stored frozen at −20 °C for later analysis of α-tocopherol. Whole blood for serum collection was sampled at the same time. The serum samples were stored at −20 °C until assayed.
The production of antigen-specific antibodies to HAS, OVA, EQSA and CSA was assayed in blood samples in the beginning of the experiment and 24 days following immunization using an enzyme-linked immunosorbent assay (ELISA). Antigen (5 μg/ml) diluted in 0·05 m carbonate buffer, pH 9·6, was used for coating of polystyrene microtitre plates (Immunoplates II, Nalge Nunc International, Denmark) by adding 0·2 ml antigen to each well. The plates were sealed, incubated for 3 days at 4 °C and washed five times (Microwash II, Skatron, Norway) with phosphate-buffered saline (PBS) containing 0·05% Tween 20 (PBS-Tween). One percent skimmed milk (powder, Merck, Germany) in PBS-Tween, 0·2 ml/well, was used to prevent non-specific binding, and the plates were washed five times with PBS-Tween. All test samples were diluted at least 1:100 and further diluted twofold in PBS-Tween containing 1% bovine serum albumin (BSA), and 100 μl of the samples were placed in each well. The plates were sealed and incubated overnight at 4 °C. After incubation, the plates were washed again five times with PBS-Tween, and 100 μl of a 1:5000 dilution (in PBS-Tween with 1% rabbit serum) of a horseradish peroxidase-linked rabbit anti bovine IgG (Sigma, Lot no: 070M4857) was added to each well. The plates were then incubated for 1 h at 37 °C, and washed five times with PBS-Tween. Then 100 μl of the enzyme substrate, ABTS (2,2′-azinobis (3-ethyl-benzthia-zoline-sulfonic acid; Sigma-Aldrich, Lot no: 050M1502V)) was added to each well. The reaction was stopped after 45 min at 37 °C by adding 20 μl sodium azide (NaN3, 1 mg/ml) and measured immediately with a Titertek Multiskan Plus ELISA reader (Labsystems, Finland; wavelength 405 nm). The final titre was defined as the reciprocal (log2) of the highest dilution of serum showing positive reaction, i.e. at least 0·1 OD405 which exceeded by more than a factor of two of the average OD405 of the mean normal control samples in the same test plate.
Milk yield, milk and plasma sampling and chemical analysis
Cows were milked twice daily in a milking parlour, and the amount of milk was recorded automatically at each milking.
Aliquot milk samples were taken during the sampling period from morning and evening milk from each cow four times a week (Monday and Tuesday on each of the two milking times: morning and night). Milk samples intended for analysis of α-tocopherol concentration and FA composition were frozen (−20 °C) immediately. Milk samples intended for analysis of fat and protein were preserved with 2-bromo-2-nitropropane-1,3-diol (Bronopol, D&F Inc., Dublin, CA, USA) and analysed by a Fourier Transformed Infrared Spectroscopy milk analyser (MilkoScan 6000 FTIR, Foss, Hillerød, Denmark).
Before extraction of α-tocopherol, milk and plasma samples were thawed, and milk samples were heated at 40 °C for 20 min and mixed thoroughly prior to analysis. The extraction procedure was as follows: 1 ml of milk, or 500 μl of plasma, was diluted with 1·0 ml ascorbic acid solution (200 g/l), 0·5 ml methanol, 2·0 ml ethanol and 0·3 ml KOH-water (1:1 w/v). Saponification was carried out at 80 °C for 20 min. After cooling, tocopherol was extracted twice using 5 ml heptane per occasion. Stereoisomers of α-tocopherol in plasma and milk were determined as described for feed.
Statistical analysis
The data for feed intake, milk and plasma content of α-tocopherol were analysed using the PROC MIXED procedure of SAS (SAS for windows, version 9.2, SAS ltd Reference Weiss, Hogan and Wyatt2009.) with treatment, period and their interaction as fixed effects and square and cow within a square as random effects. The optimal covariance structure was modelled using an analysis of repeated measures specifying that measures taken on the same cow in subsequent periods are correlated. Satterthwaite's method was used for computing the denominator degrees of freedom.
Antibody titres to the immunization agents were transformed to reciprocal log2 units before statistical analysis. Analyses of variance of the response to immunization was performed on specific antibody levels (absorbance) and antibody titres using dietary treatment as fixed effect, the pre-immunization value as covariate and replicate and cow within a replicate as random effects.
Multiple mean comparison was made using Tukey Test at a significance level of 5%. While full P values are presented in the body of the text, only P values below 0·1 are presented in the tables, for clarity and judgment by the reader.
RESULTS
Feed chemical composition and dry matter intake
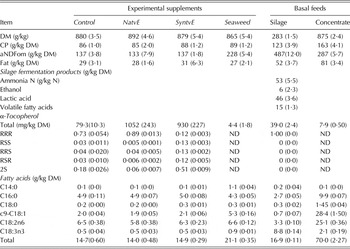
Chemical composition of the four experimental supplements and the basal feeds are presented in Table 2. Basal feeds (concentrate and silage) were similar for all treatment groups. The chemical composition of the experimental supplements was similar with respect to CP and fat content, but the seaweed supplement had 68 % higher aNDFom content than the other supplements. The concentration of α-tocopherol was 1052 and 993 mg/kg DM in the NatvE and SyntvE supplements, respectively, which was about 60–70 % less than originally planned, probably due to high temperature during the pelleting process of the supplements (Weiss, unpublished as reported in (NRC 2001)). The content of α-tocopherol in the control supplement was higher than expected and it contained also synthetic isomers, which was likely due to contamination from the production of feed previous to the production of the control (Dag Henning Edvardsen, Normin AS, pers. comm.).The silage was well fermented with low concentrations of volatile FA and low proportion of ammonia, and contained 39 mg α-tocopherol/kg DM.
Chemical composition of the four experimental supplements (no added vitamin E (Control), RRR-α-tocopheryl acetate (NatvE), all-rac-α-tocopheryl acetate (SyntvE) and Seaweed) and basal feeds (silage and concentrate), and proportions (of total) of α-tocopherol stereoisomers. Values in brackets are standard deviations (n = 4)

ND, not detectable.
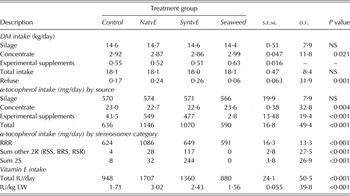
Dry matter intake (DMI, kg/day) is presented in Table 3. There was no difference in total daily DMI among treatment groups (mean ± s.e.: 18·1 ± 0·47). However, mean intake of concentrates did differ (P = 0·021) among the treatments due to refusals. Intake of experimental supplements differed among treatments according to design. As such, cows in the Seaweed group consumed more of the concentrates compared to the SyntvE group.
Daily DM and α-tocopherol intake by dairy cows in their mid-lactation fed one of the four different experimental supplements: no added vitamin E (Control), RRR-α-tocopheryl acetate (NatvE), all-rac-α-tocopheryl acetate (SyntvE) and Seaweed (n = 24)
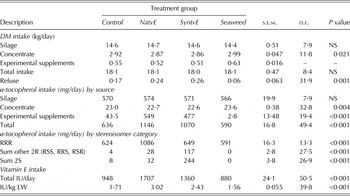
d.f., Satterthwaite's approximation for degrees of freedom. s.e.m., Standard error of the mean. NS, not significant; LW, live weight.
IU of vitamin E was calculated as 1·49 × mg of α-tocopherol from feedstuffs and for NatvE supplement and 1 × mg of α-tocopherol for the SyntvE supplement.
Milk yield and milk fat
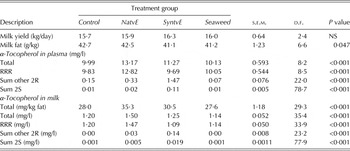
Average daily milk production among the treatment groups was not different from each other (Table 4). The control group had higher (P < 0·05) mean milk fat content (42·7 g/kg) than either the SyntvE (41·1 g/kg) or the Seaweed group (41·2 g/kg). Milk fat content from the NatvE treatment was intermediate and not significantly different from the other treatments.
Daily milk yield, milk fat content, milk and plasma α-tocopherol concentration in dairy cows in their mid-lactation (n = 24) fed daily supplements of no added vitamin E (Control), RRR-α-tocopheryl acetate (NatvE), all-rac-α-tocopheryl acetate (SyntvE) and Seaweed

d.f., Satterthwaite's approximation for degrees of freedom. s.e.m., Standard error of the mean. NS, not significant.
Alpha-tocopherol intake and its stereoisomers in feed, plasma and milk
Total mean daily α-tocopherol intake (g/day) was highest in the NatvE group (1146), intermediate in the SyntvE (1070) and lowest in the Control (636) and Seaweed (591) groups (Table 3). The latter two groups were not significantly different from each other. As expected, α-tocopherol intake from silage was similar among treatments while it was different among treatments based on concentrates source (P = 0·004) and based on the experimental supplements (P < 0·001) (Table 3).
At the stereoisomer level, the RRR intake was highest in the NatvE group, with intermediate and similar intake in the SyntvE and Control group, while the Seaweed group had the lowest calculated intake. Intake of the rest of the 2R stereoisomers (RRS, RSR and RSS) was also different (P < 0·001) among treatments: as such, dairy cows in the SyntvE group had the highest intake while cows in the NatvE group had intermediate and cows in the Control and Seaweed groups had the lowest intake (Table 3). Similarly, the 2S stereoisomer intake was highest (P < 0·001) in the SyntvE group being c. 0·23 of total α-tocopherol intake. The cows in the NatvE group had very low-level intake of 2S stereoisomer (~0·028 of total α-tocopherol intake) compared with the SyntvE group. The Control and Seaweed groups had, on average, the lowest intake of the 2S stereoisomers, which was <0·01 of their total α-tocopherol intake.
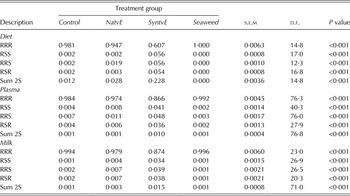
Compared with the combined mean of Control and Seaweed groups, cows in the NatvE and SyntvE groups had 31 and 12% more (P < 0·001) plasma α-tocopherol, respectively (Table 4). Plasma concentration of the natural RRR isomer was 30% higher in the NatvE fed cows than the average of the other treatments, whereas cows fed SyntvE had on average eight times higher plasma concentration of the synthetic isomers than cows on the other treatments. Almost all of the α-tocopherol in plasma was in the 2R stereoisomer form, and >0·86 of the total was the RRR isomers on all treatments (Table 5). Despite 0·23 of total α-tocopherol intake being 2S, only c. 0·01 was in the 2S form in the plasma of the SyntvE group. Cows in the Control, NatvE and Seaweed groups had plasma α-tocopherol stereoisomers from the synthetic derivative at very low yet measurable levels.
Relative proportions of α-tocopherol stereoisomers in the diets, plasma and milk samples from dairy cows in their mid-lactation fed on no added vitamin E (Control), RRR-α-tocopheryl acetate (NatvE), all-rac-α-tocopheryl acetate (SyntvE) and Seaweed

d.f., Satterthwaite's approximation for degrees of freedom. s.e.m., Standard error of the mean. NS, not significant.
Milk and milk fat α-tocopherol concentration was affected (P < 0·001) by the treatments (Table 4). Cows in the NatvE group had 25% higher milk α-tocopherol concentration than the Control, while the α-tocopherol content in milk from cows fed SyntvE and Seaweed did not differ significantly from that of the Control. As in plasma, >0·85 of the α-tocopherol of milk was in the form of RRR on SyntvE diet and this value was observed to be >0·97 on the other diets (Table 5).
Bioavailability of α-tocopherol and its stereoisomer ratios
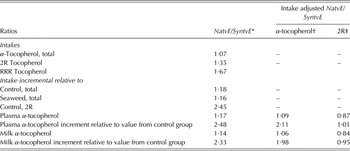
The concentration of α-tocopherol in plasma and milk in cows offered NatvE was only slightly greater (1·09 and 1·06 times, respectively) than for cows fed SyntvE when adjusted to account for the differences in α-tocopherol intake (Table 6). However, the increase in plasma and milk α-tocopherol concentration relative (adjusted) to the control treatment was approximately twice as high on NatvE than on SyntvE. The concentration of α-tocopherol in plasma and milk per unit of 2R α-tocopherol consumed in cows fed NatvE supplement was 0·87 and 0·84 times that of cows fed SyntvE and was approximately the same (≈1) when calculated as the relative increase from the cows fed the control diet.
Ratios of relative intakes of α-tocopherol and relative concentrations of α-tocopherol in plasma and milk from cows fed NatvE or SyntvE supplement

* NatvE/SyntvE ratio = mean intake, concentration and increments relative to control and seaweed for NatvE treatment divided by mean of SyntvE treatment (see Tables 3 and 4 for original data).
† [(α-tocopherol concentration in NatvE/α-tocopherol concentration in SyntvE treatment)/(α-tocopherol intake by NatvE/α-tocopherol intake by SyntvE treatment)].
‡ [(α-tocopherol concentration in NatvE/α-tocopherol concentration in SyntvE treatment)/(2R α-tocopherol intake by NatvE /2R α-tocopherol intake by SyntvE treatment)].
Antibody response to immunization
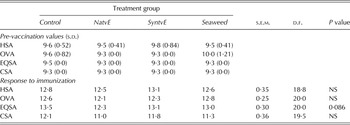
The summary of antibody titres (log2) is provided in Table 7. There was no effect of vitamin E supplementation on immunization response to the specific antigens with the exception of EQSA which showed a slight tendency (P = 0·088) to be lower under the NatvE group.
Antibody titers (log2) to human serum albumin (HSA), ovalbumin (OVA), equine serum albumin (EQSA) and canine serum albumin (CSA) from dairy cows (n = 6) fed on basal feeds of silage and concentrate, and supplemented with no added vitamin E (Control), RRR-α-tocopheryl acetate (NatvE), all-rac-α-tocopheryl acetate (SyntvE) and Seaweed

d.f., Satterthwaite's approximation for degrees of freedom. s.e.m., standard error of the mean. NS, not significant.
DISCUSSION
The present experiment was conducted to test the effects of feeding supplemental sources of vitamin E (RRR- α-tocopheryl acetate or all-rac-α-tocopheryl acetate) relative to Seaweed and Control diet on the vitamin E and its stereoisomers content of plasma and milk, and the adaptive immune response to immunization of mid-lactation dairy cows fed a basal feed of silage augmented with concentrates.
Plasma and milk α-tocopherol
The observed differences in α-tocopherol from concentrate intake were attributed to differences in the amount of concentrate DMI, whereas the difference from experimental supplements was due to the concentration of α-tocopherol in the supplements as designed. In addition to the SyntvE group, cows in the remaining three treatment groups yielded plasma and milk α-tocopherol stereoisomers of the SyntvE derivative at very low yet measurable levels. There are some possible reasons for this. Firstly, it could be due to the fact that a limited amount of the α-tocopherol stored in liver and other tissues from previous periods could be circulating at the background and hence available in the plasma and milk. A good example comes from the works of Weiser et al. (Reference Weiser, Riss and Kormann1996), where control rats fed a vitamin E free diet for 4 months (pre-experimental period) and devoid of α-tocopherol for an extra 90 days (experimental period) showed traceable levels of α-tocopherol in different tissues and plasma. Secondly, chemical analysis on the experimental supplements fed to the cows, except for the Seaweed one, showed traceable levels of stereoisomers of the SyntvE derivatives suggesting that there might have been cross-contamination while sampling or feeding. However, the levels were very small and would not have altered the outcome of the treatments and, hence, our hypotheses. That said, the present study confirms that natural α-tocopherol is the pre-dominating form in blood and milk of dairy cows, irrespective of dietary sources (Meglia et al. Reference Meglia, Jensen, Lauridsen and Waller2006; Weiss et al. Reference Weiss, Hogan and Wyatt2009). The observed pattern of mean plasma and milk α-tocopherol concentration in the present study was in agreement with previous reports (Meglia et al. Reference Meglia, Jensen, Lauridsen and Waller2006; Weiss et al. Reference Weiss, Hogan and Wyatt2009) where periparturient cows were fed either a control diet, supplemented with different forms of vitamin E and plasma concentration of α-tocopherol was measured. Indeed, in absolute terms, the values observed in the current paper are much higher than in previous works, but this was understandable considering the differences in terms of stage of lactation of the cows, type and quality of basal feed and also level of vitamin E supplementation.
Even though the intake of Vitamin E on the control diet was much lower than the recommended value, i.e. 2·6 IU/kg BW (NRC 2001) for late gestation and during lactation, the observed plasma α-tocopherol concentration is more than adequate. As such, the mean plasma α-tocopherol for control group (9·99 mg/l) was well above what is considered the minimum level (3–3·5 mg/l) to avoid health risks with periparturient dairy cows (Weiss et al. Reference Weiss, Hogan, Todhunter and Smith1997). Furthermore, the value is also far higher than that reported for Swedish Holstein dairy cows in their mid-lactation and fed on organic rations (Lindqvist et al. Reference Lindqvist, Nadeau, Persson Waller, Jensen and Johansson2011) and Norwegian dairy cows (6·9 mg/l) under winter feeding conditions (Sivertsen et al. Reference Sivertsen, Overnes, Osteras, Nymoen and Lunder2005). Concentrations were, as per the hypothesis, lowest for cows in the Control and Seaweed group, intermediate for cows supplemented with SyntvE, and highest for cows fed supplemented with NatvE. This followed the trends of the concentrations in the diet consumed by the respective group.
Concentrations of α-tocopherol in plasma, milk and milk fat were about 1·2 times higher in the group supplemented with NatvE than in the SyntvE (Table 6). This agrees well with previous work with periparturient dairy cows (Meglia et al. Reference Meglia, Jensen, Lauridsen and Waller2006) using different sources of vitamin E. The milk α-tocopherol concentration falls a bit short of the results from Weiss et al. (Reference Weiss, Hogan and Wyatt2009) where the relative concentration was reported to be 1·24–1·43 times higher for cows supplemented with NatvE than for SyntvE with periparturient dairy cows. This could be due mainly to the elevated intake of α-tocopherol from basal feeds (silage and concentrates), in light of the observed values for the control group, where additional supplementation would have yielded less of an effect because of saturation.
While comparing the Control group with the Seaweed group, these two groups showed similar values from total α-tocopherol intake to its concentration in plasma and milk. However, there are other things which have not been looked into; for example, the incidence of mastitis, long-term reproductive performance and milk iodine content. The latter, for example, was superior in seaweed meal fed group compared with standard mineral mixture fed Norwegian cows as reported by Jensen et al. (Reference Jensen, Nebb and Sæter1968).
Plasma and milk α-tocopherol stereoisomers
The stereoisomer composition in milk followed similar pattern to those observed in plasma within each treatment. This is in agreement with other works on dairy cows and suggests either lack of preferential uptake of stereoisomers by mammary cells once in the blood (Meglia et al. Reference Meglia, Jensen, Lauridsen and Waller2006) or the limited availability of these stereoisomers in blood plasma (Jensen & Lauridsen Reference Jensen and Lauridsen2007). Furthermore, in support of Meglia et al. (Reference Meglia, Jensen, Lauridsen and Waller2006) and Weiss et al. (Reference Weiss, Hogan and Wyatt2009), the bioavailability of the RRR-stereoisomer in the current study was greater compared with the other stereoisomer forms of α-tocopherol, irrespective of the source of supplementation, as indicated by the enrichment of the RRR stereoisomer in milk to >0·86 of the total concentration.
Among the cows supplemented with SyntvE the relative enrichment of stereoisomers in plasma and milk was such that >0·98 was in the 2R forms, while a very small proportion (c. 0·01–0·015) was in the 2S forms. Furthermore, within the 2R stereoisomers, the RRS, RSR and RSS stereoisomers were in a considerably lower concentration than the RRR form. The observed proportion of 2R v. 2S was a big contrast to the proportion of these stereoisomers (0·77 and 0·23, respectively) in the feed fed to the cows. With periparturient cows fed daily with 917 mg all-rac-α-tocopheryl acetate on top of the intake from basal ration (300–525 mg RRR-α-tocopherol), Meglia et al. (Reference Meglia, Jensen, Lauridsen and Waller2006) reported similar values. Likewise, Jensen et al. (Reference Jensen, Kristensen, Lauridsen, Sejersen, Schubert, Flachowsky, Jahreis and Bitsch2005) as described in Jensen & Lauridsen (Reference Jensen and Lauridsen2007), fed cows a daily dose of 3000 mg all-rac-α-tocopheryl acetate in addition to the 450 mg RRR-α-tocopherol occurring naturally in the basal ration for 16 days and reported comparable values in the plasma of cows. Furthermore, with sows fed on synthetic forms of vitamin E, Jensen & Lauridsen (Reference Jensen and Lauridsen2007) indicated that the 2R stereoisomers in total contributed c. 0·92–0·94 of the stereoisomers in milk whereas the 2S forms put together contributed the remaining small part (0·06–0·08). However, the same authors also reported differences in stereoisomer proportions in calf and lamb plasma compared with cows.
The preferential enrichment of the 2R form over the 2S form was suggested to be due to the action of hepatic α-tocopherol transport protein (α-TPP) that transfers liver α-tocopherol into plasma lipoproteins for extra-hepatic tissue delivery (Traber et al. Reference Traber, Frei and Beckman2008).
Responses to immunizations
Specific antibody titre values to immunization with EQSA antigen showed a tendency for dairy cows in the NatvE group to be lower compared to other groups. This was unexpected but at the level of α-tocopherol intake and its plasma concentration observed in the current experiment, it can only be speculated that this could have been due to increased level of α-tocopherol radicals (Rietjens et al. Reference Rietjens, Boersma, de Haan, Spenkelink, Awad, Cnubben, van Zanden, van der Woude, Alink and Koeman2002; Nwose et al. Reference Nwose, Jelinek, Richards and Kerr2008). Such was the case with increased mastitis incidence in dairy cows that alluded to the absence of balance between vitamin E and scavenging molecules for vitamin E radicals (Bouwstra et al. Reference Bouwstra, Nielen, Newbold, Jansen, Jelinek and van Werven2010a, Reference Bouwstra, Nielen, Stegeman, Dobbelaar, Newbold, Jansen and van Wervenb). In human subjects with diabetes, Nwose et al. (Reference Nwose, Jelinek, Richards and Kerr2008) cautioned that vitamin E supplementation should be justified when the vitamin E regeneration system, which is responsible for balancing the outcome, is adequate. Rietjens et al. (Reference Rietjens, Boersma, de Haan, Spenkelink, Awad, Cnubben, van Zanden, van der Woude, Alink and Koeman2002) suggest that supplementation with vitamin E may not always exert the protective effect aimed for, as the effects may depend on the subtle redox equilibrium within the cells and the balance within the complete cellular antioxidant network.
The lack of anticpated difference of the effect of supplementation with seaweed on antibody titres warrants further investigation. However, a progression of the specific antibody development has been observed in each group from pre-immunization values, as anticipated. The clear and elevetaed response to immunization suggests that the animals were at least not immunocompromised.
CONCLUSIONS
As hypothesized, supplementation of dairy cows with vitamin E, regardless of its form, increased total plasma and milk α-tocopherol compared to non-supplemented cows. This increment was bigger with NatvE than SyntvE supplementation. The lack of effects of vitamin E supplementation to elicit adaptive immune response against immunizations could be due to the fact that intake of vitamin E from the basal diets was not limiting. Therefore, based on our observation, it can be concluded that with good quality silage the need for supplemental vitamin E is not critical even during the winter period with mid-lactation dairy cows.
We acknowledge the great help from the staff at the Agricultural Production Experimental Centre, Norwegian University of Life Sciences. We thank Elisabeth Furuseth Hansen and Grethe Marie Johansen at the Norwegian University of Life Science, Oslo, Norway for performing the laboratory analysis of the immunological parameters. We are grateful to Kristin Sørheim and Prof Knut Hove for taking the blood samples. We thank TINE SA for financial support of Ingvild Luteberget Nesheim's MSc work. Funding from The Foundation for Research Levy on Agricultural Products, the Agricultural Agreement Research Fund and the Research Council of Norway is much appreciated (Project number 190301/I10). The authors have no financial or other conflict of interest in the manuscript.