



1. Introduction
The stability of liquid films on horizontally oscillating substrates has been widely used in various engineering and technical fields, including semiconductor coating (Weinstein & Ruschak Reference Weinstein and Ruschak2004), material processing and spray atomisation, and it is also of considerable theoretical significance. In particular, the unique mechanical properties of viscoelastic fluids have attracted extensive attention to their instabilities across a wide range of applications, including lubrication, various polymer processing operations and cardiovascular disease fields (Larson Reference Larson1992; Shaqfeh Reference Shaqfeh1996; Grotberg & Jensen Reference Grotberg and Jensen2004). Compared with the classical stability problem based on a steady base flow, the time-dependent base flow introduces additional dynamic responses, so that the instability mechanism of the liquid film significantly can differ substantially from that in the corresponding steady basic flow situation. In practical processes, this may directly affect flow control and product quality. Moreover, the memory effect and relaxation properties of viscoelastic fluids may interact with the imposed oscillation conditions in a complicated manner, potentially leading to new instability modes or variations in the instability threshold.
The stability of a Newtonian liquid film on a horizontal oscillating plane is a classical subject, and in most of the early studies the imposed vibration was typically simplified as a single-frequency oscillation. The seminal work of Yih (Reference Yih1968) examined the flow stability of Newtonian fluid film on a horizontal single-frequency oscillating flat plate, aiming to investigate the influence of unsteady basic flow on long-wave modes. Based on the Floquet theory and the asymptotic expansion method to solve the time-dependent Orr–Sommerfeld equation, it is found that the stable and unstable intervals of the long-wave mode appear alternately with the increase of the oscillation frequency under the condition of no gravity. When the influence of gravity is considered, the long-wave mode instability occurs for a sufficiently large amplitude of modulation. After that, Or (Reference Or1997) conducted a more comprehensive numerical study on this problem and solved the time-dependent Orr–Sommerfeld equation by the Chebyshev tau method to analyse the finite-wavelength instabilities induced by small-amplitude disturbances under arbitrary wavenumbers. Or determined the variation of the critical amplitude for finite-wavelength instability as a function of oscillation frequency, thereby completing the mapping of the neutral stability curves over the entire parameter space. The results showed that the neutral stability curve of long-wave instability exhibits a characteristic U-shape, while the monotonic neutral curves related to finite-wavelength instability originate from bifurcation points identified along the long-wave neutral boundaries. In addition, Benilov & Chugunova (Reference Benilov and Chugunova2010) investigated the stability of frozen waves in liquid films on a single-frequency oscillating plate and found that both periodic and solitary waves are always linearly unstable regardless of the parameter values. For an inclined oscillating plate, Woods & Lin (Reference Woods and Lin1995) studied the instability of a Newtonian liquid film under arbitrary wavenumbers numerically and identified three types of instabilities: gravity instability, harmonic instability and subharmonic instability. Their study revealed that oscillations perpendicular to the wall suppress the gravity instability but enhance the harmonic and subharmonic instability. Samanta (Reference Samanta2021) further investigated the effect of applied shear stress on the resonant-wave instability by solving the linear stability of a shear-driven Newtonian fluid, and they also aimed at perturbations of arbitrary wavenumbers.
In practical engineering contexts, however, liquid films are subjected not to a single periodic oscillation but to non-periodic or multi-frequency excitation. Under such conditions, the single-frequency oscillation approximation is not always adequate to accurately describe the real dynamic behaviour of the liquid film. Recent studies have therefore introduced an additional independent oscillatory mode into the oscillation model, forming a dual-frequency excitation model including two fundamental frequencies and their corresponding amplitudes. When the ratio of the two frequencies is irrational, the two main frequencies are independent of each other and constitute a quasi-periodic oscillation. This oscillation model can more realistically reflect the complex excitation environment in actual engineering. Yuan & Wang (Reference Yuan and Wang2019), for example, experimentally studied the evolution of vortex ripples under the action of full-scale acceleration-skewed oscillation by introducing oscillating flows of two frequencies, thereby modelling sediment transport processes in coastal hydrodynamics. In order to analyse the linear stability of the flow caused by the acceleration-skewed oscillating wall, Thomas (Reference Thomas2020) introduced the oscillating flow of multiple frequencies to construct the acceleration-skewed model, and the results displayed that the acceleration skew had a destabilising effect. More recently, Jaouahiry & Aniss (Reference Jaouahiry and Aniss2025) further investigated the stability of liquid film under the superposition of two periodic oscillations with different ratios of frequencies and amplitudes. By combining long-wave asymptotic expansion and the Chebyshev numerical method, the long-wave instability and finite-wavelength instability were discussed. The results demonstrated that, compared with the classical single-frequency oscillation case, the quasi-periodic oscillation model significantly modifies the instability boundaries of the liquid film, and a new instability mechanism appears. In practice, such quasi-periodic oscillation can be generated by superposing two independently controlled harmonic excitations, for example through two input signals driving the same oscillating substrate. From an operational point of view, quasi-periodic motion can be realised by choosing two frequencies whose ratio is incommensurate, or, in practice, sufficiently far from low-order rational ratios, so that no common period is observed within the experimental time window. This provides a practical route for the laboratory generation of quasi-periodic substrate oscillations.
On the other hand, surface tension plays a critical role in controlling the stability of free-surface flows. Among the available control methods, modifying the surface tension by adding surfactants, thereby altering the transition process to surface-induced instability (Sarpkaya Reference Sarpkaya1996; Shen et al. Reference Shen, Yue and Triantafyllou2004; Hu et al. Reference Hu, Fu and Yang2020), is an effective approach. Early work by Wei (Reference Wei2005) studied a shear-driven liquid film containing insoluble surfactants on an inclined plane, and the stability problem was solved by the asymptotic expansion method under the long-wave assumption. It was found that the presence of insoluble surfactants would lead to flow instability. Subsequently, Gao & Lu (Reference Gao and Lu2006) discussed the effect of surfactants on the long-wave stability of a horizontal single-frequency oscillating liquid film and pointed out that insoluble surfactants have a stabilising effect on the oscillating liquid film. Based on this, Gao & Lu (Reference Gao and Lu2008) further expanded the problem and discussed the effect of surfactant concentration on the finite-wavelength instability of the oscillating liquid film. The results revealed that the presence of surfactants may either stabilise or destabilise the finite-wavelength instability of the flow depending on the strength of the surface elasticity. Furthermore, two-fluid film flow on an inclined plane under the influence of surfactants was investigated by Gao & Lu (Reference Gao and Lu2007), revealing that the inertialess instability of relatively long waves can be substantially suppressed by surface surfactants. As the research system becomes more complex, Thompson & Blyth (Reference Thompson and Blyth2016) considered the Stokes flow in three-layer thin films and found that adding surfactants to one of the film surfaces can destabilise the flow. Wang et al. (Reference Wang, Huang, Gao and Lu2021) examined the effect of surfactants under the horizontal double-layer oscillating liquid film. The results show that the surfactants have a stabilising effect on the double-layer liquid film, while the surfactants between the fluid layers exert both stabilising and destabilising influences. Most recently, Jia et al. (Reference Jia, Xiao, Wang, Zhao and Xue2026) analysed the effect of insoluble surfactants on the stability of liquid film flowing horizontally under quasi-periodic amplitude modulation. Their results showed that increasing surfactant concentration significantly expands the region of finite-wavelength instability, and the transition intersection of the travelling- to the standing-wave mode gradually shifts toward lower frequencies. The above results highlight that the existence of insoluble surfactants may have a stabilising or destabilising effect on the flow stability.
Most of the studies reviewed above concern Newtonian fluids. By contrast, the instability of viscoelastic fluids on oscillating planes has also attracted considerable attention due to its importance in engineering applications. Dandapat & Gupta (Reference Dandapat and Gupta1975) carried out an early long-wave analysis for a non-Newtonian liquid film on a horizontally oscillating plane and showed that the elastic parameters of the fluid play a destabilising and stabilising role depending on the oscillation frequency. Subsequently, Samanta (Reference Samanta2017) extended the investigation to arbitrary wavenumber perturbations, examining the linear stability of a viscoelastic fluid over a horizontally, single-frequency oscillating plane. It was found that long-wave instability occurs only within a specific separated frequency bandwidth, and an increase in the viscoelastic parameter destabilises finite-wavelength perturbations. Du et al. (Reference Du, Xiao, Wang, Li and Zhao2024) discussed the effects of viscoelasticity and oscillation amplitude on the long-wave and finite-wavelength instability of weakly viscoelastic fluids on an inclined oscillating plane. The results showed that, as the viscoelasticity increases, the gravity instability boundaries shift toward higher wavenumbers, and the critical amplitudes of subharmonic and harmonic instabilities decrease. In recent years, the combined effect of non-Newtonian fluids and surfactants on flow stability has gradually attracted attention. Early studies in this direction were mostly restricted to steady base flows. For instance, Zhou et al. (Reference Zhou, Peng, Zhang and Zhuge2014) investigated the instability characteristics of a viscoelastic liquid film with surfactant coating the inner wall of a tube. Through normal-mode analysis and long-wave approximation, they found that surfactants enhance the viscoelastic effect under a steady base flow. Pal & Samanta (Reference Pal and Samanta2021) considered the linear stability of a surfactant-laden viscoelastic liquid film flowing down an inclined plane under slip boundary conditions, which is again a steady base-flow problem. Their results demonstrated a dual effect of the viscoelastic parameters on instability. Recently, Wang et al. (Reference Wang, Du, Xiao and Zhao2023) further extended the problem to the case of an unsteady base flow and analysed the linear stability of viscoelastic liquid film with surfactant on the horizontal single-frequency oscillating plane. Floquet theory was employed to describe the coupled effects of viscoelasticity and surfactant on instability. The long-wave results revealed that viscoelasticity shifts the stability boundaries to the low-frequency region in the absence of gravity, and the finite-wavelength results indicated that viscoelasticity significantly destabilises the flow under high-frequency oscillation.
Based on the existing studies, which have primarily concentrated on the stability analysis of liquid film under the single-frequency oscillation model, this paper introduces the quasi-periodic oscillation model that more realistically reflects engineering conditions. Specifically, we investigate the linear stability of a viscoelastic liquid film containing insoluble surfactant under quasi-periodic oscillation, with the aim of clarifying the coupled influence of quasi-periodic oscillation and viscoelasticity on film stability in the presence of surfactant. In this paper, we restrict our attention to the addition of a second oscillatory mode whose frequency is incommensurate with that of the first mode, so that the wall motion is characterised by quasi-periodic oscillation rather than single-frequency oscillation. A different physical configuration and analysis method are formed by imposing quasi-periodic oscillation in the boundary conditions of the horizontal wall. This modification of boundary conditions allows us to explore the new stability characteristics of the free-surface viscoelastic liquid films subjected to oscillatory forcing. The main purpose of this paper is therefore to investigate the linear stability of a single-layer viscoelastic liquid film flow driven by a quasi-periodic oscillating plate in the presence of surfactants, focusing on both long-wave and finite-wavelength disturbances. The innovation of this study is that the effects of quasi-periodic oscillation and viscoelasticity on the time-dependent quasi-periodic oscillatory flow with surfactant are considered comprehensively for the first time. The remainder of this investigation is outlined as follows. § 2 formulates the governing equations for the flow system. The analysis and results of long-wave instability are presented in § 3. § 4 outlines the numerical procedure for solving the time-dependent Orr–Sommerfeld equation. § 5 formulates the results of finite-wavelength instability. Finally, the main conclusions of the study are summarised in § 6.
Schematic of the flow configuration. Here
 $\eta ^{*}$
denotes the free-surface position and
 $g$
the gravitational acceleration.

2. Mathematical formulation
2.1. Flow configuration
We consider an incompressible viscoelastic fluid film of density
 $\rho$
and dynamic viscosity
 $\mu$
flowing on an infinite flat plate. A Cartesian coordinate system
 $(x^{*},y^{*} )$
is introduced, as shown in figure 1, with the
 $x^{*}$
-axis aligned with the plate, where the dimensional variables are indicated by an asterisk. The plate oscillates in the
 $x^{*}$
-direction with its velocity magnitude given by
 \begin{equation} U_{p}^{*} \big(t^{*} \big) =U_{1}\cos \big(\omega _{1} t^{*}\big)+U_{2}\cos \big(\omega _{2} t^{*}\big), \end{equation}
where
 $U_{1}$
and
 $U_{2}$
are the superimposed constant velocity amplitudes, and
 $\omega _{1}$
and
 $\omega _{2}$
are considered two incommensurable frequencies. Two separate modes that contain no phase shifts are superimposed into the oscillation, and each mode has its own frequency and amplitude. The undisturbed configuration corresponds to a film thickness of
 $d$
. The upper free surface of the film is described by
 $y^{*}=\eta ^{*}(x^{*},t^{*})$
, and is covered by a monolayer of insoluble surfactant. We note
 ${\boldsymbol{V}}^{*}=(U^{*},V^{*})$
, where
 ${\boldsymbol{V}}^{*}$
is the velocity field, and
 $U^{*}$
and
 $V^{*}$
are the velocity components in the streamwise and vertical directions. For the two-dimensional stability problem, the surfactant concentration
 ${\varGamma }^{*}(x^{*},t^{*})$
obeys the transport equation (Halpern & Frenkel Reference Halpern and Frenkel2003)
 \begin{equation} \frac {\partial \left (H {\varGamma }^{*} \right ) }{\partial t^{*} } +\frac {\partial }{\partial x^{*} } \left (H{\varGamma }^{*} U^{*} \right )=D_{s}\frac {\partial }{\partial x^{*} }\Biggl (\frac {1}{H}\frac {\partial {\varGamma }^{*}}{\partial x^{*} } \Biggr ), \end{equation}
where
 $H=\sqrt {1+ ({\partial \eta ^{*} }/{\partial x^{*} } )^{2} }$
is the curvature parameter associated with the free upper surface of the fluid film. Here,
 $D_{s}$
is the diffusivity of the surfactant, which is usually negligible and is ignored below. In the present study, we restrict our attention to an insoluble surfactant with negligible surface diffusion and a linear relation between surface tension and concentration. These assumptions provide a standard small-disturbance framework in the linear stability problem. Under the assumption of small-amplitude surface disturbances, the precise nature of the dependence of surface tension
 $\sigma ^{*}$
and the surfactant concentration
 ${\varGamma }^{*}(x^{*},t^{*})$
is a linear relation
 \begin{equation} \sigma ^{*}=\sigma _{0}-E\left ({\varGamma } ^{*} -{\varGamma }_{0} \right ) \!, \end{equation}
where
 $E$
is the surface elasticity, and
 ${\varGamma }_{0}$
denotes the basic value of the surfactant concentration, associated with a uniform surface tension
 $\sigma _{0}$
.
The system of the governing equations is given by the following momentum and continuity equations in tensor form:
 \begin{equation} \partial _{i} U^*_{i} = 0, \end{equation}
 \begin{equation} \rho \big (\partial _{t^*} U^*_{i}+U^*_{\!j} \partial _{\!j} U^*_{i}\big ) = \rho g_{i}+\partial _{\!j} \tau ^*_{ij}. \end{equation}
Here,
 $\tau ^{*}_{ij}$
is the stress tensor, with the subscripts
 $i,j$
implying summation over the
 $x^{*}$
- and
 $y^{*}$
-directions. The fluid rheological model is described by Walter’s liquid
 $B''$
, a viscoelastic model representing a first-order elastic approximation of Newtonian behaviour and a rapidly fading memory. The constitutive equation of liquid
 $B''$
is (Beard & Walters Reference Beard and Walters1964; Andersson & Dahl Reference Andersson and Dahl1999)
 \begin{equation} \tau ^*_{i j} = -P^*\delta _{i j} + 2\mu e^*_{ij}-2M_0\dfrac {\delta }{\delta t^*}e^*_{ij}, \end{equation}
where
 $P^*$
is the isotropic pressure,
 $\delta _{i j}$
is the Kronecker symbol,
 $e^*_{ij}=(\partial _{i}U^*_j + \partial _j U^*_i)/2$
is the strain rate tensor,
 $2\mu e^*_{ij}$
is the Newtonian stress,
 $2M_0(\delta /\delta {t^*})e^*_{i j}$
is the elastic stress contribution and
 $M_0$
is the viscoelastic coefficient. The co-rotational derivative of the strain rate tensor
 $e^*_{ij}$
is defined as (Shrestha Reference Shrestha1970; Samanta Reference Samanta2017)
 \begin{equation} \dfrac {\delta }{\delta {t^*}} e^*_{ij}=\partial _{t^*} e^*_{ij}+U^*_k \partial _k e^*_{ij}- \partial _k U^*_j e^*_{ik}-\partial _k U^*_i e^*_{kj}. \end{equation}
Obviously, the constitutive equation of liquid
 $B''$
recovers the Newtonian behaviour when the viscoelastic coefficient
 $M_0$
is set to zero.
This study employs standard boundary conditions for a free-surface liquid film with insoluble surfactant driven by an oscillating flat plate. At the oscillating substrate, the no-slip and no-penetration conditions are imposed, so that the velocity in the
 $x^{*}$
-direction matches the given plate velocity (2.1). At the free surface, the kinematic condition requires that the normal velocity at the interface is equal to the normal velocity of the film at the interface. The dynamic conditions consist of the tangential stress balance condition, in which the interfacial viscoelastic stress is balanced by the Marangoni stress induced by surfactant concentration gradients, and the normal stress balance condition, in which the normal stress discontinuity is balanced by capillary pressure. Thus, the corresponding boundary conditions are
-
(i) At the bottom of the liquid film
 $y^*=-d$
(2.8)
\begin{equation} U^*=U^{*}_{p}(t^{*}), \quad V^*=0. \end{equation}
-
(ii) The kinematic boundary condition at the free surface
(2.9)
\begin{equation} \partial _{t^*}\eta ^* = V^* - U^* \partial _{x^*}\eta ^*. \end{equation}
-
(iii) The normal and tangential stresses at the free surface
(2.10a)
\begin{align} -\big (1+\big (\partial _{x^*}\eta ^*\big )^{2}\big )P^{*}+2\mu \big [\big (\partial _{x^*}\eta ^*\big )^{2}\partial _{x^*}U^* -\partial _{x^*}\eta ^*(\partial _{y^*}U^*+\partial &_{x^*}V^*)+\partial _{y^*}V^*\big]\notag \\ -2M_{0}\biggl [\frac {\delta e_{xx}^{*}}{\delta t^{*}}(\partial _{x^*}\eta ^*)^{2}-2\frac {\delta e_{xy}^{*}}{\delta t^{*}}\partial _{x^*}\eta ^*+&\frac {\delta e_{yy}^{*}}{\delta t^{*}} \biggr ]=\frac {\sigma ^{*}\partial _{x^*x^*}\eta ^*}{\sqrt {1+\left (\partial _{x^*}\eta ^*\right )^{2}} }, \end{align}
(2.10b)where
\begin{align} \mu \big [\big (1-\big (\partial _{x^*}\eta ^*\big )^{2}\big )\big (\partial _{y^*}U^* +\partial _{x^*}V^* \big) + 2\partial _{x^*}\eta ^*\big (\partial _{y^*}V^*-\partial _{x^*}U^*\big )&\big ] +2M_{0}\biggl (\frac {\delta e_{xx}^{*}}{\delta t^{*}}\partial _{x^*}\eta ^* \notag \\ +\frac {\delta e_{xy}^{*}}{\delta t^{*}} \big (\big (\partial _{x^*}\eta ^*\big )^{2}-1\big )-\frac {\delta e_{yy}^{*}}{\delta t^{*}}\partial _{x^*}\eta ^* \biggr ) &=\partial _{x^*}\sigma ^*\sqrt {1+\left (\partial _{x^*}\eta ^*\right )^{2}} , \end{align}
$\sigma ^*$
is the surface tension.


To non-dimensionalise the governing equations and boundary conditions, we introduce the following dimensionless variables, and we choose the parameters of the first modes as the characteristic scales. The mean thickness of the liquid film
 $d$
is selected as the characteristic length scale,
 $\nu /d$
as the velocity scale,
 $\omega _{1}^{-1}$
as the time scale and
 $\rho \nu ^{2}/d^{2}$
as the pressure scale. The surfactant concentration and surface tension are normalised by
 ${\varGamma }_{0}$
and
 $\sigma _{0}$
.
Then, a set of dimensionless parameters is obtained as follows:
 \begin{align} \textrm{Re}=\frac {U_{1}d}{\nu }, \qquad \chi =\frac {gd^{3}}{2\nu ^{2}}, \qquad \beta =&\sqrt {\frac {\omega _{1}d^{2}}{2\nu }},\qquad \textit{Ca}=\frac {\rho \nu ^{2}}{\sigma _{0}d}, \qquad \textit{Ma}=\frac {E{\varGamma }_{0}}{\sigma _{0}},\notag \\ M=\frac {M_{0}}{\rho d^{2}}, \qquad M_{s}=&\frac {E{\varGamma }_{0}}{\rho U_{1}^{2}d}, \qquad \omega =\frac {\omega _{2}}{\omega _{1}},\qquad \gamma =\frac {U_{2}}{U_{1}}. \end{align}
Here,
 $\nu =\mu /\rho$
denotes the kinematic viscosity. The Reynolds number
 $\textrm{Re}$
quantifies the ratio of the inertial effect, due to the oscillation amplitude
 $U_{1}$
, to the viscous effect, while the Galileo number
 $\chi$
measures the ratio of the gravitational effect to the viscous effect;
 $\beta$
is the Womersley number, which is the dimensionless frequency parameter representing the ratio of the average film thickness to the thickness of the Stokes layer induced by the wall oscillation, and it is also interpreted as a measure of the relative oscillation frequency
 $\omega _{1}$
. The capillary number
 $\textit{Ca}$
characterises the ratio of the viscous force to the surface-tension force, whereas the Marangoni number
 $\textit{Ma}$
interprets the ratio of the surface-tension gradient force to the viscous force. The viscoelastic parameter
 $M$
accounts for the effect of the viscoelasticity, and
 $M_{s}$
here is introduced to quantify the influence of surface surfactant. Finally,
 $\gamma =U_{2}/U_{1}$
denotes the ratio of superimposed velocity amplitudes, and
 $\omega = \omega _{2}/\omega _{1}$
is the frequency ratio considered irrational. These two parameters play a central role in the description of quasi-periodic oscillations considered in this paper. The present parameters describe a class of thin-film configurations relevant to applications such as coating flows, thin polymer layers and related films with surfactants. For illustration, if one considers a representative film thickness
 $d \sim 5\times 10^{-4}\rm\,m$
and a kinematic viscosity
 $\nu \sim 10^{-6}\,\rm m^{2}\,s^{-1}$
, then the range
 $\beta =O(1-10)$
corresponds to oscillation frequencies
 $\omega _{1}=2\nu \beta ^{2}/d^{2}$
of approximately
 $8-800\,\rm s^{-1}$
, which lie within a laboratory-accessible range for oscillatory thin-film experiments. The relatively small values of
 $M$
considered are also consistent with the weakly viscoelastic regime appropriate to Walter’s liquid
 $B''$
.
The basic state corresponds to a plane interface flow with a unidirectional velocity parallel to the
 $x$
axis, and
 ${\boldsymbol{V}} _{b}=(U_{b}(y,t),\ 0)$
. The base state is associated with a zero mean pressure gradient, so that the characteristic pressure is fixed by the perturbation problem. By the method of separation of variables, we obtain the dimensionless form of the basic velocity profile
 \begin{equation} U_{b}={\rm Re} \left [ \frac {{\rm Re}\cosh [\varOmega _{1}(1+\mathrm{i}S_{1})y]}{\cosh [\varOmega _{1}(1+\mathrm{i}S_{1})]}\mathrm{e}^{{i}t} +\gamma \frac {{\rm Re}\cosh [\varOmega _{2}(1+\mathrm{i}S_{2})y]}{\cosh [\varOmega _{2}(1+\mathrm{i}S_{2})]}\mathrm{e}^{{i}\omega t} \right ]\!, \end{equation}
with
 \begin{equation} S_{1}=(1+4M^2\beta ^4)^{1/2}+2M\beta ^2, \qquad \varOmega _{1}=\beta \sqrt { \frac { (1+4M^2\beta ^4)^{1/2} -2M\beta ^2}{1+4M^2\beta ^4} }, \end{equation}
 \begin{align} S_{2}=(1+4M^2 \omega ^{2} \beta ^4)^{1/2}+2M\omega \beta ^2, \qquad \varOmega _{2}=\beta \sqrt {\omega } \sqrt { \frac { (1+4M^2\omega ^{2}\beta ^4)^{1/2} -2M\omega \beta ^2}{1+4M^2\omega ^{2}\beta ^4} }, \end{align}
where
 $-1 \leqslant y\leqslant 0$
. Here,
 $\mathrm{Re}[\boldsymbol{\cdot }]$
represents the real part of that complex function. The pressure is induced by gravity
 \begin{equation} \bar {P}\left (y\right ) =P_{0}-2\chi y. \end{equation}
Four parameters are involved in the expression of the base-flow profile: the ratio of the velocity amplitudes
 $\gamma$
, the frequency ratio
 $\omega$
, the viscoelastic parameter
 $M$
and the parameter
 $\beta$
. Notably, the absence of
 $\textit{Ma}$
in the expression for the basic state velocity
 $U_{b}$
indicates the fact that the base flow is unaffected by surfactants. This results from the assumption of a spatially uniform initial surfactant distribution along the interface. Under this assumption, no surfactant concentration gradients are generated in the base state, and consequently no Marangoni stresses arise to modify the flow field. Moreover, in the absence of the viscoelastic parameter (
 $M=0$
), the base-flow velocity (2.12) is identical to that of Jia et al. (Reference Jia, Xiao, Wang, Zhao and Xue2026)
2.2. Linear stability problem
In order to study the linear stability of the base flow, it is assumed that the disturbances are infinitesimal on the fundamental flow by introducing the following variables:
 \begin{equation} U=U_{b}+u',\qquad V=v', \qquad P=\bar {P}+p', \qquad \varGamma =1+\varGamma ', \qquad \sigma =1+\sigma '. \end{equation}
Here,
 $(u',v')$
are the components of the velocity disturbance in the Cartesian coordinates
 $ (x,y )$
,
 $p'$
and
 $\eta '$
designate pressure and interfacial disturbances and
 ${\varGamma }'$
and
 $\sigma '$
designate surfactant concentration and surface-tension disturbances, respectively.
Since only two-dimensional perturbations are considered, the continuity equation (2.4) is automatically satisfied by introducing a perturbed streamfunction
 $\psi ' (x,y )$
, such that
 \begin{equation} u'=\partial _{y}\psi ',\quad v'=-\partial _{x}\psi '. \end{equation}
Since the base flow is homogeneous in the
 $x$
-direction, perturbations of the streamfunction
 $\psi '$
, surfactant concentration
 ${\varGamma }'$
and interface
 $\eta '$
are expressed in normal modes, i.e.
 \begin{equation} \left (\psi ',\ {\varGamma }',\ \eta '\right )=\left (\phi \left (y,t\right ),\ \xi \left (t\right ),\ h\left (t\right )\right )\mathrm{e}^{{i}kx}, \end{equation}
where
 $\phi(y,t)$
,
 $\xi(t)$
and
 $h(t)$
are the normal-mode amplitudes of the streamfunction, surfactant concentration and interfacial disturbances, respectively, and
 $k\in \mathbb{R}$
is the wavenumber in the streamwise direction. It is worth noting that the perturbation pressure
 $p'$
can be eliminated by an appropriate combination of the Navier–Stokes equations and therefore does not enter the linearised system explicitly. Substituting (2.18) into the governing equations and retaining only linear terms, the resulting formulation reduces to a time-dependent Orr–Sommerfeld equation
 \begin{align} 2 {\beta} ^{2}(\mathscr{L}+M \mathscr{L}^{2}) \partial _{t}\phi =\mathscr{L}^{2} \phi -\mathrm{i} k[U_{b}(\mathscr{L}+M \mathscr{L}^{2})-(\mathscr{D}^{2} U_{b}+M \mathscr{D}^{4} U_{b})] \phi , \end{align}
with differential operators
 $\mathscr{D}=\partial _{y}$
and
 $\mathscr{L}=\mathscr{D}^{2}-k^{2}$
. Substituting the normal modes (2.18) and linearising, the boundary conditions at the wall
 $y=-1$
are
 \begin{equation} \phi =\mathscr{D}\phi =0, \end{equation}
which represent the linearised no-slip and no-penetration conditions. At the free surface
 $y=0$
, the linearised system contains the kinematic condition, the surfactant transport equation for the concentration disturbance and the linearised tangential and normal stresses conditions. These four conditions provide the closure required for the time-dependent Orr–Sommerfeld problem.
The linearised kinematic boundary condition and transport equation for surfactant at
 $y=0$
are expressed by
 \begin{align} &2\beta ^{2} \partial _{t}h+\mathrm{i} k U_{b} h+\mathrm{i}k\phi =0, \end{align}
 \begin{align} &2\beta ^{2} \partial _{t}\xi +\mathrm{i} k U_{b} \xi +\mathrm{i}k \mathscr{D} \phi =0. \end{align}
The linearised conditions for the normal and tangential stresses at
 $y=0$
are given by
 \begin{align} 2 \beta ^{2}[\mathscr{D}+M(\mathscr{L}-2 k^{2}) \mathscr{D}] \partial _{t}\phi &=-\mathrm{i} k[U_{b} \{\mathscr{D}+M(\mathscr{L}-2 k^{2}) \mathscr{D} \} \notag \\+M(\mathscr{D}^{2} U_{b} \mathscr{D}-\mathscr{D}^{3} U_{b})]& \phi +(\mathscr{L}-2 k^{2}) \mathscr{D} \phi -2 \mathrm{i} k\left (\chi +\frac {k^{2}}{2 \textit{Ca}}\right ) h, \end{align}
 \begin{align} 2 \beta ^{2} M(\mathscr{L}+2 k^{2}) \partial _{t}\phi =(\mathscr{L}+2 &k^{2}) \phi - \mathrm{i}k M [U_{b}(\mathscr{L}+2 k^{2})-\mathscr{D}^{2} U_{b}] \phi \notag \\ +[&\mathscr{D}^{2} U_{b}-2 \beta ^{2} M \mathscr{D}^{2} \partial _{t}U_{b}]h + M_s {\textrm{Re}}^2 \mathrm{i}k\xi . \end{align}
The time-dependent Orr–Sommerfeld equation (2.19) subject to conditions (2.20)–(2.24) forms a Floquet system. For finite-wavelength instabilities, the differential system should be solved numerically, whereas for the long-wave instabilities, analytical solutions can be obtained through an expansion in the wavenumber
 $k$
, as discussed in the following section.
3. The long-wavelength expansion
Although the Floquet theory provides an effective framework for the stability of linear differential systems with periodically varying coefficients, it is no longer applicable in the presence of systems characterised by two incommensurable frequencies,
 $\omega _{1}$
and
 $\omega _{2}$
. To overcome this difficulty, we follow Jaouahiry & Aniss (Reference Jaouahiry and Aniss2025) and replace the irrational ratio
 $\omega$
by a rational approximation
 $p/q$
, where
 $p$
and
 $q$
are coprime integers. For this approximation, the wall oscillation becomes periodic with period
 $2\pi q$
in the original time variable
 $t$
. Equivalently, after introducing the rescaled time
 $\tau =t/q$
, the coefficients become
 $2\pi$
-periodic in
 $\tau$
, so that the Floquet framework becomes applicable. We introduce the following variable changes:
 \begin{equation} \omega =\frac {p}{q} ,\quad \tau =\frac {t}{q} ,\quad \frac {\partial }{\partial t} =\frac {1}{q} \frac {\partial }{\partial \tau }. \end{equation}
Accordingly, for the purpose of the Floquet analysis, the irrational frequency ratio is replaced by a rational approximant
 $p/q$
, so that the resulting system becomes periodic in the rescaled time variable
 $\tau$
. In practice, the rational approximation is progressively refined by increasing
 $p$
and
 $q$
, and the reported results are retained only after the growth rates and neutral stability boundaries are found to be insensitive to further refinement. Under the limit of long-wave perturbations, the wavenumber
 $k$
is considered as a small parameter, i.e.
 $k \ll 1$
, and the solution can be expressed as follows:
 \begin{align} \phi \left (y,\tau \right )=\mathrm{e}&^{\lambda \tau }\left [\phi _{0}\left (y,\tau \right )+k\phi _{1}\left (y,\tau \right )+k^{2}\phi _{2}\left (y,\tau \right )+{\cdots} \right ]\!, \end{align}
 \begin{align} h\left (\tau \right )&=\mathrm{e}^{\lambda \tau }\left [h _{0}\left (\tau \right )+kh _{1}\left (\tau \right )+k^{2}h _{2}\left (\tau \right )+{\cdots} \right ]\!, \end{align}
 \begin{align} \xi \left (\tau \right )&=\mathrm{e}^{\lambda \tau }\left [\xi _{0}\left (\tau \right )+k\xi _{1}\left (\tau \right )+k^{2}\xi _{2}\left (\tau \right )+{\cdots} \right ]\!, \end{align}
where
 $\phi _{\!j}(y,\tau )$
,
 $h_{\!j}(\tau )$
and
 $\xi _{\!j}(\tau )$
(
 $j=0,1,2,\ldots$
) are
 $2\pi$
-periodic in time, and
 $\lambda =\lambda _{r}+\mathrm{i}\lambda _{{i}}$
is the complex growth rate of the disturbance, also named the Floquet exponent. The parameter
 $\lambda$
can be expanded as a power series in
 $k$
 \begin{equation} {\lambda } =\lambda _{0}+k\lambda _{1}+k^{2}\lambda _{2}+{\cdots} . \end{equation}
Substituting these expansions into the Floquet system and collecting like terms of different order, a set of coupled equations for
 $\phi _{\!j}$
,
 $h_{\!j}$
and
 $\xi _{\!j}$
will be obtained, and the equations can be solved sequentially. The purpose of this procedure is to find the first non-zero
 $\lambda _{\!j}$
, corresponding to exponential growth or decay of the disturbance.
For the first order
 $O(1)$
, the Floquet system can be simplified as
 \begin{align} &\partial _{\tau }h_{0} +\lambda _{0} h_{0} =0 \quad \text{ at } \quad y=0, \end{align}
 \begin{align} &\partial _{\tau }\xi _{0} +\lambda _{0} \xi _{0} =0 \quad \text{ at } \quad y=0. \end{align}
Since
 $h_{0}(\tau )$
and
 $\xi _{0}(\tau )$
are both time-periodic functions of
 $\tau$
, the kinematic condition (3.4) and the transport equation for surfactant (3.5) lead to an admissible solution
 $\lambda _{0}=0$
. Here,
 $h_{0}$
and
 $\xi _{0}$
are constant. Then the Orr–Sommerfeld equation and boundary conditions are then given by
 \begin{align} \frac {2\beta ^{2}}{q}(\mathscr{D}^{2} +M\mathscr{D}^{4})&\partial _{\tau }\phi _{0}=\mathscr{D}^{4}\phi _{0}, \end{align}
 \begin{align} \phi _{0}=0,\quad \mathscr{D}\phi _{0} &=0\quad \text{ at } \quad y=-1, \end{align}
 \begin{align} \frac {2\beta ^{2}}{q} M\mathscr{D}^{2}\partial _{\tau }\phi _{0} =\mathscr{D}^{2}\phi _{0}+\biggl (\mathscr{D}^{2}U_{b}-\frac {2\beta ^{2}}{q}& M\mathscr{D}^{2}\partial _{\tau }U_{b}\biggr )h_{0}=0 \quad \text{ at } \quad y=0, \end{align}
 \begin{align} \frac {2\beta ^{2}}{q}(\mathscr{D} +M\mathscr{D}^{3})&\partial _{\tau }\phi _{0}=\mathscr{D}^{3}\phi _{0} \quad \text{ at } \quad y=0. \end{align}
Solving (3.6)–(3.9), the zero-order solution can be expressed as follows:
 \begin{align} \phi _{0}(y,\tau )=\textrm{Re} \biggl [\frac {\textrm{Re}\left \{1-\cosh [\varOmega _{1}(1+\mathrm{i}S_{1})(y+1)]\right \}}{\cosh ^{2}[\varOmega _{1}(1+\mathrm{i}S_{1})]} \mathrm{e}^{{i}q\tau } \notag \\[3pt] +\gamma \frac {\textrm{Re}\left \{1-\cosh [\varOmega _{2}(1+\mathrm{i}S_{2})(y+1)]\right \}}{\cosh ^{2}[\varOmega _{2}(1+\mathrm{i}S_{2})]}\mathrm{e}^{{i}p\tau } \biggr ]h_{0}. \end{align}
Obviously, at this order,
 $\phi _{0}(y,\tau )$
depends on the ratio of the amplitudes of the quasi-periodic modulation
 $\gamma =U_{2}/U_{1}$
and the surface surfactant does not affect the velocity distribution at this order.
For order
 $O(k)$
, the kinematic condition and the transport equation are
 \begin{align} &\frac {2\beta ^{2} }{q} \left (\partial _{\tau }h_{1} +\lambda _{1}h_{0} \right )+\mathrm{i}\phi _{0} +\mathrm{i}U_{b}h_{0} =0 \quad \text{ at } \quad y=0, \end{align}
 \begin{align} &\frac {2\beta ^{2} }{q} \left (\partial _{\tau }\xi _{1} +\lambda _{1}\xi _{0} \right )+\mathrm{i}\mathscr{D}\phi _{0} +\mathrm{i}U_{b}\xi _{0} =0 \quad \text{ at } \quad y=0. \end{align}
Since
 $\phi _{0}$
and
 $U_{b}$
are time periodic with a zero average, to obtain periodic solutions
 $h_{1}(\tau )$
and
 $\xi _{1}(\tau )$
, we must have
 $\lambda _{1}=0$
to ensure that
 $h_{1}(\tau )$
and
 $\xi _{1}(\tau )$
have periodic solutions. Then the Orr–Sommerfeld equation and boundary conditions are then given by
 \begin{align} \frac {2\beta ^{2}}{q}(\mathscr{D}^{2}+M\mathscr{D}^{4}) \partial _{\tau }\phi _{1} =\mathscr{D}^{4}\phi _{1}-\mathrm{i}[U_{b}(\mathscr{D}^{2}&+M\mathscr{D}^{4})-(\mathscr{D}^{2}U_{b}+M\mathscr{D}^{4}U_{b})]\phi _{0}, \end{align}
 \begin{align} \phi _{1}=0,\quad \mathscr{D}\phi _{1}&=0 \quad \text{ at } \quad y=-1, \end{align}
 \begin{align} \frac {2\beta ^{2}}{q} M\mathscr{D}^{2}\partial _{\tau }\phi _{1} =\mathscr{D}^{2}\phi _{1}-\mathrm{i}M(U_{b}\mathscr{D}^{2}\phi _{0}&-\phi _{0}\mathscr{D}^{2}U_{b})\notag \\+\biggl (\mathscr{D}^{2}U_{b}-\frac {2\beta ^{2}}{q}M& \mathscr{D}^{2}\partial _{\tau }U_{b} \biggr )h_{1}+\mathrm{i}M_{s}{\textrm{Re}}^{2}\xi _{0}\quad \text{ at } \quad y=0, \end{align}
 \begin{align} \frac {2\beta ^{2}}{q}(\mathscr{D}+M\mathscr{D}^{3}) \partial _{\tau }\phi _{1} =\mathscr{D}^{3}\phi _{1}-\mathrm{i}[U_{b}(&\mathscr{D}+M\mathscr{D}^{3})\notag \\+M(\mathscr{D}^{2}U_{b}&\mathscr{D}-\mathscr{D}^{3}U_{b})]\phi _{0}-2\mathrm{i}\chi h_{0} \quad \text{ at } \quad y=0. \end{align}
Then, the expression of
 $h_{1}(\tau )$
and
 $\xi _{1}(\tau )$
can be obtained and the detailed expressions are shown in Appendix A; these will be used in subsequent calculations. Furthermore, the solution of (3.13) is written in the form
 \begin{equation} \phi _{1} \left (y,\tau \right )=\psi _{1} \left (y\right )\mathrm{e}^{2{i}q\tau } +\psi _{2} \left (y\right )\mathrm{e}^{-2{i}q\tau } +\psi _{3} \left (y\right )\mathrm{e}^{2{i}p\tau } +\psi _{4} \left (y\right )\mathrm{e}^{-2{i}p\tau }+\psi _{5}(y) . \end{equation}
In the differential system for
 $\phi _{1}$
, the inhomogeneous contributions consist of products of time-dependent functions of the form
 $\mathrm{e}^{\pm 2{i}q\tau }$
or
 $\mathrm{e}^{\pm 2{i}p\tau }$
. Therefore,
 $\psi _{5}(y)$
denotes the steady part in (3.17). It will be shown that the stability of the flow, as characterised by
 $\lambda _{2}$
, can be established by solving for
 $\psi _{5}(y)$
alone. The corresponding time-independent solution of first-order equations can be expressed as
 \begin{align} \psi _{5} \left (y\right )=C_{0}+C_{1}y+C_{2}y^{2}+C_{3}y^{3}-2\mathrm{i}{\textrm{Re}}^{2}h_{0}\mathrm{Re}[L_{0}]+2\mathrm{i}{\textrm{Re}}^{2}h_{0}\mathrm{Re}[L_{1}]. \end{align}
Here, the coefficients
 $C_{0}$
,
 $C_{1}$
,
 $C_{2}$
,
 $C_{3}$
,
 $L_{0}$
and
 $L_{1}$
can be determined by the boundary conditions and are given in Appendix B.
For
 $O(k^{2})$
, the kinematic boundary condition and the surfactant transport equation are given by
 \begin{align} &\frac {2\beta ^{2} }{q} \left (\partial _{\tau }h_{2}+\lambda _{2} h_{0} \right )+\mathrm{i}U_{b}h_{1}+\mathrm{i}\phi _{1}=0 \quad \text{ at } \quad y=0, \end{align}
 \begin{align} &\frac {2\beta ^{2} }{q} \left (\partial _{\tau }\xi _{2}+\lambda _{2} \xi _{0} \right )+\mathrm{i}U_{b}\xi _{1}+\mathrm{i}\mathscr{D}\phi _{1} =0 \quad \text{ at } \quad y=0. \end{align}
By taking the steady terms on both sides, the expression of
 $\lambda _{2}$
is obtained
 \begin{align} \frac {2\beta ^{2} }{q} \lambda _{2} h_{0}=&-\frac {2\chi }{3}h_{0} -\frac {M_{s}{\textrm{Re}}^{2}}{2} \xi _{0} +I_{1}h_{0}, \end{align}
 \begin{align} \frac {2\beta ^{2} }{q} \lambda _{2} \xi _{0}=&-\chi h_{0} -M_{s}{\textrm{Re}}^{2} \xi _{0} +I_{2}h_{0}. \end{align}
The detailed expressions of
 $I_{1}$
and
 $I_{2}$
are provided in Appendix C and we note that
 $I_{1}$
and
 $I_{2}$
depend on
 $M$
,
 $\beta$
,
 $\omega$
and
 $\gamma$
. Equations (3.21) and (3.22) can be written in the matrix form
 \begin{equation} \begin{bmatrix} \displaystyle { I_1-\frac {2\chi }{3}} &\quad \displaystyle { -\frac {M_{s}{\textrm{Re}}^{2}}{2} }\\[7pt] \displaystyle { I_2 -\chi } &\quad \displaystyle { -M_{s}{\textrm{Re}}^{2}}\end{bmatrix} \begin{bmatrix}\displaystyle { h_0}\\[3pt] \displaystyle {\xi _0}\end{bmatrix}= \frac {2\beta ^2}{q} \lambda _2\begin{bmatrix}h_0\\[3pt] \xi _0 \end{bmatrix}. \end{equation}
Obviously, in contrast to the single formula for the Floquet exponent derived by Jaouahiry & Aniss (Reference Jaouahiry and Aniss2025), the transport equation for surfactant in the present study results in a second-order matrix eigenvalue problem, with
 $2\beta ^{2}\lambda _{2}/q$
being the eigenvalue and
 $[h_{0},\xi _{0}]^{T}$
being the eigenvector. For clarity, let
 $\theta =2\beta ^{2}\lambda _{2}/q$
, then
 $\theta$
can be obtained by solving the quadratic equation
 \begin{equation} \theta ^{2} +b\theta +c=0, \end{equation}
where the coefficients
 $b$
and
 $c$
are constants and can be obtained as
 \begin{equation} b=\frac {2\chi }{3}+M_{s}{\textrm{Re}}^{2}-I_{1},\quad c=\frac {M_{s}{\textrm{Re}}^{2}}{2} \left (I_{2}-2I_{1}+\frac {\chi }{3}\right )\!. \end{equation}
When surfactant is absent, i.e.
 $M_{s}=0$
, only (3.19) is needed, which gives
 \begin{equation} \theta =-b=I_{1}-\frac {2\chi }{3}. \end{equation}
When the viscoelasticity is absent, (3.23) is the same as Jia et al. (Reference Jia, Xiao, Wang, Zhao and Xue2026) and if the quasi-periodic oscillation is removed, the eigenvalue problem will degenerate into the form of Wang et al. (Reference Wang, Du, Xiao and Zhao2023).
It should be emphasised that the analysis presented here is confined to the long-wave assumption (
 $k\ll 1$
) and is therefore valid only in the long-wave regime. Results for disturbances with arbitrary wavenumbers are developed in subsequent sections. In the following analysis, we will discuss the influence of different parameters in the absence and presence of gravity.
For a general case, there exist two roots, corresponding to two Floquet modes, which are associated with the deformation of the interface and the presence of surfactant. Since
 $b$
and
 $c$
are real, (3.24) has two real or conjugate complex roots. It is easy to find that the neutral condition corresponds to the two possibilities
 $c=0,\ b\geqslant 0$
and
 $b=0,\ c\geqslant 0$
, which combine to yield, according to (3.25),
 \begin{equation} \chi =\frac {3}{2}\max \big (4I_{1}-2I_{2},I_{1}-M_{s}{\textrm{Re}}^{2}\big). \end{equation}
The flow parameters used to determine the onset of the long-wavelength instability have been reduced to
 $M$
,
 $\chi$
,
 $\beta$
,
 $\omega$
,
 $\gamma$
and
 $M_{s}$
. With different values of the parameters, one can determine whether the flow is stable or not by (3.27). Obviously, no solution exists if the right-hand side of (3.27) is negative, i.e. the flow with long-wavelength disturbances is always stable in this case.
3.1. Absence of gravity
$\chi =0$

In certain microgravity environments, such as the space environment, gravitational effects may be negligible or entirely absent, making it necessary to examine the stability characteristics under zero-gravity conditions. The influences of the viscoelastic parameter
 $M$
, surface surfactant
 $M_{s}$
, the amplitude ratio
 $\gamma$
and the frequency ratio
 $\omega$
on the neutral stability conditions are therefore investigated through a direct analysis of (3.27). For the long-wavelength instability (
 $k \ll 0$
), the neutral condition in the absence of gravity becomes
 \begin{equation} \max \big (4I_{1}-2I_{2},I_{1}-M_{s}{\textrm{Re}}^{2}\big )=0. \end{equation}
While (3.28) shares the same functional form as that derived by Gao & Lu (Reference Gao and Lu2006), the influence of viscoelasticity and quasi-periodic oscillation is introduced into the expressions
 $I_{1}$
and
 $I_{2}$
.
The real part of
 $\theta /{\textrm{Re}}^{2}$
as a function of
 $\beta$
when
 $\chi =0$
,
 $\textrm{Re}=200$
,
 $\omega =\sqrt {37}$
,
 $\gamma =1$
for (
 $a$
)
 $M_{s}=0.005$
and (
 $b$
)
 $M_{s}=0.001$
with
 $M=0$
(black dashed lines),
 $M=0.003$
(orange solid lines) and
 $M=0.007$
(blue solid lines). The black solid lines represent Newtonian fluids without surfactants.

In order to explore more clearly the influence of viscoelasticity on different Floquet modes in the presence of surfactants, the real part of
 $\theta /{\textrm{Re}}^{2}$
as a function of
 $\beta$
for typical values
 $M=0$
,
 $M=0.003$
and
 $M=0.007$
for different
 $M_{s}$
when
 $\chi =0$
,
 $\textrm{Re}=200$
,
 $\omega =\sqrt {37}$
and
 $\gamma =1$
is depicted in figure 2. In fact, for other frequency ratios
 $\omega$
and amplitude ratios
 $\gamma$
, the real part of
 $\theta /{\textrm{Re}}^{2}$
for different viscoelasticity parameters
 $M$
exhibits similar trends and is thus omitted, confirming the generality of the present conclusion. Rather than presenting the eigenvalue spectrum, we focus here on the two dominant Floquet roots, since the real part of
 $\theta /{\textrm{Re}}^{2}$
already captures the modal information most relevant to the long-wave instability discussed below. In addition, for comparison, the growth curves of the Newtonian fluid (
 $M=0$
) and the clean surface (
 $M_{s}=0$
) are also shown in black solid lines. In the presence of surfactants, the two roots of (3.24) are represented in the same colour in figure 2 and these two roots correspond to the two Floquet modes that we have obtained. Throughout most of the range of
 $\beta$
, the Floquet exponents are real and are shown as two branches of the growth rate curve, corresponding to standing-wave modes, whereas in the small frequency range, such as
 $2.06\lt \beta \lt 2.79$
when
 $M=0.003$
, the two branches merge into a curve. The Floquet exponents in this interval are a pair of conjugate complex numbers, corresponding to the travelling-wave disturbances. Additionally, in contrast to the periodic oscillations in Wang et al. (Reference Wang, Du, Xiao and Zhao2023), the curves for both clean and contaminated surfaces exhibit two distinct peaks of the unstable modes, corresponding to the two primary frequencies
 $\omega _{1}$
and
 $\omega _{2}$
of the quasi-periodic oscillations. Specifically, the peak at the low-frequency corresponds to
 $\omega _{2}$
, while
 $\omega _{1}$
corresponds to the high-frequency peak. This bimodal structure is a direct consequence of the quasi-periodic oscillation, since the two independent primary frequencies
 $\omega _{1}$
and
 $\omega _{2}$
each introduce a preferred amplification band. Furthermore, according to the result of Gao & Lu (Reference Gao and Lu2006), the existence of surfactants will inhibit the growth of disturbance and make the flow more stable. Therefore, in figure 2, the growth rate of a Newtonian fluid with surfactants (black dashed lines) is lower than that in the case of a clean surface (black solid lines). For a larger
 $M_{s}=0.005$
in figure 2(
 $a$
), as the viscoelastic parameter
 $M$
increases from zero to
 $0.003$
, the growth rate of the two most unstable modes also increases. However, within the given parameter range, their maximum growth rate still does not exceed the growth rate under the clean surface condition. This indicates that, although viscoelasticity can promote the growth of disturbance, the destabilising effect of viscoelasticity is less obvious than the stabilising effect of surfactants when viscoelasticity is weak. Notably, the increase in viscoelasticity has no significant effect on the oscillation frequencies corresponding to the two peaks, which remain at
 $\beta =0.46$
and
 $\beta =1.06$
. As the viscoelastic parameter
 $M$
continues to increase to
 $0.007$
, the growth rate of the most unstable mode corresponding to
 $\omega _{2}$
exceeds that under the clean surface condition, while the peak growth rate corresponding to
 $\omega _{1}$
remains lower than that under the clean surface. This indicates that, when the viscoelasticity is sufficiently large, even in the presence of surfactants, the flow may still be more unstable than the Newtonian fluid with a clean surface, and the growth rate of the most unstable mode corresponding to
 $\omega _{2}$
increases more rapidly. Figure 2(
 $b$
) further illustrates the case for a smaller surfactant concentration parameter
 $M_{s}=0.001$
. The results indicate that when the viscoelastic effect significantly exceeds the surfactant effect, the peaks of the unstable modes corresponding to the two frequencies
 $\omega _{1}$
and
 $\omega _{2}$
both exceed those under the clean surface condition. In summary, when viscoelasticity and surfactant exist at the same time, the stability of oscillating liquid film mainly depends on the competitive relationship between the two, with the peak of the unstable mode corresponding to
 $\omega _{2}$
being more significantly influenced by viscoelasticity.
Effect of different viscoelastic parameter,
 $M$
, on the neutral curves on the
 $\beta -M_{s}$
plane when
 $\chi =0$
,
 $\textrm{Re}=200$
,
 $\omega =\sqrt {37}$
,
 $\gamma =1$
, (
 $a$
)
 $M=0$
, (
 $b$
)
 $M=0.001$
, (
 $c$
)
 $M=0.0015$
and (
 $d$
)
 $M=0.002$
. Stable (S) and unstable (U) regions are denoted by yellow and blue bands, respectively.

Figure 3 shows the effect of different viscoelastic parameters
 $M$
on the
 $\beta -M_{s}$
neutral curves under given parameters. These neutral curves divide the parameter plane into alternating stable and unstable intervals. As the value of
 $M_{s}$
increases from nearly zero, the neutral curve initially appears as vertical lines. When
 $M_{s}$
continues to increase, the majority of the neutral curve, with the exception of the high-frequency region in figure 3(
 $a$
), becomes curved, accompanied by the narrowing of the unstable interval, indicating a stabilising effect of surfactant. Upon a further increase in
 $M_{s}$
, these neutral curves straighten back into a vertical line. For a Newtonian fluid (
 $M=0$
), the characteristics of the neutral curves within the interval
 $0\lt \beta \lt 10$
are consistent with those found by Gao & Lu (Reference Gao and Lu2006), i.e. with the increase of the surfactant concentration, the form of motion of the perturbed mode changes from standing waves (vertical straight lines controlled by
 $4I_{1}-2I_{2}$
) to travelling waves (curve parts controlled by
 $I_{1}-{\textrm{Re}}^{2}M_{s}$
) to standing waves again, and the width of unstable intervals changes from decreasing to eventually constant. However, the neutral curves within the interval
 $10\lt \beta \lt 16$
remain as vertical lines (standing waves), and the width of unstable intervals remains unchanged. This indicates that, in the high-frequency region, the effect of surfactant concentration on the neutral curve can be neglected. For clarity in subsequent discussion, the unstable regions in the figure are sequentially labelled as the first to the fifth unstable regions along the direction of increasing oscillatory frequency
 $\beta$
. This nomenclature will be used throughout the following discussion. When the viscoelastic parameter
 $M=0.001$
in figure 3(
 $b$
), the first unstable region in the interval
 $0\lt \beta \lt 2.6$
remains almost unchanged, while the shrinkage positions of the second and third unstable regions are raised, leading to the expansion of these unstable regions. This indicates that viscoelasticity plays a role in promoting instability. The fourth unstable region undergoes significant changes. It shifts toward lower frequencies, and compared with the fourth unstable region under Newtonian fluid conditions in figure 3(
 $a$
), a shrinkage phenomenon emerges, manifested as a travelling-wave perturbed mode, emerges. Similarly, the fifth unstable region also exhibits shrinkage, and the
 $\beta$
range it occupies increases significantly. These results indicate that the viscoelastic parameter has a more significant effect on instability in the high-frequency region. When the viscoelastic parameter
 $M$
increases further to 0.0015 in figure 3(
 $c$
), the first three unstable regions remain relatively unchanged, indicating that the viscoelastic parameter has little effect on the neutral curve in the low-frequency region. However, the range of the fourth unstable region continues to expand, and the shrinkage position continues to be raised. Meanwhile, the fifth unstable region moves to higher frequencies, causing the stable regions between the fourth and fifth unstable regions to occupy most of the high-frequency range.
The real part of
 $\theta /{\textrm{Re}}^{2}$
as a function of
 $\beta$
when
 $\chi =0$
,
 $\textrm{Re}=200$
,
 $\omega =\sqrt {37}$
and
 $\gamma =1$
with fixed
 $M_{s}=10^{-6}$
. The blue and orange curves represent the two roots of (3.24) when
 $M=0$
in figure 3(
 $a$
), while the grey curves represent results when
 $M=0.0015$
in figure 3(
 $c$
).

To further illustrate this phenomenon, figure 4 presents the variations of the real parts of the growth rates of two Floquet modes with the oscillation frequency
 $\beta$
for this parameter combination with a fixed
 $M_{s}=10^{-6}$
, which are represented in blue and orange. For comparison, the real part of the growth rate curves under the same parameter combination when viscoelasticity is absent, i.e.
 $M=0$
, is also shown in the figure. Overall, in the low-frequency range, the curve follows a trend similar to that shown in figure 2; however, some differences emerge in the high-frequency region. In the inset, when
 $\beta$
increases to
 $9.21$
, the growth rate corresponding to the blue solid line changes from negative to positive, marking the onset of the fourth unstable region in figure 3(
 $c$
). As
 $\beta$
continues to increase to
 $10.19$
, the growth rate corresponding to the blue solid line changes from positive to negative and only becomes positive again when
 $\beta$
reaches
 $14.22$
. The interval
 $10.19\lt \beta \lt 14.22$
corresponds to the stable regions within the fourth and fifth unstable regions. In the interval where
 $\beta \gt 14.22$
, due to the very small range of the vertical axis, the growth rate curve in the inset approximates a vertical line. Within this interval, although the growth rate corresponding to the orange dashed line becomes negative, the growth rate corresponding to the blue solid line remains positive, resulting in an unstable flow. In addition, by comparing with the growth rate curves under non-viscoelastic condition, it can be seen that, under this parameter combination, the presence of viscoelasticity results in a broad range of negative growth rates in the high-frequency range, leading to a wider stable region on the
 $\beta -M_{s}$
plane in figure 3
 $(c)$
. Therefore, the high-frequency region becomes more stable, and this stability transition is caused by the modal change induced by viscoelasticity, indicating that viscoelasticity exhibits a stabilising effect under specific parameters. Finally, as shown in figure 3
 $(d)$
, when the viscoelastic parameter
 $M=0.002$
, the fourth and fifth unstable regions merge and occupy the entire high-frequency range, indicating that viscoelasticity once again exhibits a destabilising effect. In summary, in the absence of gravity, the increase in viscoelasticity has little effect on the neutral curve in the low-frequency region but has a significant impact on the high-frequency region, where it exhibits a dual effect. Here, the term dual effect refers to the non-monotonic influence of viscoelasticity in the high-frequency region.
Effect of different frequency ratios,
 $\omega$
, on the neutral curves on the
 $\beta -M_{s}$
plane when
 $\chi =0$
,
 $\textrm{Re}=200$
,
 $\gamma =1$
and
 $M=0.001$
, (
 $a$
)
 $\omega =\sqrt {37}$
, (
 $b$
)
 $\omega =\sqrt {7}$
, (
 $c$
)
 $\omega =\sqrt {2}$
, (
 $d$
)
 $\omega =1/\sqrt {2}$
, (
 $e$
)
 $\omega =1/\sqrt {7}$
and (
 $f$
)
 $\omega =1/\sqrt {37}$
. Stable (S) and unstable (U) regions are denoted by yellow and blue bands, respectively.

Effect of different amplitude ratios,
 $\gamma$
, on the neutral curves on the
 $\beta -M_{s}$
plane when
 $\chi =0$
,
 $\textrm{Re}=200$
,
 $\omega =\sqrt {37}$
and
 $M=0.001$
, (
 $a$
)
 $\gamma =0.1$
, (
 $b$
)
 $\gamma =1.5$
, (
 $c$
)
 $\gamma =2$
and (
 $d$
)
 $\gamma =3$
. Stable (S) and unstable (U) regions are denoted by yellow and blue bands, respectively.

Figure 6. Long description
The image contains four vertical bar graphs labeled (a), (b), (c), and (d). Each graph shows the relationship between the variable M_s on the vertical axis and beta on the horizontal axis. The vertical axis is logarithmic, ranging from 10^-10 to 10^0, and the horizontal axis ranges from 0 to 16. Stable (S) and unstable (U) regions are denoted by yellow and blue bands, respectively. Panel A: The graph shows the neutral curves for a specific amplitude ratio. The unstable regions are concentrated at lower values of beta and higher values of M_s. Panel B: This graph also depicts the neutral curves for a different amplitude ratio. The pattern of stable and unstable regions is similar to Panel A but with slight variations in the width and position of the bands. Panel C: The graph shows another set of neutral curves for a different amplitude ratio. The unstable regions are more pronounced at specific intervals of beta. Panel D: This graph depicts the neutral curves for yet another amplitude ratio. The stable and unstable regions follow a pattern similar to the previous panels but with distinct differences in the distribution and width of the bands.
To facilitate a more direct comparison with the results of previous studies, the frequency-ratio parameters
 $\omega$
employed in Jaouahiry & Aniss (Reference Jaouahiry and Aniss2025) and Jia et al. (Reference Jia, Xiao, Wang, Zhao and Xue2026) are adopted in the present study. Figure 5 displays the effect of different frequency ratios
 $\omega$
on the
 $\beta -M_{s}$
neutral curves under given parameters. Firstly, when the frequency ratio
 $\omega \gt 1$
, as the frequency ratio
 $\omega$
decreases from
 $\sqrt {37}$
to
 $\sqrt {7}$
, the stability characteristics of the system do not exhibit significant changes within the interval
 $0\lt \beta \lt 11.5$
. However, in the high-frequency interval of
 $11.5\lt \beta \lt 16$
, the range of the stable region expands markedly, indicating that a decrease in the frequency ratio
 $\omega$
can enhance the stability in the high-frequency range. As the frequency ratio
 $\omega$
further decreases to
 $\sqrt {2}$
in figure 5(
 $c$
), the changes in stability characteristics are primarily confined to the interval
 $4.08\lt \beta \lt 8.49$
. Within this second unstable region, increasing
 $M_{s}$
causes the perturbed mode to transform from standing waves to travelling waves, without reverting back to the standing-wave mode again, and this leads to the range of the second unstable region shrinking to zero along the
 $M_{s}$
direction. Meanwhile, the shrinkage phenomenon of the third unstable region becomes more significant. Collectively, these changes promote stabilisation within this frequency range. The above results indicate that when both viscoelasticity and surfactants are present, a decrease in the frequency ratio
 $\omega$
can suppress flow instability when
 $\omega \gt 1$
. As the frequency ratio
 $\omega$
decreases, instability in the high-frequency region is suppressed first, followed by the suppression of instability in the mid-to-low-frequency regions. Furthermore, when the frequency ratio
 $\omega \lt 1$
, the neutral curves for different values of
 $\omega$
exhibit the same trend as the curve for
 $1/\omega$
. The only difference is that, at this point, the range of the stable and unstable regions on the
 $\beta -M_{s}$
plane expands significantly, occupying a larger range of frequency parameters
 $\beta$
.
Figure 6 illustrates the effect of different frequency ratios
 $\gamma$
on the
 $\beta -M_{s}$
neutral curves under given parameters. As the amplitude ratio
 $\gamma$
increases from
 $0.1$
to
 $1.5$
, the shrinkage position of the fifth unstable region within the high-frequency interval is raised. While in the low-frequency domain, an additional smaller stable region is observed in the interval
 $0.7\lt \beta \lt 1$
. The physical mechanism of this smaller stable region originates from the bimodal structure of the growth rate curves under quasi-periodic oscillations, and this phenomenon will be discussed in detail in the subsequent sections. With the further increase of
 $\gamma$
to
 $2$
in figure 6(
 $c$
), the smaller stable region is gradually engulfed by the larger stable region on its right. As
 $\gamma$
increases further to
 $3$
in figure 6(
 $d$
), the overall area of the stable region begins to decrease, demonstrating that for sufficiently large
 $\gamma$
, the stabilising effect of surfactants is weaker than the destabilising effect of high frequency ratio
 $\gamma$
. Moreover, when
 $\gamma$
exceeds 1.5, the evolution of the neutral curves in the high-frequency region for different amplitude ratios shows no significant characteristic trends.
The real part of
 $\theta /{\textrm{Re}}^{2}$
as a function of
 $\beta$
when
 $\chi =0$
,
 $\textrm{Re}=200$
,
 $\omega =\sqrt {37}$
and
 $M=0.001$
for fixed
 $M_{s}=0.3$
in figure 6, with
 $\gamma =1.5$
(black solid line),
 $\gamma =2$
(orange solid line) and
 $\gamma =3$
(blue solid line).

To further clarify the smaller stable region observed in the low-frequency region in figure 6(
 $b$
) and its subsequent evolution, figure 7 plots the variation of the real part of the growth rate with the oscillation frequency
 $\beta$
for the given parameters at different frequency ratios
 $\gamma$
, where
 $M_{s}=0.3$
is held constant. Since one of the two Floquet modes remains negative for all three prescribed frequency ratios, it is therefore neglected in figure 7. Even at a higher surfactant concentration of
 $M_{s}=0.3$
, the growth rate curves still exhibit the characteristic of two distinct peaks. However, owing to the larger amplitude ratio
 $\gamma$
, the growth rate of the most unstable mode corresponding to
 $\omega _{1}$
is correspondingly reduced (see the inset). When
 $\gamma =1.5$
, in contrast to the growth rate curves for
 $\gamma =1$
in figures 2 and 4, an interval with negative growth rates (
 $0.7\lt \beta \lt 1$
) emerges between the two peaks, corresponding to the smaller stable region observed in figure 6(
 $b$
). As
 $\gamma$
increases to
 $2$
, the peak growth rate corresponding to
 $\omega _{1}$
further decreases to a negative value and merges with the adjacent interval with negative growth rates. This forms a broader band of negative growth rates, which corresponds to the merging of stable regions in figure 6(
 $c$
). Finally, as the frequency ratio
 $\gamma$
continues to increase to
 $3$
, the range of oscillation frequencies covered by the interval with negative growth rates actually contracts, consistent with a reduction in the area of the stable region in figure 6(
 $d$
). The above results indicate that increasing the amplitude ratio
 $\gamma$
enhances the growth rate of the most unstable mode associated with
 $\omega _{2}$
, while suppressing that corresponding to
 $\omega _{1}$
, even reducing it to negative. Moreover, a similarly smaller stable region was also observed in the work of Jia et al. (Reference Jia, Xiao, Wang, Zhao and Xue2026), suggesting that this phenomenon is not strongly related to viscoelasticity.
3.2. Presence of gravity
$\chi =1$

(
 $a$
) The neutral curves in the
 $\textrm{Re}-\beta$
plane for different viscoelastic parameters with
 $\chi =1$
,
 $\omega =\sqrt {37}$
,
 $\gamma =1$
and
 $M_{s}=0.01$
when
 $M=0$
(black dashed lines),
 $M=0.001$
(orange solid lines),
 $M=0.0015$
(blue solid lines) and
 $M=0.002$
(red dotted lines). (
 $b$
) When
 $\textrm{Re}=10^{5}$
is fixed, the real part of
 $\theta /{\textrm{Re}}^{2}$
as a function of
 $\beta$
under identical parameters as in figure 8(
 $a$
) in the interval
 $9\lt \beta \lt 15$
, and the black dashed lines, orange solid lines, blue solid lines and red dotted lines respectively represent
 $M=0$
,
 $M=0.001$
,
 $M=0.0015$
and
 $M=0.002$
.

Figure 8. Long description
Panel A: A line graph shows the relationship between the Reynolds number (Re) on the vertical axis and the parameter beta (β) on the horizontal axis. The graph includes multiple lines: black dashed lines, orange solid lines, blue solid lines, and red dotted lines, each representing different viscoelastic parameters. The lines exhibit various trends, including sharp increases and decreases, indicating different stability behaviors. Panel B: Another line graph displays the real part of a variable (θr/Re^2) on the vertical axis as a function of beta (β) on the horizontal axis. The graph includes the same line styles as Panel A. An inset within this panel zooms in on the interval from 10.5 to 12.5 for beta, showing detailed behavior around this range. The main graph and the inset together illustrate how the real part of the variable changes with beta, highlighting specific trends and interactions among the different lines.
The cases with gravity, which correspond to terrestrial experiments and industrial thin-film applications, represent the most common situation. When the influence of gravity is considered, in the
 $\textrm{Re}-\beta$
plane, the neutral curves corresponding to long-wave instability present U-shaped curves with separated bandwidths of frequency, where the separated bandwidths refer to stable regions lying between long-wave instability intervals. Underneath the curve and outside the bandwidth range, all infinitesimal long-wave disturbances are stable. The physical origin of these U-shaped neutral curves is the stabilising action of gravity on the horizontal film. In the presence of gravity, the oscillatory forcing must be sufficiently strong to overcome this stabilising effect, so that instability appears only above a critical
 $\textrm{Re}$
. This gives rise to a U-shaped curve in the
 $\textrm{Re}-\beta$
plane, with the minimum indicating the frequency in which the oscillatory motion is most effective in destabilising the film. Wang et al. (Reference Wang, Du, Xiao and Zhao2023) studied the viscoelastic liquid film containing surfactants, and Jia et al. (Reference Jia, Xiao, Wang, Zhao and Xue2026) also studied the Newtonian liquid film containing surfactants under the quasi-periodic oscillation. Here, we take both viscoelasticity and the quasi-periodic oscillation into account under the influence of surfactant effects. Figure 8(
 $a$
) displays the influence of different viscoelastic parameters on the neutral curves with
 $\chi =1$
,
 $\omega =\sqrt {37}$
,
 $\gamma =1$
and
 $M_{s}=0.01$
when
 $M=0$
,
 $M=0.001$
,
 $M=0.0015$
and
 $M=0.002$
. In comparison with the results for single-frequency oscillations studied by Wang et al. (Reference Wang, Du, Xiao and Zhao2023), the presence of quasi-periodic oscillations leads to the emergence of two local minima in the lower segment of the first branch of neutral stability curves, which correspond to the two primary frequencies,
 $\omega _{1}$
and
 $\omega _{2}$
, of the quasi-periodic oscillations. By contrast, each of the remaining branches of the neutral curve exhibits only a single local minimum, suggesting that the effect of the quasi-periodic oscillations is confined to the first branch. For low-frequency oscillation (
 $\beta \lt 2.09$
), the neutral curves corresponding to different viscoelastic parameters nearly coincide, which means that viscoelasticity hardly affects the stability of low-frequency oscillation liquid film. Within the range of
 $4.56\lt \beta \lt 8.50$
, both the critical Reynolds number and the imposed oscillation frequency progressively decrease with the increase of viscoelasticity. However, in the high-frequency region (
 $\beta \gt 9.21$
), the results exhibit a distinctly different trend with increasing viscoelastic parameters. Firstly, for the Newtonian fluid (
 $M=0$
), the unstable region enclosed by the U-shaped branches within the high-frequency region contracts monotonically with increasing imposed oscillation frequency
 $\beta$
. When the viscoelastic parameter
 $M$
increases to
 $0.001$
, the unstable region no longer contracts monotonically but instead occupies a larger parameter space. This indicates that viscoelasticity now significantly destabilises the liquid film under high-frequency oscillations, which is markedly different from the results obtained under low-frequency oscillations. As
 $M$
increases further to
 $0.0015$
, the range of the two U-shaped curves in the high-frequency region continues to expand. However, within the range
 $10.17\lt \beta \lt 14.30$
, a stable region occupying the majority of the high-frequency region appears, implying that under this viscoelastic parameter the viscoelasticity plays a stabilising role in the high-frequency region. Finally, when
 $M$
increases to
 $0.002$
, the high-frequency region is entirely dominated by a single U-shaped curve, indicating that the influence of viscoelasticity once again turns into a more significantly destabilising effect. To clarify the above observations, figure 8(
 $b$
) presents the real part of the growth rate as functions of
 $\beta$
in the interval
 $9\lt \beta \lt 15$
with fixed
 $\textrm{Re}=10^{5}$
, under identical parameters as in figure 8(
 $a$
). Although (3.24) admits two roots under this condition, only one root is within the selected parameter range. All the growth rate curves exhibit a local minimum, and this minimum follows a trend of first decreasing and then increasing as the viscoelastic parameter
 $M$
increases. When
 $M=0.001$
, the minimum value is relatively small. As
 $M$
increases to
 $0.0015$
, the minimum value significantly decreases, and the corresponding oscillation frequency increases to
 $\beta =13.43$
, which causes the growth rate to be negative across the interval
 $10.17\lt \beta \lt 14.30$
, corresponding to the stable region observed in this frequency range in figure 8(
 $a$
). When
 $M$
continues to increase to
 $0.002$
, the minimum value increases significantly and the corresponding oscillation frequency decreases to
 $\beta =9.75$
, resulting in an unstable flow throughout the entirely high-frequency region. In summary, in the presence of gravity, viscoelasticity has little effect on the stability of low-frequency oscillation liquid film. However, it exhibits a dual regulation effect on the stability of high-frequency oscillation liquid film, initially destabilising, then stabilising and finally destabilising again the liquid film as
 $M$
increases.
The neutral curves in the
 $\textrm{Re}-\beta$
plane for different frequency ratios with
 $\chi =1$
,
 $\gamma =1$
,
 $M=0.002$
and
 $M_{s}=0.01$
. (
 $a$
) The black solid lines, orange dashed lines and blue solid lines represent
 $\omega =\sqrt {37}$
,
 $\omega =\sqrt {7}$
and
 $\omega =\sqrt {2}$
, respectively. (
 $b$
) The black solid lines, orange dashed lines and blue solid lines represent
 $\omega =1/\sqrt {37}$
,
 $\omega =1/\sqrt {7}$
and
 $\omega =1/\sqrt {2}$
, respectively.

Figure 9 depicts the effect of different frequency ratios on the neutral curves with
 $\chi =1$
,
 $\gamma =1$
,
 $M=0.002$
and
 $M_{s}=0.01$
. Results for
 $\omega \gt 1$
are shown in figure 9(
 $a$
), while those for
 $\omega \lt 1$
appear in figure 9(
 $b$
). When
 $\omega \gt 1$
, for the neutral curves corresponding to different frequency ratios
 $\omega$
, the bandwidths of the first branches in the interval
 $0\lt \beta \lt 2.11$
remain nearly invariant, indicating a weak sensitivity of the instability structure to the frequency ratios in the low-frequency range for
 $\omega \gt 1$
. As
 $\omega$
decreases from
 $\sqrt {37}$
to
 $\sqrt {2}$
, i.e. as
 $\omega _{1}$
and
 $\omega _{2}$
become increasingly close, the two minima on the first branch of the unstable frequency band progressively coalesce into a single minimum. This merging behaviour reflects the modulation of resonance interactions under increasingly similar excitation frequencies. However, in the high-frequency range
 $\beta \gt 10.28$
, the neutral curves for different frequency ratios exhibit significant differences. When
 $\omega =\sqrt {37}$
, the high-frequency region is almost entirely dominated by U-shaped unstable frequency bands. As the frequency ratio decreases, this U-shaped unstable frequency band gradually separates, and the range of the unstable region contracts, indicating that when
 $\omega \gt 1$
, the stability in the high-frequency range is progressively enhanced as the frequency ratio decreases. However, the results reported by Jia et al. (Reference Jia, Xiao, Wang, Zhao and Xue2026) for Newtonian fluids indicate that, in the absence of viscoelasticity, stability in the high-frequency region remains unaffected by variations in the frequency ratio
 $\omega$
. In figure 9(
 $b$
), as the frequency ratio
 $\omega$
increases, the bandwidths of the first branches in the neutral curves rapidly decrease rapidly, suggesting that, when
 $\omega \lt 1$
, increasing the frequency ratios significantly stabilises the liquid film in the low-frequency region. Meanwhile, on the neutral stability curve corresponding to
 $\omega =1/\sqrt {37}$
, it still exhibits two discernible minima. In contrast to the results for Newtonian fluids in Jia et al. (Reference Jia, Xiao, Wang, Zhao and Xue2026), in the high-frequency region
 $\beta \gt 25.31$
, when viscoelasticity is present, the neutral stability curves for different frequency ratios are all stacked together, while no such overlap occurs in the neutral stability curves in the high-frequency region under Newtonian fluid conditions. This demonstrates that the instability structure in viscoelastic fluids is only weakly sensitive to the frequency ratios when
 $\omega \lt 1$
. In conclusion, under viscoelastic effects, as opposed to Newtonian fluids, different frequency ratios exert completely distinct effects upon the neutral curves in the high-frequency region, indicating that, in high-frequency region, viscoelasticity has an obvious modulation effect on the influences of frequency ratio
 $\omega$
. These results indicate that the effect of the frequency ratio
 $\omega$
is not independent of viscoelasticity. Rather, the quasi-periodic oscillation introduces two time scales, and the elastic memory of the fluid modifies how the film responds to these time scales. This coupling is responsible for the much stronger frequency-ratio dependence observed here than in the corresponding Newtonian fluids, especially in the high-frequency region.
The neutral curves in the
 $\textrm{Re}-\beta$
plane for different amplitude ratios with
 $\chi =1$
and the black solid lines, orange solid lines and blue dashed lines represent
 $\gamma =0.1$
,
 $\gamma =1$
and
 $\gamma =1.5$
, respectively. Panels show (
 $a$
)
 $\omega =\sqrt {37}$
,
 $M=0.002$
and
 $M_{s}=0.01$
, (
 $b$
)
 $\omega =1/\sqrt {37}$
,
 $M=0.001$
and
 $M_{s}=10^{-6}$
.

Figure 10. Long description
Panel A: A line graph shows neutral curves in the plane for different amplitude ratios with beta ranging from 0 to 16 and Re ranging from 1 to 10^6. The black solid lines, orange solid lines, and blue dashed lines represent different amplitude ratios. Panel B: Another line graph shows neutral curves in the plane for different amplitude ratios with beta ranging from 0 to 32 and Re ranging from 1 to 10^6. The black solid lines, orange solid lines, and blue dashed lines represent different amplitude ratios.
The neutral curves in the
 $\textrm{Re}-\beta$
plane for different amplitude ratios with two distinct combinations of parameters when
 $\gamma =0.1$
,
 $\gamma =1$
and
 $\gamma =1.5$
are illustrated in figure 10. Figure 10(
 $a$
) illustrates the influence of the amplitude ratio
 $\gamma$
at a large frequency ratio
 $\omega =\sqrt {37}$
. Under these conditions, the bandwidths of the neutral curves for different amplitude ratios
 $\gamma$
remain almost unchanged. However, within the range
 $7.24\lt \beta \lt 8.82$
, an increase in the amplitude ratio
 $\gamma$
results in a slight rise in the corresponding imposed oscillation frequency
 $\beta$
. Under weak quasi-periodic forcing with
 $\gamma =0.1$
, the first branch in the interval
 $0\lt \beta \lt 2.11$
exhibits only a single minimum. As
 $\gamma$
increases, a second minimum appears on the first branch and rapidly decreases. This behaviour is attributed to the increased amplitude of the second primary frequency
 $\omega _{2}$
in the quasi-periodic forcing. In the high-frequency region
 $\beta \gt 14.03$
, although the bandwidth of the unstable frequency band remains unchanged with varying amplitude ratio
 $\gamma$
, the critical Reynolds number continuously decreases as
 $\gamma$
increases, leading to a significant expansion of the unstable region. This indicates that, at a large frequency ratio
 $\omega =\sqrt {37}$
, increasing the amplitude ratio significantly destabilises the film flow in the high-frequency region. However, the results for a Newtonian fluid (Jia et al. Reference Jia, Xiao, Wang, Zhao and Xue2026) demonstrate that, under identical parameter conditions, the neutral curves in the high-frequency region remain unchanged for different amplitude ratios. This suggests that, under this current circumstance, the influences of the amplitude ratio on high-frequency stability are primarily attributable to viscoelastic effects. Figure 10(
 $b$
) presents the effect of amplitude ratio
 $\gamma$
under a small frequency ratio
 $\omega =1/\sqrt {37}$
. In the low-frequency region
 $0\lt \beta \lt 6.43$
, when
 $\gamma =0.1$
, two separate U-shaped unstable frequency bands appear. As the amplitude ratio
 $\gamma$
increases, these two U-shaped unstable frequency bands merge into a single continuous unstable region. Subsequent analysis reveals that, in the low-frequency region, this phenomenon reflects the suppression of the finite-wavelength instability as
 $\gamma$
increases, facilitating a transition toward purely long-wave-driven instability. Within the interval
 $10.34\lt \beta \lt 26.11$
, the widths of the three U-shaped unstable frequency bands all expand significantly with increasing
 $\gamma$
, demonstrating that instability in this region is significantly enhanced. Finally, in the region
 $\beta \gt 29.82$
, the neutral curves corresponding to different
 $\gamma$
are all stacked together, indicating that high-frequency instability is only weakly influenced by the amplitude ratio
 $\gamma$
at a small
 $\omega =1/\sqrt {37}$
. Nevertheless, this phenomenon of overlap does not occur in Newtonian fluids with identical parameters. In summary, in high-frequency region, viscoelasticity also has a significant modulation effect on the influences of amplitude ratio gamma
 $\gamma$
.
4. Numerical procedure
The numerical method employed to solve the time-dependent perturbation equations (2.19)–(2.24) for disturbances of arbitrary wavenumbers is described in this section. The same rational approximation of the irrational frequency ratio is also adopted in the finite-wavelength analysis, so that the time-dependent coefficients can be represented in a Floquet or Fourier form. According to the Floquet theory, the disturbances can be assumed to be the following forms of truncated complex Fourier series:
 \begin{equation} \phi \left (y,\tau \right )=\mathrm{e}^{\lambda \tau } \sum _{n=-K}^{K} \hat {\phi } _{n}(y)\mathrm{e}^{{i}n\tau }, \quad h\left (\tau \right )=\mathrm{e}^{\lambda \tau } \sum _{n=-K}^{K} \hat {h} _{n}\mathrm{e}^{{i}n\tau }, \quad \xi \left (\tau \right )=\mathrm{e}^{\lambda \tau } \sum _{n=-K}^{K} \hat {\xi } _{n}\mathrm{e}^{{i}n\tau }, \end{equation}
where
 $K$
is the total order of Fourier modes.
Substituting the disturbances and basic flow into the Orr–Sommerfeld equation and boundary conditions, and collecting the coefficients of Fourier components
 $\mathrm{e}^{{i}n\tau }$
, the matrix differential equations are derived as
 \begin{gather} \mathbb{A}\hat {\phi } _{n-q}+\mathbb{B}\hat {\phi } _{n-p}+\mathbb{C}\hat {\phi } _{n}+\mathbb{E}\hat {\phi } _{n+p}+\mathbb{F}\hat {\phi } _{n+q}=\lambda \mathbb{S}_{1}\hat {\phi } _{n}, \end{gather}
with
 \begin{align} \mathbb{A}=\mathrm{i}k[\mathscr{D}^{2}U_{q}^{+}+&M\mathscr{D}^{4}U_{q}^{+} -U_{q}^{+}(\mathscr{L}+M\mathscr{L}^{2})], \end{align}
 \begin{align} \mathbb{B}=\mathrm{i}k[\mathscr{D}^{2}U_{p}^{+}+&M\mathscr{D}^{4}U_{p}^{+} -U_{p}^{+}(\mathscr{L}+M\mathscr{L}^{2})], \end{align}
 \begin{align} \mathbb{C}=\mathscr{L}^{2}&-\frac {2\mathrm{i}n\beta ^{2}}{q}(\mathscr{L}+M\mathscr{L}^{2}), \end{align}
 \begin{align} \mathbb{E}=\mathrm{i}k[\mathscr{D}^{2}U_{p}^{-}+&M\mathscr{D}^{4}U_{p}^{-} -U_{p}^{-}(\mathscr{L}+M\mathscr{L}^{2})], \end{align}
 \begin{align} \mathbb{F}=\mathrm{i}k[\mathscr{D}^{2}U_{q}^{-}+&M\mathscr{D}^{4}U_{q}^{-} -U_{q}^{-}(\mathscr{L}+M\mathscr{L}^{2})], \end{align}
 \begin{align} \mathbb{S}_{1}=&\frac {2\beta ^{2}}{q}(\mathscr{L}+M\mathscr{L}^{2}), \end{align}
where the differential operators
 $\mathscr{D}= {\partial }/{\partial y}$
and
 $\mathscr{L}=\mathscr{D}^{2}-k^{2}$
. Moreover,
 $U_{q}^{+}$
,
 $U_{p}^{+}$
,
 $U_{q}^{-}$
and
 $U_{p}^{-}$
are defined as
 $U_{b}(y,\tau )=U_{q}^{+}\mathrm{e}^{{i}q\tau }+U_{q}^{-} \mathrm{e}^{-{i}q\tau }+U_{p}^{+}\mathrm{e}^{{i}p\tau }+U_{p}^{-}\mathrm{e}^{-{i}p\tau }$
. The linearised kinematic boundary condition and transport equation are
 \begin{align} \mathrm{i}kU_{q}^{+} \hat {h} _{n-q}+\mathrm{i}kU_{p}^{+} \hat {h} _{n-p}+\frac {2\mathrm{i}n\beta ^{2}}{q} \hat {h} _{n}+\mathrm{i}kU_{p}^{-} \hat {h} _{n+p}+\mathrm{i}kU_{q}^{-} \hat {h} _{n+q}+\mathrm{i}k\hat {\phi }_{n} =-\lambda \frac {2\beta ^{2}}{q}\hat {h} _{n}, \\[-12pt]\nonumber \end{align}
 \begin{align} \mathrm{i}kU_{q}^{+} \hat {\xi } _{n-q}+\mathrm{i}kU_{p}^{+} \hat {\xi } _{n-p}+\frac {2\mathrm{i}n\beta ^{2}}{q} \hat {\xi } _{n}+\mathrm{i}kU_{p}^{-} \hat {\xi } _{n+p}+\mathrm{i}kU_{q}^{-} \hat {\xi } _{n+q}+ikD\hat {\phi }_{n} =-\lambda \frac {2\beta ^{2}}{q}\hat {\xi } _{n}. \end{align}
The Chebyshev spectral collocation method (Schmid & Henningson Reference Schmid and Henningson2001) is applied to numerically solve the system of (4.2)–(4.10). Following the linear stability framework and the small-perturbation assumption adopted in this study, the smooth function is discretised on Gauss–Lobatto collocation points by mapping the domain of the Chebyshev polynomials from
 $[-1,1]$
to the physical domain
 $[-1,0]$
, and the differential operators are approximated through pseudo-spectral differentiation matrices. Consequently, the linear system (4.2)–(4.10) is reformulated as a matrix eigenvalue problem
 \begin{equation} \mathbb{R}\mathbb{X}=\lambda \mathbb{S}\mathbb{X}, \end{equation}
where
 $\mathbb{R}$
is a block tridiagonal matrix assembled from the sub-matrices
 $\mathbb{A}$
,
 $\mathbb{B}$
,
 $\mathbb{C}$
,
 $\mathbb{E}$
and
 $\mathbb{F}$
, and
 $\mathbb{S}$
is a block diagonal square matrix. Here,
 $\mathbb{X}=[\hat {\phi }_{-K}, \hat {\phi }_{-K+1},\ldots , \hat {\phi }_{0},\ldots , \hat {\phi }_{K-1},\hat {\phi }_{K}, \hat {h}_{-K},\ldots ,\hat {h}_{0},\ldots \hat {h}_{K}, \hat {\xi }_{-K},\ldots ,\hat {\xi }_{0},\ldots \hat {\xi }_{K} ]^{T}$
is a column matrix, and
 $ \hat {\phi }_{K}=[\hat {\phi }_{K}^{ (0 )},\ldots ,\hat {\phi }_{K}^{ (N )}]^{T}$
, where
 $N$
is the total order of Chebyshev expansion. The boundary conditions are implemented by replacing the rows in the corresponding positions of matrices
 $\mathbb{R}$
and
 $\mathbb{S}$
. Finally, the eigenvalues
 $\lambda$
and the corresponding eigenvectors
 $\mathbb{X}$
are determined by solving the generalised eigenvalue problem associated with the sparse matrices
 $\mathbb{R}$
and
 $\mathbb{S}$
. Stable and unstable modes are classified by the sign of the real part of the eigenvalues. Specifically, eigenvalues with negative real components correspond to stable modes, whereas those with positive real components represent unstable modes. The purpose of the numerical simulation therefore aims to determine the neutral stability curve, defined as the locus of parameter values for which the real part of the Floquet exponent
 $\lambda$
is zero.
Numerical convergence has been verified by testing various combinations of different Chebyshev points
 $N$
and Fourier modes
 $K$
across different parameter sets, including capillary number,
 $\textit{Ca}$
; Womersley number,
 $\beta$
; Reynolds number,
 $\textrm{Re}$
; Marangoni number,
 $\textit{Ma}$
; and the viscoelastic parameter,
 $M$
. Table 1 presents the results of numerical convergence tests for a representative set of parameters. The values of
 $N$
and
 $K$
increase progressively in the calculation until the Floquet exponents
 $\lambda$
obtained are accurate enough. The long-wavelength analytical results of (3.27) are also shown in table 1 (marked in bold) to validate the numerical method. In addition to the results shown in the table, further increasing the values of
 $N$
and
 $K$
produces only marginal improvements in the relative accuracy of the eigenvalues, yet incurs substantially higher computational costs. Therefore, for most of the subsequent numerical calculations, the eigenvalue problem is solved accurately using a number of Chebyshev points
 $N=24$
and Fourier modes
 $K=12$
. Furthermore, when
 $\beta$
is sufficiently large, it is recommended to increase both
 $N$
and
 $K$
to maintain the desired level of numerical accuracy.
Numerical result of convergence tests for Chebyshev points
 $N$
and Fourier modes
 $K$
when
 $\textrm{Re}=200$
,
 $\beta =3$
,
 $\chi =1$
,
 $\textit{Ca}=0.05$
,
 $\omega =\sqrt {7}$
,
 $\gamma =1$
and
 $M_s=0.001$
. The values marked in bold indicate the long-wavelength expansion results of (3.27).

Table 1. Long description
A table with 12 rows and 7 columns. The columns are labeled M, k, K, N, λr, and λi. The table presents numerical results of convergence tests for Chebyshev points and Fourier modes. The values marked in bold indicate the long-wavelength expansion results. Row 1: M, 0.001; k, 0.001; K, 5; N, 5; λr, -4.800852 x 10^-6; λi, -1.152348 x 10^-5. Row 2: M, 0.001; k, 0.001; K, 10; N, 10; λr, -2.360650 x 10^-6; λi, -7.568059 x 10^-7. Row 3: M, 0.001; k, 0.001; K, 10; N, 20; λr, -2.275689 x 10^-6; λi, -9.373820 x 10^-7. Row 4: M, 0.001; k, 0.001; K, 12; N, 24; λr, -2.275710 x 10^-6; λi, -9.373838 x 10^-7. Row 5: M, 0.005; k, 0.001; K, 5; N, 5; λr, -5.222661 x 10^-5; λi, -1.101141 x 10^-7. Row 6: M, 0.005; k, 0.001; K, 10; N, 10; λr, -2.756436 x 10^-6; λi, -4.978875 x 10^-7. Row 7: M, 0.005; k, 0.001; K, 10; N, 20; λr, -2.788747 x 10^-6; λi, -3.357091 x 10^-7. Row 8: M, 0.005; k, 0.001; K, 12; N, 24; λr, -2.788828 x 10^-6; λi, -3.357227 x 10^-7. Row 9: M, 0.001; k, 1; K, 5; N, 5; λr, 0.125142; λi, -0.294803. Row 10: M, 0.001; k, 1; K, 10; N, 10; λr, 0.182079; λi, -0.336429. Row 11: M, 0.001; k, 1; K, 10; N, 20; λr, 0.172987; λi, -0.286889. Row 12: M, 0.001; k, 1; K, 12; N, 24; λr, 0.173403; λi, -0.287237. Row 13: M, 0.005; k, 1; K, 5; N, 5; λr, 0.220692; λi, -0.364004. Row 14: M, 0.005; k, 1; K, 10; N, 10; λr, 0.235981; λi, -0.292280. Row 15: M, 0.005; k, 1; K, 10; N, 20; λr, 0.206311; λi, -0.315093. Row 16: M, 0.005; k, 1; K, 12; N, 24; λr, 0.207294; λi, -0.315689.
In the case where only periodic oscillations are considered (
 $\gamma =0$
), the numerical results are compared with those of Wang et al. (Reference Wang, Du, Xiao and Zhao2023) to validate consistency. In the presence of gravity, the results for
 $\textrm{Re}=100$
,
 $\chi =1$
,
 $\textit{Ca}=0.05$
,
 $\beta =6$
,
 $M_{s}=0.001$
and
 $\gamma =0$
are shown in table 2. Under the given parameters, the first four eigenvalues obtained are denoted as
 $\lambda _{1}$
 $\sim$
 $\lambda _{4}$
. The remaining eigenvalues consist of a complex conjugate pair,
 $\lambda _{2}$
and
 $\lambda _{3}$
, along with a real eigenvalue
 $\lambda _{4}$
. It is observed that the current results show excellent agreement with those reported by Wang et al. (Reference Wang, Du, Xiao and Zhao2023).
Comparison of numerical results for
 $\lambda _{r}$
and
 $\lambda _{i}$
with
 $\textrm{Re}=100$
,
 $\chi =1$
,
 $\textit{Ca}=0.05$
,
 $\beta =6$
,
 $M_{s}=0.001$
and
 $\gamma =0$
.

Table 2. Long description
A table comparing numerical results for eigenvalues with those of Wang et al. 2023. The table has four rows and four columns. Column headers are M, k, lambda r (Wang et al. 2023), lambda i (Wang et al. 2023), lambda r (Current result), and lambda i (Current result). Row labels are 0.01, 0.001, 0.005, 0.001, 0.01, 2, 0.005, and 2. Row 1: M, 0.01; k, 0.001; lambda r (Wang et al. 2023), -2.538700 x 10^-8; lambda i (Wang et al. 2023), -1.522139 x 10^-7. Row 2: M, 0.005; k, 0.001; lambda r (Wang et al. 2023), -4.712391 x 10^-9; lambda i (Wang et al. 2023), -1.466769 x 10^-7. Row 3: M, 0.01; k, 2; lambda r (Wang et al. 2023), -0.102135; lambda i (Wang et al. 2023), -0.088407. Row 4: M, 0.005; k, 2; lambda r (Wang et al. 2023), -0.097199; lambda i (Wang et al. 2023), -0.129672. Row 1: M, 0.01; k, 0.001; lambda r (Current result), -2.538701 x 10^-8; lambda i (Current result), -1.522140 x 10^-7. Row 2: M, 0.005; k, 0.001; lambda r (Current result), -4.712391 x 10^-9; lambda i (Current result), -1.466769 x 10^-7. Row 3: M, 0.01; k, 2; lambda r (Current result), -0.102135; lambda i (Current result), -0.088407. Row 4: M, 0.005; k, 2; lambda r (Current result), -0.097199; lambda i (Current result), -0.129672.
Comparison of long-wave approximation results (solid lines) and numerical results (symbols) for
 $\textrm{Re}=200$
,
 $\chi =1$
,
 $\textit{Ca}=0.05$
,
 $M=10^{-3}$
,
 $M_{s}=10^{-2}$
,
 $\omega =\sqrt {7}$
and
 $\gamma =1$
. (a) Complex conjugate
 $\lambda$
for
 $\beta =2$
, the blue and orange solid lines represent the real part
 $\lambda _{r}$
and imaginary part
 $\lambda _{i}$
, respectively. (b) The first two real eigenvalues for
 $\beta =3$
, the blue and orange solid lines represent the first eigenvalue
 $\lambda _{1}$
and the second eigenvalue
 $\lambda _{2}$
, respectively.

In order to further verify the accuracy of the code and the correctness of the long-wavelength results, the analytical solution of the long-wavelength limit obtained in § 3 is compared with the current numerical results. As indicated by (3.23), in the long-wavelength limit
 $k\lt \lt 1$
, the eigenvalues governing the flow stability are characterised by the Floquet parameter,
 $\lambda =\lambda _{0}+k\lambda _{1}+k^{2}\lambda _{2}+\ldots$
, where
 $\lambda _{0}=\lambda _{1}=0$
. A comparison between the analytical and numerical solutions is presented in figure 11, spanning the range
 $10^{-4}$
to
 $10^{-1}$
of
 $k$
, and the typical parameters are selected as
 $\textrm{Re}=200$
,
 $\chi =1$
,
 $\textit{Ca}=0.05$
,
 $M=10^{-3}$
,
 $M_{s}=10^{-2}$
,
 $\omega =\sqrt {7}$
and
 $\gamma =1$
. The Floquet exponent is conjugate complex when
 $\beta =2$
, as shown in figure 11
 $(a)$
. It is reasonable to note that the numerical results gradually deviate from the long-wavelength theoretical solution when
 $k\gt 0.03$
, owing to the failure of the long-wavelength approximation with the increase of
 $k$
, and excellent agreement between numerical results and theoretical predictions is observed for
 $k\lt 0.03$
. Figure 11
 $(b)$
presents the absolute values of the first and the second eigenvalues
 $\lambda _{1}$
and
 $\lambda _{2}$
, for the case of
 $\beta =3$
. Similarly, the numerical results are consistent with theoretical solutions for
 $k\lt 0.03$
. After verifying the numerical convergence and the correctness of the results across different solution methods, the results of the numerical procedure are highly consistent with previously available data.
5. Finite-wavelength instability
This section investigates the stability of viscoelastic liquid film actuated by quasi-periodic oscillation under arbitrary wavelength disturbance. The long-wavelength analysis in § 3 reveals that the effects of viscoelasticity, modulation frequency and amplitude ratios all play a vital role in the stability of the system. Moreover, the presence or absence of gravity has an extremely limited effect on finite-wavelength stability. Consequently, the case without gravity is therefore not considered in the following analysis. To ensure comparability, the same parameters as in Or (Reference Or1997) and Jaouahiry & Aniss (Reference Jaouahiry and Aniss2025) are adopted, i.e.
 $\textit{Ca}=0.05$
,
 $\chi =1$
, and the stability characteristics will then be analysed by varying
 $\beta$
,
 $\textrm{Re}$
,
 $M$
,
 $\omega$
and
 $\gamma$
.
Stability characteristics in the presence of surfactants with
 $\textit{Ca}=0.05$
,
 $\chi =1$
,
 $\omega =\sqrt {37}$
,
 $\gamma =1$
and
 $M_{s}=0.01$
for different viscoelastic parameters
 $M=0.001$
(
 $a,b$
) and
 $M=0.002$
(
 $c,d$
). Panels (
 $a,c$
) represent the stability boundaries in the
 $\beta - \textrm{Re}_{c}$
plane, and panels (
 $b,d$
) represent variation of the corresponding wavenumber
 $k_{c}$
with
 $\beta$
. The U-shaped orange solid lines and the blue solid lines represent the long- and finite-wavelength instability, respectively. The vertical dash–dotted lines represent the boundaries of unstable regions. Here,
 $P_{1}$
denotes the low-frequency dominant critical mode transition induced by the surfactant effect, whereas
 $P_{2}$
and
 $P_{3}$
denote bifurcation points caused by the competition between different standing-wave modes.

Figure 12 illustrates the critical Reynolds number
 $\textrm{Re}_{c}$
and its corresponding critical wavenumber
 $k_{c}$
versus imposed frequency
 $\beta$
for two viscoelastic parameters (
 $M=0.001$
and
 $0.002$
) when
 $\omega =\sqrt {37}$
and
 $\gamma =1$
. As described in the long-wavelength stability analysis, the flow is unstable within discrete frequency intervals, and the vertical dashed lines in the figure indicate the boundaries of the long-wave mode. Unlike the long-wavelength cases, finite-wavelength instabilities appear when the Reynolds number exceeds a critical threshold, even within regions where long-wave disturbances remain stable. The corresponding boundaries of the finite-wavelength mode are indicated by the slanted lines in the figure. As
 $\beta$
continues to increase to the next long-wavelength instability interval, finite-wavelength instabilities still exist but no longer govern the critical Reynolds number
 $\textrm{Re}_{c}$
, because the flow is already unstable to long-wavelength disturbances. As a result, regions dominated by long-wave and finite-wavelength modes appear alternately throughout the entire range of
 $\beta$
. The gaps in the
 $k_{c}$
–
 $\beta$
curves correspond to the critical wavenumber
 $k_{c}=0$
in the long-wave instability mode. These phenomena are similar to those found by Gao & Lu (Reference Gao and Lu2008).
For a lower viscoelastic parameter
 $M=0.001$
in figures 12(
 $a$
) and 12(
 $b$
), the flow instability is initially dominated by the long-wave mode as the oscillation frequency
 $\beta$
increases from zero. As
 $\beta$
increases to
 $2.08$
, the critical Reynolds number
 $\textrm{Re}_{c}$
associated with the long-wave mode becomes equal to that of the finite-wavelength mode. In the subsequent range of oscillation frequencies
 $\beta$
, the flow instability is governed by the finite-wavelength mode, and the corresponding disturbance wavenumber increases rapidly from zero, as shown in figure 12(
 $b$
). Meanwhile, owing to the presence of surfactant, a bifurcation point
 $P_{1}$
appears at
 $\beta =2.3$
. Careful examination of the Floquet exponents reveals that the finite-wavelength mode here corresponds to two neutral modes. For the left of the bifurcation point
 $P_{1}$
, the Floquet exponents corresponding to the finite-wavelength mode are a pair of conjugate complex numbers, which means that the associated disturbances exhibit travelling-wave behaviour with a relatively small critical wavenumber. However, a sharp discontinuity is observed in the vicinity of point
 $P_{1}$
, and the wavenumber is significantly higher for the right of this point, where the Floquet exponent has a zero imaginary part and the corresponding modes are standing waves. The characteristics of the bifurcation point
 $P_{1}$
are qualitatively consistent with the results obtained by Gao & Lu (Reference Gao and Lu2008) in the study of oscillating Newtonian fluid films with surfactants. Thereafter, flow instability continues to be dominated by finite-wavelength disturbances in the form of standing waves until its neutral stability curve intersects with the second U-shaped neutral curve. Following this intersection, the long-wave mode once again resumes dominance. When
 $\beta$
reaches
 $5.08$
, the dominant instability mode switches once more from the long-wavelength to the finite-wavelength mode. After this finite-wavelength boundary intersects the third U-shaped neutral curve, the long-wave mode regains dominance until the finite-wavelength mode takes over again at
 $\beta =7.97$
. In the high-frequency interval
 $\beta \gt 7.97$
, the presence of viscoelasticity causes the neutral stability curve of the finite-wavelength instability to exhibit markedly different characteristics. First, in contrast to the Newtonian cases (Jia et al. Reference Jia, Xiao, Wang, Zhao and Xue2026), the critical Reynolds number
 $\textrm{Re}_{c}$
does not always monotonically increase with the imposed frequency, instead of showing a decreasing trend with increasing
 $\beta$
over the interval
 $9.1\lt \beta \lt 12.4$
. Meanwhile, the critical wavenumber corresponding to the finite-wavelength mode is gradually increasing with
 $\beta$
. Furthermore, two distinct finite-wavelength stability boundaries can be identified within this interval, corresponding to lower and higher critical wavenumbers. The two types of finite-wavelength boundaries intersect at bifurcation points
 $P_{2}$
and
 $P_{3}$
in figure 12(
 $a$
), corresponding to the frequency parameters
 $\beta =9.1$
and
 $\beta =11$
. Figure 12(
 $b$
) further reveals that, relative to the cases without viscoelasticity, the critical wavenumber also displays sharp discontinuities in the vicinity of the points. These discontinuous variations in critical wavenumber are attributed to the competition between different standing-wave modes, and similar bifurcation points and discontinuous phenomena have also been observed by Wang et al. (Reference Wang, Du, Xiao and Zhao2023). The competition mechanism will be analysed in more detail subsequently. Moreover, when the finite-wavelength boundary continues to extend into the frequency range of the fourth U-shaped neutral curve, the dominant mode remains the finite-wavelength mode. This indicates that, even as the flow enters the long-wave unstable interval in the high-frequency region, finite-wavelength instability may still occur, in which case the dominant instability mode is determined by the relative magnitudes of the critical Reynolds numbers corresponding to each mode.
For a higher viscoelastic parameter
 $M=0.002$
in figures 12(
 $c$
) and 12(
 $d$
), the critical Reynolds numbers and critical wavenumbers generally follow the previously mentioned trends. Consistent with the long-wave results in § 3, in the low-frequency interval
 $2.08\lt \beta \lt 4.61$
, the neutral stability curve of the finite-wavelength remains basically unaffected by viscoelasticity. What is more, the bifurcation point
 $P_{1}$
caused by the surfactant effects is still present at
 $\beta =2.3$
, and the corresponding frequency
 $\beta$
remains unchanged with variations in viscoelastic parameters. This further demonstrates that the stability of the liquid film under low-frequency oscillations and the associated surfactant-related mechanisms are not significantly affected by viscoelasticity. However, at
 $\beta =6.8$
, the critical Reynolds number
 $\textrm{Re}_{c}$
for the finite-wavelength mode starts to decrease with increasing
 $\beta$
as the viscoelastic parameter
 $M$
increases. In contrast to the results for a lower
 $M$
, there is just one finite-wavelength boundary and no longer any competition between standing-wave modes or the corresponding discontinuities in critical wavenumbers in the high-frequency region. This suggests that the competition between various standing-wave modes is suppressed by a higher viscoelastic parameter. Moreover, in the high-frequency range where
 $\beta \gt 7.4$
, the critical Reynolds numbers of the finite-wavelength mode and long-wave mode both significantly decrease, yet the extent of the unstable region greatly increases. This indicates that flow instability in the high-frequency region is enhanced by higher viscoelasticity.
At this stage, it should be emphasised that the discontinuities at
 $P_{1}$
,
 $P_{2}$
and
 $P_{3}$
in figure 12(
 $b$
) do not have the same physical origin. The point
 $P_{1}$
, located in the low-frequency region, is associated with the dominant critical mode transition induced by the surfactant effect, so that the critical Reynolds number
 $\textrm{Re}_{c}$
remains continuous whereas the corresponding critical wavenumber
 $k_{c}$
changes discontinuously. By contrast, the points
 $P_{2}$
and
 $P_{3}$
in the high-frequency region arise from the competition between different standing-wave modes. At these points, two neutral branches attain the same critical Reynolds number
 $\textrm{Re}_{c}$
but correspond to different critical wavenumbers
 $k_{c}$
, which gives rise to the discontinuities observed in figure 12(
 $b$
). For larger viscoelasticity, this standing-wave-mode competition is suppressed, and consequently only
 $P_{1}$
remains in figure 12(c,d).
To elucidate more clearly the bifurcation phenomenon resulting from the competition between various standing-wave modes previously described, we undertake a more comprehensive analysis of the distinct structural characteristics of critical parameter variations near the bifurcation points
 $P_{2}$
and
 $P_{3}$
in figure 12(
 $a$
). Typical neutral curves in the
 $k-\textrm{Re}$
plane for parameters
 $\omega =\sqrt {37}$
,
 $\gamma =1$
and
 $M=0.001$
are depicted in figures 13(
 $a$
) and 13(
 $b$
). The different curves in the figure correspond to distinct values of the imposed frequency parameter
 $\beta$
. The three curves in figure 13(
 $a$
) are all distributed near the bifurcation point
 $P_{2}$
identified in figure 12(
 $a$
), whereas figure 13(
 $b$
) illustrates typical neutral curves in proximity to
 $P_{3}$
. Firstly, around the bifurcation point
 $P_{2}$
, the three curves in figure 13(
 $a$
) correspond to
 $\beta$
values of
 $8.1$
,
 $9.1$
and
 $10.1$
, respectively. It is worth noting that at
 $\beta =9.1$
, the intersection point
 $P_{2}$
of the finite-wavelength branches is depicted in figure 12(
 $a$
). As shown in figure 13(
 $a$
), each neutral stability curve can be divided into left and right branches, with a local minimum present on each branch. At the point to the left of
 $P_{2}$
where
 $\beta =8.1$
, the local minimum on the left branch is lower than that on the right branch. Consequently, the critical state of the flow is represented by the minimum point on the left branch, with the associated critical parameters given by
 $\textrm{Re}_{c}=7632$
and
 $k_{c}=0.201$
. As
 $\beta$
increases, the left branch of the neutral curve ascends, whilst the right branch descends. At point
 $P_{2}$
, where
 $\beta =9.1$
, the two local minima of the neutral curve become aligned horizontally, resulting in a common critical Reynolds number of
 $\textrm{Re}_{c}=22541$
. Under this condition, the flow displays two different critical disturbance wavenumbers,
 $k_{c}=0.11$
and
 $k_{c}=2.64$
, which correspond to the intersection values noted at the wavenumber discontinuity in figure 12(
 $b$
). When
 $\beta$
increases further to
 $10.1$
, to the right of point
 $P_{2}$
, the critical state of the flow is instead determined by the local minimum on the right branch of the neutral curve. Regarding the neutral curves near point
 $P_{3}$
in figure 13(
 $b$
), those curves corresponding to varying values of
 $\beta$
exhibit qualitatively similar distribution properties. It should be noted that a more detailed analysis of the eigenvalue characteristics indicates that the Floquet exponents associated with both the left and right branches of the aforementioned neutral curves have zero imaginary parts, i.e. purely real eigenvalues, implying that the instability modes consistently exist as standing-wave modes. These results suggest that the bifurcation points
 $P_{2}$
and
 $P_{3}$
should not be interpreted as geometric intersections of neutral branches, but as switching points between two distinct standing-wave modes. At the bifurcation point, the two branches attain the same critical Reynolds number
 $\textrm{Re}_{c}$
, so that both modes are equally critical. However, because their corresponding
 $k_{c}$
values are different, a small variation in
 $\beta$
causes the dominant critical mode to switch from one standing-wave mode to the other, which appears as a discontinuous jump in the critical wavenumber. Thus, the bifurcation behaviour reflects a mode-selection mechanism between coexisting standing-wave instabilities rather than a simple change in the geometry. Moreover, the effect of viscoelasticity is to reorganise the relative dominance of these competing standing-wave modes, which explains why the bifurcation disappears at larger
 $M$
and reappears again under other parameter combinations. A comparable competition between standing-wave modes has also been defined by Wang et al. (Reference Wang, Du, Xiao and Zhao2023). By comparing with their results under single-frequency oscillation, it can be concluded that the presence of a bimodal structure of standing waves is caused by the viscoelastic effect, which is further intensified under quasi-periodic oscillatory conditions. Ultimately, figure 13(
 $c$
) presents typical neutral curves with
 $\omega =\sqrt {37}$
,
 $\gamma =1$
and a relatively large viscoelastic parameter
 $M=0.002$
. The two neutral curves displayed correspond to the cases
 $\beta =6$
and
 $\beta =9$
in figure 12(
 $c$
). Under the current parameter configuration, the global minimum of the neutral curves is controlled by the part of the left branch at small wavenumbers. This corresponds to the presence of only a single finite-wavelength boundary in figure 12(
 $c$
), revealing that increasing viscoelasticity can suppress the competition between standing-wave modes. Moreover, when viscoelasticity and quasi-periodic oscillation exist at the same time, whether the competition between standing-wave modes appears depends on the relative strength of their respective effects.
Typical neutral curves in the
 $k-\textrm{Re}$
plane with
 $\textit{Ca}=0.05$
,
 $\chi =1$
,
 $\omega =\sqrt {37}$
,
 $\gamma =1$
, and
 $M_{s}=0.01$
. (
 $a$
) Curves near
 $P_{2}$
for
 $M=0.001$
with
 $\beta =8.1$
(black line),
 $\beta =9.1$
(orange line) and
 $\beta =10.1$
(blue line). (
 $b$
) Curves near
 $P_{3}$
for
 $M=0.001$
with
 $\beta =10.22$
(black line),
 $\beta =11.02$
(orange line) and
 $\beta =11.82$
(blue line). (
 $c$
) Curves for
 $M=0.002$
with
 $\beta =6$
(black line) and
 $\beta =9$
(orange line).

Figure 14 shows the critical Reynolds number
 $\textrm{Re}_{c}$
and its associated critical wavenumber
 $k_{c}$
as functions of the imposed frequency
 $\beta$
for different frequency ratios of the quasi-periodic oscillation (
 $\omega =\sqrt {7}$
and
 $\sqrt {2}$
) at
 $M=0.002$
and
 $\gamma =1$
. These results can be combined with those for the frequency ratio
 $\omega =\sqrt {37}$
in figures 12(
 $c$
) and 12(
 $d$
) to collectively analyse the impact of the frequency ratio
 $\omega$
on the stability of a viscoelastic liquid film subjected to quasi-periodic oscillation. Figures 14(
 $a$
) and 14(
 $b$
) present the results with a frequency ratio of
 $\omega =\sqrt {7}$
. The overall trends of the critical Reynolds number and critical wavenumber continue to align with those previously outlined. However, by comparing with the results for the higher frequency ratio
 $\omega =\sqrt {37}$
in figures 12(
 $c$
) and 12(
 $d$
), it can be observed that decreasing the frequency ratio
 $\omega$
causes the bifurcation phenomenon to reappear within the finite-wavelength region, which is attributed to the competition between standing-wave modes. This indicates that a higher frequency ratio
 $\omega$
suppresses such modal competition effects. Simultaneously, as
 $\omega$
diminishes from
 $\sqrt {37}$
to
 $\sqrt {7}$
, the critical Reynolds number of the finite-wavelength mode within the mid-to-high-frequency range (
 $5.12\lt \beta \lt 15.91$
) increases significantly, and the extent of the stable region expands notably, demonstrating that a reduction in the frequency-ratio substantially enhances flow stability in this interval. Furthermore, reducing
 $\omega$
also results in a marked decrease in the critical wavenumber within the high-frequency range. Figures 14(
 $c$
) and 14(
 $d$
) depict the results for a further reduced frequency ratio
 $\omega =\sqrt {2}$
. In this case, over a relatively large frequency range (
 $2.09\lt \beta \lt 21.81$
), the instability of the oscillating liquid film is determined by finite-wavelength modes, with the bifurcation phenomena again appearing within the finite-wavelength boundary. In comparison with the cases at higher frequency ratios, the critical Reynolds number for the finite-wavelength mode at
 $\omega =\sqrt {2}$
further increases across a broader frequency range, signifying a continued enhancement in flow stability. The above results consistently imply that the frequency ratio has a significant effect on the stability of the liquid film under high-frequency oscillation.
Stability characteristics in the presence of surfactants with
 $\textit{Ca}=0.05$
,
 $\chi =1$
,
 $\gamma =1$
,
 $M=0.002$
and
 $M_{s}=0.01$
for different frequency ratios
 $\omega =\sqrt {7}$
(
 $a,b$
) and
 $\omega =\sqrt {2}$
(
 $c,d$
). Panels (
 $a,c$
) represent the stability boundaries in the
 $\beta -\textrm{Re}_{c}$
plane, and panels (
 $b,d$
) represent variation of the corresponding wavenumber
 $k_{c}$
with
 $\beta$
. The meanings of curves are consistent with figure 12.

Stability characteristics in the presence of surfactants with
 $\textit{Ca}=0.05$
,
 $\chi =1$
,
 $\omega =\sqrt {37}$
,
 $M=0.002$
and
 $M_{s}=0.01$
for different frequency ratios
 $\gamma =0.1$
(
 $a,b$
) and
 $\gamma =1.5$
(
 $c,d$
). Panels (
 $a,c$
) represent the stability boundaries in the
 $\beta -\textrm{Re}_{c}$
plane, and panels (
 $b,d$
) represent variation of the corresponding wavenumber
 $k_{c}$
with
 $\beta$
. The meanings of curves are consistent with figure 12.

Finally, the variations of the critical Reynolds number
 $\textrm{Re}_{c}$
and the corresponding critical wavenumber
 $k_{c}$
with the imposed frequency
 $\beta$
for different amplitude ratios of the quasi-periodic oscillation (
 $\gamma =0.1$
and
 $1.5$
) at
 $M=0.002$
and
 $\omega =\sqrt {37}$
are presented in figure 15. The results can also be integrated with those for the amplitude ratio
 $\gamma =1$
in figures 12(
 $c$
) and 12(
 $d$
) to systematically examine the influence of the amplitude ratio
 $\gamma$
on the stability of the liquid film. An analysis of the results for the three different amplitude ratios reveals that, in the low-frequency region, as
 $\gamma$
increases, the primary changes in the neutral curve occur in the long-wave region (as detailed in § 3), whereas the neutral curves of the finite-wavelength mode remain almost unaffected by the amplitude ratio
 $\gamma$
. In the high-frequency range, however, the critical Reynolds number for the finite-wavelength mode decreases significantly with increasing
 $\gamma$
, demonstrating that a larger
 $\gamma$
markedly enhances flow instability in this region. Likewise, the critical wavenumber in the high-frequency region also exhibits a significant increase. Moreover, no bifurcation phenomenon occurs at the finite-wavelength boundaries across varying amplitude ratios, indicating that changes in the amplitude ratio do not affect the competitive relationship between standing-wave modes. Furthermore, the location of the inflection point on the finite-wavelength boundary, due to the viscoelastic effect, remains unchanged with respect to the amplitude ratio and is consistently located at
 $\beta =6.96$
. The aforementioned results suggest that the influence of the amplitude ratio
 $\gamma$
on finite-wavelength modes in an oscillating liquid film is similarly significant in the high-frequency region.
6. Conclusion
In this work, we have investigated the linear instability of viscoelastic liquid film with insoluble surfactants on a quasi-periodic oscillation plane with two incommensurable frequencies. Floquet theory is applied to describe the combined effects of viscoelastic and quasi-periodic oscillation on the linear instability of oscillating liquid film in the presence of insoluble surfactant. For the unsteady basic flow, the time-dependent perturbation equations governing the stability of the viscoelastic liquid film are derived. Then, in the long-wave perturbation limit, the analytical solution to the eigenvalue problem is derived by the normal-mode decomposition and the asymptotic expansion. For the finite-wavelength regime, the time-dependent stability problem is solved numerically by utilising the Chebyshev spectral collocation method, wherein quasi-periodic boundary conditions are treated by approximating irrational frequency ratios with rational approximations. When
 $k\lt \lt 1$
, the long-wave theoretical solution is consistent with the finite-wavelength numerical solution, which proves the validity of the solution.
The flow is governed by eight dimensionless parameters: Reynolds number
 $\textrm{Re}$
; viscoelastic parameter
 $M$
; surface surfactant
 $M_{s}$
; Galileo number
 $\chi$
; capillary number
 $\textit{Ca}$
; Womersley number
 $\beta$
; the ratio of superimposed velocity amplitudes
 $\gamma$
; the ratio of the frequency
 $\omega$
. The present parametric study is mainly focused on the critical mode of the linear problem. The main conclusions of the analysis are as follows. For long-wavelength instability in the absence of gravity, the growth rates of the two most unstable modes caused by quasi-periodic oscillation increase with the increase of the viscoelastic parameter
 $M$
, and the unstable mode corresponding to
 $\omega _{2}$
is more significantly affected by viscoelasticity. When viscoelasticity and surfactant exist simultaneously, the stability of the oscillating liquid film depends on the competition between the two. When gravity does not exist, the
 $\beta -M_{S}$
parameter plane exhibits alternating bands of stability and instability. The influence of the viscoelastic effect is more significant in the high-frequency region, and it presents a dual effect. As the frequency ratio
 $\omega$
decreases, the flow instability is suppressed, and the unstable region broadens and shifts toward larger values of
 $\beta$
. As the amplitude ratio
 $\gamma$
increases, a small additional stable region appears in the range of
 $0.7\lt \beta \lt 1$
, and this zone is gradually absorbed into a larger stable region as
 $\gamma$
continues to increase.
When considering the effect of gravity, the U-shaped neutral curves with separate bandwidth appear, representing the long-wave instability. On the one hand, viscoelasticity has little effect on the stability of the low-frequency oscillation liquid film; however, it exhibits a dual regulation mechanism that initially promotes instability, subsequently enhances stability and finally promotes instability again on the stability of the high-frequency oscillation liquid film. On the other hand, the comparison with results under Newtonian fluid conditions (Jia et al. Reference Jia, Xiao, Wang, Zhao and Xue2026) demonstrates that viscoelasticity exerts a significant modulation effect on the influences of different frequency ratio
 $\omega$
and amplitude ratio
 $\gamma$
on the neutral curve in the high-frequency region. When the frequency ratio
 $\omega \gt 1$
, the instability in the low-frequency range exhibits little sensitivity to variations of the frequency ratio, whereas the long-wave stability in the high-frequency region is significantly enhanced with decreasing
 $\omega$
. On the contrary, when
 $\omega \lt 1$
, the influence of frequency ratios on long-wave instability is mainly concentrated in the low-frequency region, while the stability in the high-frequency region is only weakly sensitive to the frequency ratios. In addition, increasing the amplitude ratio
 $\gamma$
will enhance the long-wave instability and merge the two initially separate U-shaped neutral stability curves in the low-frequency region into a single curve. The above results reveal a distinct alteration in the stability behaviour of the system and highlight the nuanced response of the system.
For finite-wavelength instability, we primarily analysed the influence of different viscoelastic parameters
 $M$
, frequency ratio
 $\omega$
and amplitude ratio
 $\gamma$
on the critical Reynolds number and critical wavenumber. The results reveal that finite-wavelength modes can emerge in parameter regimes where long-wave disturbances are stable, forming a complex instability structure characterised by alternating dominance between long-wave and finite-wavelength mechanisms. Different from the results of Jia et al. (Reference Jia, Xiao, Wang, Zhao and Xue2026), the critical Reynolds number of the finite-wavelength mode presents a non-monotonic trend due to the existence of viscoelasticity, and the bifurcation phenomenon of two different finite-wavelength stability boundaries appears in the high-frequency region under a smaller
 $M$
. The subsequent analysis shows that the bifurcation phenomenon is attributed to the competition between different standing-wave modes. However, there is only one finite-wavelength stability boundary at a larger
 $M$
, indicating that enhanced viscoelasticity can suppress the competition of standing-wave modes. Meanwhile, increasing
 $M$
significantly enhances the finite-wavelength instability in the high-frequency region. In addition, decreasing frequency ratio
 $\omega$
also enhances the instability of finite-wavelength modes while promoting the competition of standing-wave modes; thereby the bifurcation phenomenon of the finite-wavelength boundary appears again in the high-frequency region.
Although only infinitesimal disturbances are considered in this paper, the current configuration can be extended to analyse the finite-amplitude instability. This paper focuses on the parametric investigations of the growth rate and the neutral stability curve, but the physical mechanism behind the instability needs to be further revealed, which is the focus of the follow-up work. For the non-Newtonian flow, only Walter’s liquid
 $B''$
is considered in this paper, and the stability study of other rheological models is also necessary. Extensions to more general surfactant models, especially soluble surfactants with interfacial exchange, are also of considerable interest. The present work is confined to the linear stability problem, however, nonlinear studies will also be a focus of future research. Furthermore, experimental or numerical simulation data are essential to complement the theoretical results, which also represents an important direction for future research. Despite the limitations of the present analysis, we anticipate that the results provided in this paper may provide valuable insight and serve as a reference point for future studies on transition to turbulence in flow systems under quasi-periodic wall oscillations.
Acknowledgements
The authors would like to thank the anonymous referees for their suggestions to improve work considerably.
Funding
This work was supported by the Natural Science Foundation of China (Nos. 12572289, 12402301, 12372248).
Declaration of interests
The authors have no conflict to disclose.
Appendix A
The expressions of
 $h_{1}(\tau )$
and
 $\xi _{1}(\tau )$
, obtained from the Orr–Sommerfeld system of the order
 $O(k)$
(3.13)–(3.16), are shown as
 \begin{align} h_{1}=&-\frac {\mathrm{i}\textrm{Re}}{2\beta ^{2}}h_{0}\mathrm{Im}\left [\frac {1}{\cosh ^{2}[\varOmega _{1}(1+\mathrm{i}S_{1})]} \mathrm{e}^{{i}q\tau }\right ]\notag \\[3pt]&-\gamma \frac {\mathrm{i}\textrm{Re}}{2\omega \beta ^{2}}h_{0}\mathrm{Im}\left [\frac {1}{\cosh ^{2}[\varOmega _{2}(1+\mathrm{i}S_{2})]} \mathrm{e}^{{i}p\tau }\right ]\!, \\[-12pt]\nonumber \end{align}
 \begin{align} \xi _{1} =&-\frac {\mathrm{i}\textrm{Re} }{2\beta ^{2}}\xi _{0}\mathrm{Im}\left [\frac {1}{\cosh [\varOmega _{1}(1+\mathrm{i}S_{1})]} \mathrm{e}^{{i}q\tau }\right ]-\gamma \frac {\mathrm{i}\textrm{Re}}{2\omega \beta ^{2}} \xi _{0}\mathrm{Im}\left [\frac {1}{\cosh [\varOmega _{2}(1+\mathrm{i}S_{2})]} \mathrm{e}^{{i}p\tau }\right ]\notag \\[3pt]&+\frac {\mathrm{i}\textrm{Re} }{2\beta ^{2}}h _{0}\mathrm{Im}\left [\frac {\varOmega _{1}(1+\mathrm{i}S_{1})\sinh [\varOmega _{1}(1+\mathrm{i}S_{1})]}{\cosh ^{2}[\varOmega _{1}(1+\mathrm{i}S_{1})]} \mathrm{e}^{{i}q\tau }\right ]\notag \\[3pt]&+\gamma \frac {\mathrm{i}\textrm{Re} }{2\omega \beta ^{2}}h _{0}\mathrm{Im}\left [\frac {\varOmega _{2}(1+\mathrm{i}S_{2})\sinh [\varOmega _{2}(1+\mathrm{i}S_{2})]}{\cosh ^{2} [\varOmega _{2}(1+\mathrm{i}S_{2})]} \mathrm{e}^{{i}p\tau }\right ]\!. \end{align}
Here,
 $\mathrm{Im}[\boldsymbol{\cdot }]$
represents the imaginary part of that complex function.
Appendix B
These coefficients in (3.18) can be determined by the boundary conditions and are expressed as
 \begin{align} C_{0}=-\mathrm{i}\frac {2\chi }{3} h_{0}-\mathrm{i}\frac {M_{s}{\textrm{Re}}^{2}}{2} \xi _{0}+\frac {\mathrm{i}{\textrm{Re}}^{2}A_{1}^{2}(1+\kappa _{1}^{2})}{\beta ^{2}}&(Q_{1}-R_{1})h_{0} \notag \\+\gamma ^{2}&\frac {\mathrm{i}{\textrm{Re}}^{2}A_{2}^{2}(1+\kappa _{2}^{2})}{\omega \beta ^{2}}(Q_{2}-R_{2})h_{0}, \end{align}
 \begin{align} C_{1}=-\mathrm{i}\chi h_{0}-\mathrm{i}M_{s}{\textrm{Re}}^{2} \xi _{0}+\frac {\mathrm{i}{\textrm{Re}}^{2}A_{1}^{2}(1+\kappa _{1}^{2})}{\beta ^{2}} &Q_{1}h_{0}+\gamma ^{2}\frac {\mathrm{i}{\textrm{Re}}^{2}A_{2}^{2}(1+\kappa _{2}^{2})}{\omega \beta ^{2}} Q_{2}h_{0}, \end{align}
 \begin{align} C_{2}=-\mathrm{i}\frac {M_{s}{\textrm{Re}}^{2}}{2} \xi _{0},\qquad &C_{3}=\mathrm{i}\frac {\chi }{3} h_{0}, \end{align}
 \begin{align} L_{0}=\frac {\mathrm{i}A_{1}^{2}(1+\kappa _{1}^{2})(1-4M^{2}\beta ^{4})}{8\beta ^{2}S_{1}^{2}} \tanh [\varOmega _{1}(1+\mathrm{i}S_{1})]&\Big \{S_{1}^{4}\sinh (2\varOmega _{1}y)+\mathrm{i}\sin (2\varOmega _{1}S_{1}y)\Big \} \notag \\ +\gamma ^{2}\frac {\mathrm{i}A_{2}^{2}(1+\kappa _{2}^{2})(1-4M^{2}\omega ^{2}\beta ^{4})}{8\omega \beta ^{2}S_{2}^{2}} \tanh [\varOmega _{2}(1+\mathrm{i}&S_{2})]\Big \{S_{2}^{4}\sinh (2\varOmega _{2}y)+\mathrm{i}\sin (2\varOmega _{2}S_{2}y)\Big \}, \end{align}
 \begin{align} L_{1}=\frac {\mathrm{i}A_{1}^{2}(1+\kappa _{1}^{2})}{2\beta ^{2}} \frac {\cosh [\varOmega _{1}(1+\mathrm{i}S_{1})y]}{\cosh [\varOmega _{1}(1-\mathrm{i}S_{1})]}+\gamma ^{2}&\frac {\mathrm{i}A_{2}^{2}(1+\kappa _{2}^{2})}{2\omega \beta ^{2}} \frac {\cosh [\varOmega _{2}(1+\mathrm{i}S_{2})y]}{\cosh [\varOmega _{2}(1-\mathrm{i}S_{2})]} , \end{align}
where the expressions of
 $A_{1}$
,
 $A_{2}$
,
 $\kappa _{1}$
,
 $\kappa _{2}$
,
 $Q_{1}$
,
 $Q_{2}$
,
 $R_{1}$
and
 $R_{2}$
are of the form
 \begin{align} A_{1}=\frac {\cos (\varOmega _{1}S_{1})\cosh (\varOmega _{1})}{2[\cos ^{2}(\varOmega _{1}S_{1})+\sinh ^{2}\varOmega _{1}]} ,&\quad A_{2}=\frac {\cos (\varOmega _{2}S_{2})\cosh (\varOmega _{2})}{2[\cos ^{2}(\varOmega _{2}S_{2})+\sinh ^{2}\varOmega _{2}]} , \end{align}
 \begin{align} \kappa _{1}=\tan (\varOmega _{1}S_{1})\tanh \varOmega _{1},&\quad \kappa _{2}=\tan (\varOmega _{2}S_{2})\tanh \varOmega _{2}, \end{align}
 \begin{align} Q_{1}=\textrm{Re}\biggl [\frac {\mathrm{i}\varOmega _{1}}{2S_{1}}\tanh [\varOmega _{1}(1+\mathrm{i}S_{1})][S_{1}^{3}&\cosh 2\varOmega _{1}+\mathrm{i}\cos (2\varOmega _{1}S_{1})] (1-4M^{2}\beta ^{4})\notag \\&-\frac {(1+S_{1}^{2})\varOmega _{1}\sinh [\varOmega _{1}(1+\mathrm{i}S_{1})]}{(S_{1}+\mathrm{i})\cosh [\varOmega _{1}(1-\mathrm{i}S_{1})] } \biggr ], \end{align}
 \begin{align} Q_{2}=\textrm{Re}\biggl [\frac {\mathrm{i}\varOmega _{2}}{2S_{2}}\tanh [\varOmega _{2}(1+\mathrm{i}S_{2})][S_{2}^{3}&\cosh 2\varOmega _{2}+\mathrm{i}\cos (2\varOmega _{2}S_{2})] (1-4M^{2}\omega ^{2} \beta ^{4})\notag \\&-\frac {(1+S_{2}^{2})\varOmega _{2}\sinh [\varOmega _{2}(1+\mathrm{i}S_{2})]}{(S_{2}+\mathrm{i})\cosh [\varOmega _{2}(1-\mathrm{i}S_{2})] } \biggr ], \end{align}
 \begin{align} R_{1}=\textrm{Re}\biggl [\frac {\mathrm{i}}{4S^{2}_{1}}\tanh [\varOmega _{1}(1+\mathrm{i}S_{1})][S_{1}^{4}&\sinh 2\varOmega _{1}+\mathrm{i}\sin (2\varOmega _{1}S_{1})] (1-4M^{2}\beta ^{4})\notag \\ &\qquad \qquad \quad +\mathrm{i}\frac {\cosh [\varOmega _{1}(1+\mathrm{i}S_{1})]}{\cosh [\varOmega _{1}(1-\mathrm{i}S_{1})] } \biggr ], \end{align}
 \begin{align} R_{2}=\textrm{Re}\biggl [\frac {\mathrm{i}}{4S^{2}_{2}}\tanh [\varOmega _{2}(1+\mathrm{i}S_{2})][S_{2}^{4}&\sinh 2\varOmega _{2}+\mathrm{i}\sin (2\varOmega _{2}S_{2})] (1-4M^{2}\omega ^{2}\beta ^{4})\notag \\ &\qquad \qquad \quad +\mathrm{i}\frac {\cosh [\varOmega _{2}(1+\mathrm{i}S_{2})]}{\cosh [\varOmega _{2}(1-\mathrm{i}S_{2})] } \biggr ]. \end{align}
Appendix C
The explicit forms of
 $I_{1}$
in (3.21) and
 $I_{2}$
in (3.22) are given as
 \begin{align} I_{1} =\frac {{\textrm{Re}}^{2}A_{1}^{2}(1+\kappa _{1}^{2})}{\beta ^{2}}(Q_{1}-R_{1})&+\gamma ^{2} \frac {{\textrm{Re}}^{2}A_{2}^{2}(1+\kappa _{2}^{2})}{\omega \beta ^{2}}(Q_{2}-R_{2}), \end{align}
 \begin{align} I_{2} =\frac {{\textrm{Re}}^{2}A_{1}^{2}(1+\kappa _{1}^{2})}{\beta ^{2}}Q_{1}+{\textrm{Re}}^{2}T_{1}&+\gamma ^{2} \frac {{\textrm{Re}}^{2}A_{2}^{2}(1+\kappa _{2}^{2})}{\omega \beta ^{2}}Q_{2}+\gamma ^{2}{\textrm{Re}}^{2}T_{2}, \end{align}
with
 \begin{align} T_{1}=\varOmega _{1}[(1+2S_{1}^{2})\sinh (2\varOmega _{1})&+(S_{1}^{3}+2S_{1})\sin (2\varOmega _{1}S_{1})-4M^{2}\beta ^{4}\sinh (2\varOmega _{1})\notag \\-4M^{2}S_{1}^{3}\beta ^{4}\sin (2\varOmega _{1}S_{1})]&/4S_{1}\beta ^{2}[\cosh (2\varOmega _{1})+\cos (2\varOmega _{1}S_{1})]^{2} , \end{align}
 \begin{align} T_{2}=\varOmega _{2}[(1+2S_{2}^{2})\sinh (2\varOmega _{2})&+(S_{2}^{3}+2S_{2})\sin (2\varOmega _{2}S_{2})-4M^{2}\omega ^{2}\beta ^{4}\sinh (2\varOmega _{2})\notag \\-4M^{2}S_{2}^{3}\omega ^{2}\beta ^{4}\sin (2\varOmega _{2}S_{2})]&/4S_{2}\omega \beta ^{2}[\cosh (2\varOmega _{2})+\cos (2\varOmega _{2}S_{2})]^{2} , \end{align}
where the forms of the coefficients
 $A_{1}$
,
 $A_{2}$
,
 $\kappa _{1}$
,
 $\kappa _{2}$
,
 $Q_{1}$
,
 $Q_{2}$
,
 $R_{1}$
and
 $R_{2}$
are also given in Appendix B.

 η∗
 g

 θ/Re2
 β
 χ=0
 Re=200
 ω=37
 γ=1
 a
 Ms=0.005
 b
 Ms=0.001
 M=0
 M=0.003
 M=0.007

 M
 β−Ms
 χ=0
 Re=200
 ω=37
 γ=1
 a
 M=0
 b
 M=0.001
 c
 M=0.0015
 d
 M=0.002
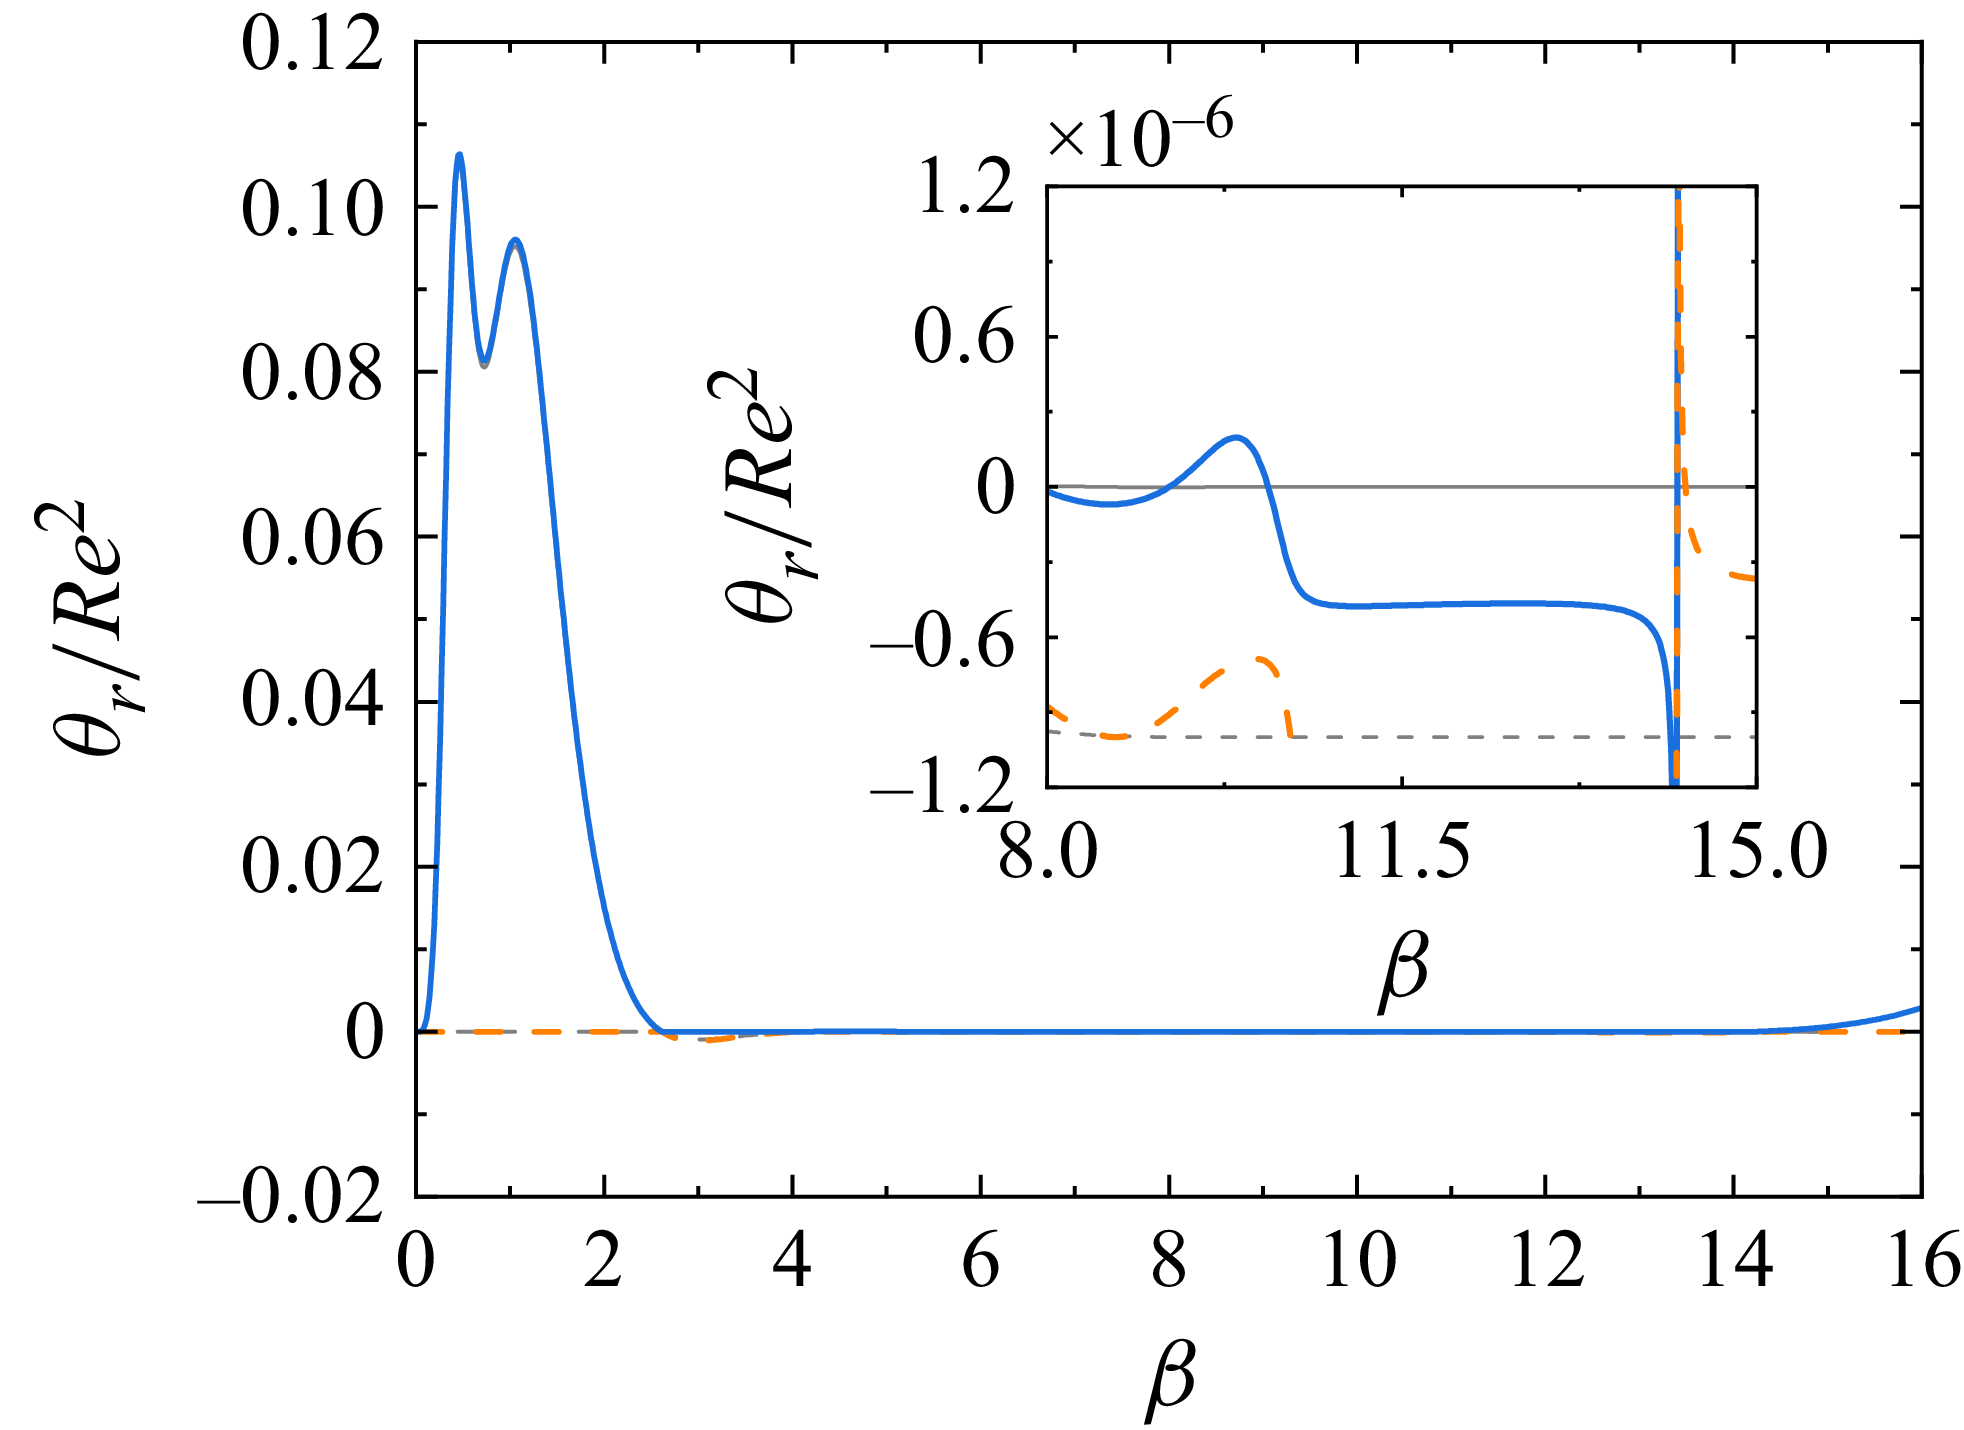
 θ/Re2
 β
 χ=0
 Re=200
 ω=37
 γ=1
 Ms=10−6
 M=0
 a
 M=0.0015
 c

 ω
 β−Ms
 χ=0
 Re=200
 γ=1
 M=0.001
 a
 ω=37
 b
 ω=7
 c
 ω=2
 d
 ω=1/2
 e
 ω=1/7
 f
 ω=1/37

 γ
 β−Ms
 χ=0
 Re=200
 ω=37
 M=0.001
 a
 γ=0.1
 b
 γ=1.5
 c
 γ=2
 d
 γ=3

 θ/Re2
 β
 χ=0
 Re=200
 ω=37
 M=0.001
 Ms=0.3
 γ=1.5
 γ=2
 γ=3

 a
 Re−β
 χ=1
 ω=37
 γ=1
 Ms=0.01
 M=0
 M=0.001
 M=0.0015
 M=0.002
 b
 Re=105
 θ/Re2
 β
 a
 9<β<15
 M=0
 M=0.001
 M=0.0015
 M=0.002

 Re−β
 χ=1
 γ=1
 M=0.002
 Ms=0.01
 a
 ω=37
 ω=7
 ω=2
 b
 ω=1/37
 ω=1/7
 ω=1/2

 Re−β
 χ=1
 γ=0.1
 γ=1
 γ=1.5
 a
 ω=37
 M=0.002
 Ms=0.01
 b
 ω=1/37
 M=0.001
 Ms=10−6

 N
 K
 Re=200
 β=3
 χ=1
 Ca=0.05
 ω=7
 γ=1
 Ms=0.001
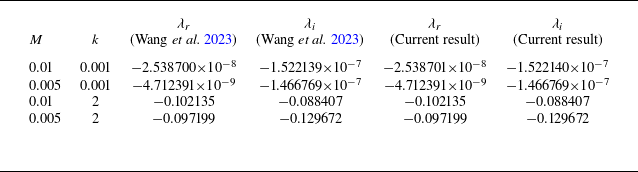
 λr
 λi
 Re=100
 χ=1
 Ca=0.05
 β=6
 Ms=0.001
 γ=0

 Re=200
 χ=1
 Ca=0.05
 M=10−3
 Ms=10−2
 ω=7
 γ=1
 λ
 β=2
 λr
 λi
 β=3
 λ1
 λ2

 Ca=0.05
 χ=1
 ω=37
 γ=1
 Ms=0.01
 M=0.001
 a,b
 M=0.002
 c,d
 a,c
 β−Rec
 b,d
 kc
 β
 P1
 P2
 P3

 k−Re
 Ca=0.05
 χ=1
 ω=37
 γ=1
 Ms=0.01
 a
 P2
 M=0.001
 β=8.1
 β=9.1
 β=10.1
 b
 P3
 M=0.001
 β=10.22
 β=11.02
 β=11.82
 c
 M=0.002
 β=6
 β=9

 Ca=0.05
 χ=1
 γ=1
 M=0.002
 Ms=0.01
 ω=7
 a,b
 ω=2
 c,d
 a,c
 β−Rec
 b,d
 kc
 β

 Ca=0.05
 χ=1
 ω=37
 M=0.002
 Ms=0.01
 γ=0.1
 a,b
 γ=1.5
 c,d
 a,c
 β−Rec
 b,d
 kc
 β


