

1. Introduction
It is widely known that institutional structures constrain the actions of elected officials, yet less is known about how the types of elected officials affect policy choices. As Besley (Reference Besley2005) and Jones and Olken (Reference Jones and Olken2005) point out, implicit in most of the previous work is the assumption that politicians act in a similar fashion under a certain institutional rule, no matter who they are. In other words, previous research neglects the possibility that the personal characteristics of politicians also constrain their actions in the democratic policymaking process, which then affect policies. As Key (Reference Key1949: 10) notes, ‘the nature of the working of government depends ultimately on the men who run it. The men we elect to office and the circumstances we create that affect their work determine the nature of popular government’.
Politicians differ along a variety of dimensions, such as their preferences and competence (Besley, Reference Besley2005). Previous research has found that policy preferences reflected in a politician's identity such as gender and race are associated with particular policy choices (Chattopadhyay and Duflo, Reference Chattopadhyay and Duflo2004; Lublin, Reference Lublin1997). The personal ideology of the members of US Congress plays a pivotal role in their roll-call voting patterns (Levitt, Reference Levitt1996). The political competence of politicians refers to the ability to achieve desired policies at a minimum social cost (Caselli and Morelli, Reference Caselli and Morelli2004) and is equivalent to individual abilities required for certain non-political jobs (Besley, Reference Besley2005).Footnote 1 In fact, Jones and Olken (Reference Jones and Olken2005) show that some national leaders have the ability to achieve a higher rate of economic growth.
This article focuses on another dimension of personal features that characterize politicians. Specifically, we study dynastic politicians with inherited political resources. Political positions are no longer hereditary in modern democracies, but political dynasties continue to exist. Some democracies allow for ‘the de facto inheritance of political power’ (Dal Bo et al., Reference Dal Bo, Dal Bo and Snyder2009: 116). Dynastic politicians, whose family members have also held similar political positions in the past, have occupied a sizable portion of political offices in many parts of the world.Footnote 2 Despite the persistence of political dynasties in many democratic countries, little is known about the political consequences of dynastic legislators. Does the presence of political dynasties have any impact on electoral competitiveness and policy outcomes? If so, how? What is a normative implication of their presence for the democratic political process?
Only a few prior studies offer answers to these questions. Using data on political dynasties in the United States, Dal Bo et al. (Reference Dal Bo, Dal Bo and Snyder2009) show that legislators who served for multiple terms increase the probability that their relatives are elected for the same office in the future. This is partly because political capital, such as name recognition and ties with political machines, can be inherited within families. Feinstein (Reference Feinstein2010) shows that dynastic politicians receive an additional 4% increase in the two-party vote share in congressional elections because of their brand name advantage.
This article offers a new theory and evidence for the political consequences of dynastic politicians. We ask whether dynastic politicians with electoral and bargaining advantages undermine the role of electoral competition as a device for achieving desirable policies for the citizens. Unlike the prior works on political dynasties in the United States (Dal Bo et al., Reference Dal Bo, Dal Bo and Snyder2009; Feinstein Reference Feinstein2010) or works on Japanese dynastic legislators (Asano, Reference Asano2006; Ishibashi and Reed, Reference Ishibashi and Reed1992; Taniguchi, Reference Taniguchi, Martin and Steel2008; Smith, Reference Smith2012), we develop a formal model of dynastic politicians and then empirically test a few implications from the model. Another notable feature of this article is that we examine the influence of dynastic politicians on a variety of political consequences such as electoral competitiveness, policy choices, and economic performance.
The first part of this article develops a model that shows when dynastic candidates with inherited electoral and bargaining advantages crowd out non-dynastic candidates and how their dynastic status affects policy decisions on distributive benefits. Our model combines the citizen candidate model (Osborne and Slivinski, Reference Osborne and Slivinski1996; Besley and Coate, Reference Besley and Coate1997) and the legislative bargaining model (Baron and Ferejohn, Reference Baron and Ferejohn1989).Footnote 3 Building on the assumptions that dynastic politicians enjoy higher bargaining power and lower cost of running for office, our model predicts the following: (1) dynastic legislators bring more distributions to the district than non-dynastic legislators; (2) dynastic candidates enjoy a higher probability of winning and a higher vote share; (3) dynastic legislators harm the economic performance of the districts despite the larger amount of distributive benefits they bring to their constituents because dynastic legislators spend the amount on a small fraction of people in the district.
The second part of the article offers an empirical test for the predictions from the model using data on Japanese politicians. Japan is an ideal case for this study because dynastic legislators occupy a sizable portion of the Japanese parliament. Seven out of 11 prime ministers in the last two decades were a dynastic legislator. For example, Jyunnichiro Koizumi, who served as a prime minister between 2001 and 2006 had a grandparent who was a legislator in the Lower House. Shinzo Abe is a son of Shintaro Abe who was one of the major leaders of the LDP in the 1980s. On average, 20% to 30% of legislators in the Lower House have been from families of political dynasties in the last few decades. In addition, detailed data on the family background of dynastic politicians as well as on fiscal transfers, election outcomes, and economic growth are available, which enables us to test the predictions of the model. Our analysis using an instrumental variable shows that dynastic politicians deliver a larger amount of distributive benefits to their districts, compared to non-dynastic politicians. We also find that the presence of dynastic legislators suppresses the level of electoral competition and that dynastic legislators with abundant electoral resources lower the rate of economic growth in their districts.
2. The model
This section presents a simple model of how dynastic legislators with inherited resources affect electoral competitiveness and policy choices. To simplify our discussion, we analyze the behavior of candidates and voters in a single electoral district, holding electoral outcomes in the other districts fixed.Footnote 4 In addition, we assume that there are two potential candidates in a district who decide whether to run for office.Footnote 5 One of the candidates is a dynastic candidate, while the other potential candidate is non-dynastic.
We consider a subgame perfect equilibrium. The timing of the game is described as follows:
1. The two potential candidates decide whether to run.
2. Candidates who decide to run announce a campaign platform.
3. There is a size one continuum of voters in the district. These voters choose one of the candidates.
4. Elected legislators bargain over the distribution of benefits.
5. The legislator spends the distribution on policies.
The next subsection illustrates the details of our settings on policies and elections. The remaining subsections derive an equilibrium and draw empirical implications. See Appendix 1 for the list of variables in our model.
2.1 Setting
2.1.1 Policy
Our model considers a policy on the distribution of benefits. This policy is a product of bargaining in the legislature, which has an odd number of members, L ≥ 3, who are elected from the L districts. At the beginning of the legislative process, one of the L legislators is chosen as an agenda setter with probability pl, where ∑Ll = 1pl = 1.
Denote pj as the probability that a type-j legislator becomes an agenda setter, where j is either dynastic (D) or non-dynastic (N), and assume that pD = αpN. The value of α captures the bargaining power of dynastic legislators in the legislature when the power of non-dynastic legislators is normalized to 1. We assume α > 1, which means pD > pN. This assumption is justifiable because dynastic legislators are in a position to inherit from their family members two resources such as (1) personal ties with major political figures in the legislative process (e.g., party leaders, bureaucrats, and special interest groups) and (2) skills and knowledge on the policy-making process. These distinctive features of dynastic legislators allow them to ascend the party hierarchy more quickly and enjoy larger bargaining power. We call this assumption the bargaining advantage.Footnote 6
The probability of being an agenda setter depends on the number of dynastic legislators in the legislature. Denote n ∈ [0, L − 1] as the number of dynastic legislators elected from all other districts. If the district elects a dynastic candidate, the total number of dynastic legislators in the legislature is n + 1. Otherwise, the number of dynastic candidates is n. Accordingly, the probability that a non-dynastic legislator becomes an agenda setter is pN = 1/[L + (α − 1)n]. The probability of a dynastic legislator is pD = α/[L + (α − 1)(n + 1)].
After the agenda setter proposes the distribution, d = (d 1, . . ., dL), of the pool of non-negative distributive benefits, where ∑Ll = 1dl = 1, dl ⩾ 0, legislators vote to approve or reject d. If the proposal of d is approved by at least (L − 1)/2 legislators, legislators and their districts receive the benefits specified in the proposal. If it is defeated, a default distribution with distribution 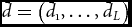 $\skew3\bar{d} = \left( {\skew3\bar{d}_1 , \ldots ,\skew3\bar{d}_L } \right)$ is implemented, and we assume that
 $\skew3\bar{d}_l = \skew3\bar{d} \ge 0$ for all l = 1, ..., L and
 $\sum_{l = 1}^L \skew3\bar{d}_l < 1$. That is, the total amount of default distributions is less than the total amount of distributions proposed by the agenda setter, so it is less efficient. This is an ultimatum game with a closed rule, as in Baron and Ferejohn (Reference Baron and Ferejohn1989).
The legislator spends the benefits from the approved policy in his/her district. Suppose that the legislator allocates the distribution to policies g and r, where g + r = dl in his/her district. Policy g will benefit a size one continuum of all voters in the district, which means that the payoff for each voter is g and that the sum of the payoffs for all voters is also g. In contrast, policy r benefits only a fraction of the voters belonging to the support group of the legislator (or only the legislator enjoys this benefit). We refer to policy r as rent. We assume that g = (1 − λ)dl and r = λdl. The value of λ ∈ [0, 1] is the ratio of rents chosen by the legislator. Denote dj as the expected amount of distribution delivered by a type-j legislator to the district, and λj as the ratio of rents chosen by a type-j legislator.Footnote 7
Following Besley et al. (Reference Besley, Persson and Sturn2010), we interpret g to be a growth policy aimed at improving the socioeconomic infrastructure and expanding job opportunities in the entire district, thus leading to higher economic performance. On the other hand, r is interpreted as a rent policy that cares about the economic benefits for the limited segment of the electorate in the district, making no contribution to the economic performance of the district.Footnote 8 Thus, if a legislator sets a lower λ, the distributive benefits he/she delivers to the district have a larger (and supposedly positive) effect on the economic performance of the district. Conversely, a higher value of λ means the distributive benefits contribute less to the economic performance of the entire district.
2.1.2 Election
We consider an election in which a winner is decided by a plurality rule, with ties being settled using an equal-probability rule. If only one candidate runs for the election, this candidate wins with certainty. In this election, voters vote sincerely. Thus, they play only weakly undominated strategies. We analyze voters’ behavior by extending the probabilistic voting model of Persson and Tabellini (Reference Persson and Tabellini2000).
The voters’ payoff from a candidate depends on two items: the size of policy g and the type of candidates. Voter i's payoff is defined as (1 − λD)dD + ωi when a dynastic candidate wins, and as (1 − λN)dN when a non-dynastic candidate wins. The variable ωi represents voter i’s preference for a type of candidate (i.e., dynastic or non-dynastic) and the valence of candidates (e.g., personality and party affiliation). If (1 − λD)dD = (1 − λN)dN, voter i prefers a dynastic candidate when ωi > 0, and prefers a non-dynastic candidate when ωi < 0. We assume that ωi is uniformly distributed on [γ − 1/(2ϕ), γ + 1/(2ϕ)] where ϕ represents the degree of preference homogeneity within the district. The random variable γ represents an aggregate popularity shock and is uniformly distributed on [ − 1/(2ξ), 1/(2ξ)]. It is realized after the candidates announce their policy platforms. That is, candidates are uncertain about the change of voters’ preference between platform choice and the election. Voter i votes for a dynastic candidate whenever ωi + (1 − λD)dD − (1 − λN)dN > 0. Then, we define the (random) share of voters who support a dynastic candidate as ϕ[(1 − λD)dD − (1 − λN)dN + γ + 1/(2ϕ)].
Given the uniform distribution of γ, the probability that a dynastic candidate wins, denoted as π(λD, λN), is
 \begin{eqnarray*}
&&\pi \left( {\lambda _D ,\lambda _N } \right) \\
&&\quad= \left\{\begin{array}{c@{\hspace*{7pt}}l}
1 & {{\rm if}\xi \left[ {\left( {1 - \lambda _D } \right)d_D - \left( {1 - \lambda _N } \right)d_N } \right] > \frac{1}{2}} \\
0 & {{\rm if}\xi \left[ {\left( {1 - \lambda _D } \right)d_D - \left( {1 - \lambda _N } \right)d_N } \right] < - \frac{1}{2}} \\
{\frac{1}{2} + \xi \left[ {\left( {1 - \lambda _D } \right)d_D - \left( {1 - \lambda _N } \right)d_N } \right].} & {} \\
\end{array}
\right.\\
\end{eqnarray*}
Otherwise, because the condition for the victory of a dynastic candidate, assuming an interior solution, is ϕ[(1 − λD)dD − (1 − λN)dN + γ + 1/(2ϕ)] > 1/2. This is rewritten as γ > −[(1 − λD)dD − (1 − λN)dN]. If only one candidate runs, voters vote on this candidate, and this candidate wins with certainty.
We now consider the decision candidates make on whether to run. Candidates are office motivated and rent-seeking. The benefit from holding office is v > 0, which is not related to a policy. Candidates also benefit from a rent policy, r = λjdj. We assume that candidates can obtain r if they win. Note that even if candidates obtain a positive benefit that is not the same as r, the result does not change as long as they obtain a part of r. Candidates announce and commit to the amount of distributions that will be allocated to the growth policy, 1 − λ, before voting. Denote Vj as the expected benefit of a type-j candidate. Then, the respective expected benefits of dynastic and non-dynastic candidates are
 \begin{equation}
V_D \equiv \pi \left( {\lambda _D ,\lambda _N } \right)\left( {\lambda _D d_D + v} \right),
\end{equation}
 \begin{eqnarray}
V_N \equiv \left[ {1 - \pi \left( {\lambda _D ,\lambda _N } \right)} \right]\left( {\lambda _N d_N + v} \right).\end{eqnarray}
If dynastic and non-dynastic candidates decide to run, they have to pay the cost of running, cD and cN, respectively. We assume that the cost is higher for non-dynastic candidates than for dynastic candidates (i.e., cD < cN). This assumption is drawn from some observable features of dynastic candidates. First, dynastic candidates can inherit a well-organized support group from their relative. The support group helps candidates mobilize voters in elections. Second, dynastic candidates can inherit financial resources from their relative. Third, constituents easily recognize the name of dynastic candidates (Feinstein, Reference Feinstein2010).Footnote 9 These advantages decrease the cost of running for dynastic candidates, but increase the cost of running for competing non-dynastic candidates. We call this assumption the electoral advantage.Footnote 10
In addition, we assume the following:
Assumption 1cD < 1/(4ξ).
This assumption means that a dynastic candidate decides to run even if this candidate has no bargaining advantage (α = 1).Footnote 11 If this assumption is dropped, there may exist an unrealistic equilibrium in which no one runs.
2.2 Equilibrium
2.2.1 Legislative bargaining
We begin by analyzing legislative bargaining. As mentioned previously, we consider an ultimatum game: if a proposal is not approved, the game ends, and each member receives  $\skew3\bar{d}$. This means that the agenda setter proposes
 $\skew3\bar{d}$ to each member of the majority coalition, and keeping all the remaining resources (
 $1 - \left( {{\rm L} - 1} \right)\skew3\bar{d}/2 > \skew3\bar{d}$), which the other members approve (see Proposition 1 of Baron and Ferejohn (Reference Baron and Ferejohn1989)). Thus, legislators who are not in the majority coalition cannot get anything (dl = 0) if a proposal is approved. Accordingly, the expected values of the distribution for the district are
 \begin{eqnarray*}
d_N &\equiv& \left( {\frac{1}{{L + \left( {\alpha - 1} \right)n}}} \right)\left( {1 - \frac{{L - 1}}{2}\skew3\bar{d}} \right) + \left( {1 - \frac{1}{{L + \left( {\alpha - 1} \right)n}}} \right)\frac{{\skew3\bar{d}}}{2},\\
d_D & \equiv & \left( {\frac{\alpha }{{L + \left( {\alpha - 1} \right)\left( {n + 1} \right)}}} \right)\left( {1 - \frac{{L - 1}}{2}\skew3\bar{d}} \right) + \left( {1 - \frac{\alpha }{{L + \left( {\alpha - 1} \right)\left( {n + 1} \right)}}} \right)\frac{{\skew3\bar{d}}}{2}.
\end{eqnarray*}
The first term is the expected payoff to be an agenda setter, and the second term is the expected payoff to be a member of the majority coalition. The district with a dynastic legislator is expected to obtain more benefits than the one with a non-dynastic legislator. That is, dD > dN. As α increases, dD increases and dN decreases. In other words, the larger bargaining power of dynastic legislators results in a larger allocation of benefits to their districts.
2.2.2 Campaign platform and election returns
Given the predicted outcomes of legislative bargaining, we next consider the size of λ in the campaign platform and the expected vote share. To ensure interior solutions for λj ∈ (0, 1) for j = D, N, we assume that
Assumption 2 (dD − dN)/3 < 1/(2ξ) − v < (dD + 2dN)/3.
In other words, the value of ξ is not too high or too low. Without this assumption, λj = 0 or 1 in equilibrium.Footnote 12
By differentiating Vj in (2) and (3) with respect to λj, we can derive the following values of λ*j announced by the candidates as a campaign platform in equilibrium
 \begin{equation}
\lambda _D^* \equiv \frac{1}{3} - \frac{1}{{d_D }}\left( {v - \frac{1}{{2\xi }} + \frac{1}{3}d_N } \right),\end{equation}
 \begin{equation}
\lambda _N^* \equiv \frac{1}{3} - \frac{1}{{d_N }}\left( {v - \frac{1}{{2\xi }} + \frac{1}{3}d_D } \right).\end{equation}
After substituting π(λD, λN) for λ*D and λ*N in the third line of (1), the probability that a dynastic candidate wins in equilibrium becomes
 \begin{equation}
\pi ^* \equiv \frac{1}{2} + \frac{\xi }{3}\left( {d_D - d_N } \right).\end{equation}
Given Assumption 2, π* ∈ (0, 1). The expected vote share of a dynastic candidate is
 \begin{equation}
\frac{1}{2} + \frac{\varphi }{3}\left( {d_D - d_N } \right)\end{equation}
since the mean of γ is 0.
Next, substitute (4), (5), and (6) into Vj in (2) and (3). Then, the expected benefits of dynastic and non-dynastic candidates in equilibrium are
 \begin{equation}
V_D^* \equiv \left[ {\frac{1}{{2\xi }} + \frac{1}{3}\left( {d_D - d_N } \right)} \right]^2 ,\end{equation}
 \begin{equation}
V_N^* \equiv \left[ {\frac{1}{{2\xi }} - \frac{1}{3}\left( {d_D - d_N } \right)} \right]^2 .\end{equation}
Thus, the ratio of rent, the probability of winning, the expected vote share, and the expected benefit are higher for a dynastic candidate than for a non-dynastic candidate because dD > dN.
2.2.3 Endogenous candidates
Building on the analyses discussed above, we now derive conditions for potential candidates to run in equilibria. First, suppose that no candidates run in the district. Then, the expected payoff for potential candidates is 0. If a dynastic candidate decides to run, this candidate will spend all of the distribution as own rent (λD = 1) and win with certainty, so the expected payoff is dD + v − cD. Since dD + v is the highest possible expected benefit, dD + v − cD > 1/(4ξ) − cD. From Assumption 1, 1/(4ξ) − cD > 0, and thus, dD + v − cD > 0. As a result, an equilibrium in which no candidate runs in the district does not exist.
Second, suppose that only a dynastic candidate runs. This dynastic candidate has no incentive to deviate (i.e., not run) for the same reason discussed above. If a non-dynastic candidate deviates and runs, the expected payoff for this candidate changes from 0 to V*N − cN. Therefore, if V*N ⩽ cN, this non-dynastic candidate does not run. We call such a district a dynastic district. Here, only the dynastic candidate runs and wins.Footnote 13
Third, suppose that both dynastic and non-dynastic candidates run. If the non-dynastic candidate deviates (i.e., does not run), her expected payoff becomes 0. Thus, if V*N ⩾ cN, neither candidate deviates because V*D > VN* ⩾ cN > cD. Such a district is called a competitive district.
In short, we find the following proposition:
Proposition 1Suppose Assumptions 1 and 2. (i) Dynastic district: If V*N ⩽ cN , only the dynastic candidate runs, announces λD = 1, and wins with certainty; (ii) Competitive district: If V*N ⩾ cN , both the dynastic and non-dynastic candidates run, and announce λ*Dand λ*Ndefined by (4) and (5), respectively. The dynastic candidate's probability of winning is π*, defined by (6).
2.3 Theoretical implications
We can draw three empirical predictions from our model. First, our model of legislative bargaining predicts the following hypothesis:
H1Dynastic legislators bring more distributions to their districts than do non-dynastic legislators.
Second, the model leads to predicting an election outcome. The probability that a dynastic candidate wins in a competitive district is given by (6), which is always higher than one half. The expected vote share is given by (7), which is also higher than one half. In contrast, a non-dynastic candidate's probability of winning in a competitive district is lower than one half. In the dynastic district, a dynastic candidate will win with certainty. Drawing on these results, we expect that:
H2Dynastic candidates enjoy a higher probability of winning and a higher vote share than non-dynastic candidates do.
Third, we examine the economic consequences of electing dynastic and non-dynastic candidates. As mentioned previously, we interpret g ( = (1 − λj)dj) as a growth policy aimed at improving the socioeconomic infrastructure and expanding job opportunities within the district, leading to higher economic performance. Electing dynastic legislators should result in higher economic performance than electing non-dynastic legislators because dynastic legislators bring more allocations (i.e., the larger amount of dj) to their districts. Importantly, this relationship holds only in a competitive district, where dynastic legislators generate a higher expected amount of spending on policy g than non-dynastic legislators do (i.e., (1 − λ*D)dD > (1 − λ*N)dN).Footnote 14 On the other hand, electing dynastic legislators in the dynastic district results in lower economic performance than when electing non-dynastic legislators in the competitive district. This is because those dynastic legislators set λD = 1 and win with certainty. In other words, dynastic legislators from the dynastic district only spend the distributive benefits on the limited segment of the electorate, including themselves, in the district, which makes no contribution to the economic performance of the entire district. Taken together, we obtain the following corollary:
Corollary 1In the competitive district, economic performance is higher when a dynastic legislator is elected than when a non-dynastic legislator is elected. (ii) Economic performance is higher in the competitive district with a non-dynastic legislator than in the dynastic district (with a dynastic legislator).
For our empirical analysis, we have to specify whether dynastic legislators, if elected, are from the dynastic or competitive district. According to Proposition 1, the type of district is determined by V*N and cN. We focus on the role of cN, arguing that the dynastic district appears more likely when cN is sufficiently high, while the competitive district appears more likely when cN is low.Footnote 15 The value of cN is strongly influenced by the amount of electoral resources dynastic candidates possess. This is because a non-dynastic candidate has to spend more on mobilization to challenge the dynastic opponent, who has the larger amount of inherited resources. More resource-rich dynastic candidates increase the campaign costs for non-dynastic candidates, discouraging non-dynastic candidates from running. Note that dynastic candidates are, on average, more resource-rich than non-dynastic candidates, because dynastic candidates can inherit a well-organized support group, financial resources, and name recognition among the constituents from their relative. Thus, a larger gap in electoral resources makes it particularly challenging for non-dynastic candidates to fight against dynastic candidates. In contrast, less-resourceful dynastic candidates lower the campaign cost for non-dynastic candidates.
In short, we predict that the dynastic district appears when dynastic candidates are more resourceful, while the competitive district appears when dynastic candidates are less resourceful. Accordingly, we develop the following hypothesis:
H3Compared to the districts electing non-dynastic legislators, the districts electing dynastic legislators with abundant resources display lower economic performance, whereas the districts electing dynastic legislators without abundant resources display higher economic performance.
3. Empirical analysis
For empirical tests, we use the data on the members of the Lower House elected between 1996 and 2005 in Japan.Footnote 16 We choose the members of the Lower House because it has more legislative power. After 1996, the Japanese Lower House employs a mixed-member system with 200 members elected under Proportional Representation (PR), and 300 members elected from single-member districts. The number of seats for the PR tier was reduced to 180 for elections since 2002. Our analysis excludes members elected from the PR tier. In addition, we exclude the period before 1996 from the analysis in order to keep the effect of the electoral system constant.
3.1 Fiscal transfers
We test the first hypothesis by examining the flow of intergovernmental transfers to municipalities. We use panel data that include biographical and electoral information of the representatives elected for the Lower House in 1996, 2000, 2003, and 2005, and annual fiscal and socioeconomic information of municipalities between 1997 and 2007.Footnote 17 We also present an instrument variable estimation in order to address concerns regarding endogeneity.
We estimate the following model
 \begin{eqnarray}
[Transfer]_{ml,t} & = &\beta [dynasty]_{ml,t - 1} + \gamma _1 [LDP]_{ml,t - 1} + \gamma _2 [Term]_{ml,t - 1} \\
&& + \,\gamma _3 [M\arg in]_{ml,t - 1} + {\rm \lambda }{\bf w}_{ml,t} + \phi _t + \rho _{ml} + \in _{ml,t} ,\end{eqnarray}
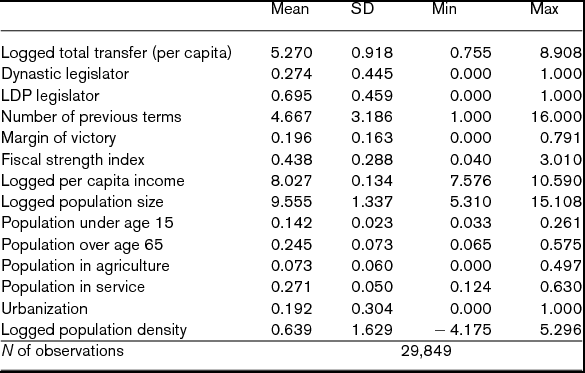
where [Transfer]ml, t denotes the log of the amount of fiscal transfers from the national government to municipality m in district l in year t. The amount of government transfer is the sum of two broad categories of governmental transfers, namely the local allocation tax grant and the national treasury disbursement.Footnote 18 [Transfer]ml, t is a per capita amount and is measured in 1,000 yen. The average equals 5.270 with the standard error 0.918 for our study period.
[Dynasty]ml, t − 1 in (10) is our key explanatory variable and equals 1 if municipality m of district l in yeart − 1 is represented by a dynastic legislator and 0 otherwise. We define ‘dynastic’ legislators as those whose parents were members of the Lower House in the past. The percentages of dynastic legislators elected in each election are 28% in 1996, 25% in 2000, 27% in 2003, and 26% in 2006.Footnote 19 Similarly, [LDP]ml, t − 1 equals 1 if the municipality is represented by a legislator who belongs to the Liberal Democratic Party (LDP) and 0 otherwise. The LDP was in power during the period of our study. [Term]ml, t − 1 denotes the number of previous terms of the legislator representing the municipality, while [Margin]ml, t − 1 denotes the margin of victory.
The vector wml, t includes the characteristics of municipalities, such as per capita income, the fiscal strength index, the total size of population, the proportion of population under 15 years old and over 65 years old, the proportion of population in the agricultural sector and service sector, the degree of urbanization, and population density.Footnote 20 The financial strength index measures the ratio of municipal financial revenue to financial demand. When the revenue is exactly equal to the anticipated expenditure, the index becomes 1. The scores below 1 indicate that the demand surpasses the revenue, while the scores above 1 indicate that the revenue surpasses the demand. The degree of urbanization is measured by the ratio of population living in Density Inhabited Districts (DID). ρml and φt are municipality and year fixed effects, respectively. εml, t is a municipality-year specific error term.Footnote 21 The number of municipalities in Japan was slightly more than 3,300 until about 2003, but since then the number has dropped to around 1,800 due to large-scale mergers that happened throughout Japan. In total, our municipality-level data include about 30,000 observations for 11 years. The summary statistics of the variables for our regression analysis are reported in Table 1.
Summary statistics for municipality-level data

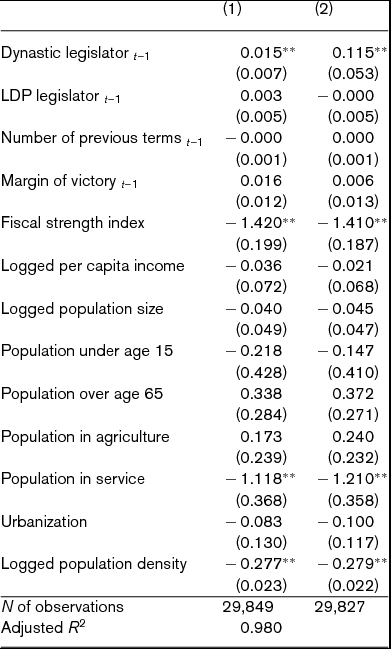
Table 2 reports the estimation results. The standard errors are clustered by municipalities. Column (1) in Table 2 shows that municipalities receive more transfers when they are represented by dynastic legislators as compared to when non-dynastic legislators represent them. The difference is estimated to be statistically significant. The coefficient associated with the dynastic legislator dummy in column (1) indicates that municipalities expect a 1.5% increase in the transfer when they are represented by a dynastic legislator. This result offers support for the first hypothesis.
The effect of dynastic legislators on fiscal transfers to municipalities
Notes: Table entries are regression coefficients with robust standard errors in parentheses. Standard errors are clustered by municipalities. The estimates are based on the municipality-level data from 1997 to 2007. The dependent variable is the total amount of fiscal transfer per capita from the national government to municipalities. The dependent variable is logged for estimation. The municipality and year fixed effects are included in the models. ∗∗ p < 0.05 and ∗ p < 0.10.
This suggests that municipalities receive more transfers from the national government when they are represented by dynastic legislators. However, one may argue that the relationship is spurious. For example, suppose that an area with a deteriorating economic situation elects a dynastic legislator because it expects him to secure more grants to improve its economic condition. Further, this area may receive more transfers from the government simply because it has greater financial needs. If this is the case, the effect of dynastic legislators is overestimated. Alternatively, one may argue that there is a reverse causality (i.e., our dependent variable determines the presence of dynastic legislators) because an increase in subsidies enhances the chance of reelecting dynastic legislators who have brought back the money to the district. Finally, suppose that there is an unobservable ability that helps politicians secure more funds to their constituencies. If dynastic politicians tend to have such a trait, our results are likely to be biased because we are unable to include it in the estimation.
We address these potential concerns for endogeneity by using the gender of the previous incumbent's children as an instrumental variable.Footnote 22 Specifically, we use the fraction of boys among the predecessor's children. Given that more than 90% of Japanese politicians between 1996 and 2007 were males, if a politician has only daughters, he is unlikely to give his seat to one of his children. In fact, among the 124 politicians coded as dynastic in our dataset, only three are female.Footnote 23 Thus, the fraction of male children of a politician should be highly and positively correlated with the chance of dynastic inheritance of the politician's seat. However, the gender of offsprings (of the previous incumbent) is unlikely to be related to the amount of transfers in the current period. These two properties make it an ideal instrument.
Let [Boy]ml, prev be the fraction of male children among all children of the previous incumbent in district l. We calculate [Boy]ml, prev as follows. First, for each politician in our dataset, we checked if the member who served before him or her belonged to the same party. If not, [Boy]ml, prev is automatically coded as 0, because the dynastic inheritance of seats cannot happen.Footnote 24 Second, if the previous incumbent was from the same party, then we consulted a book called ‘Jinji Koshin Roku’ that lists the family information of notable people in Japan.Footnote 25
Then, we run our first-stage regression as follows
 \begin{equation}
\left[ {Dynasty} \right]_{ml,t - 1} = \beta \left[ {Boy} \right]_{ml,prev} + \lambda {\bf X}_{ml,t} + \phi _t + \rho _{ml} + \varepsilon _{ml,t} ,\end{equation}
where Xml, t contains all other independent (i.e., exogenous) variables included in (10). The first-stage regression produces a statistically significant coefficient on [Boy]ml, prev ( $\hat \beta $ = 0.268, SE = 0.046), suggesting that it is a valid strong instrument.Footnote 26
We then run our second-stage regression using a fitted value of [Dynasty]ml, t − 1 in (11). The result is reported in column (2) in Table 2. The coefficient associated with [Dynasty]ml, t − 1 is positive and statistically significant. The results do not change substantially even if we use the number of male children as an alternative instrument. The estimation results from IV regressions suggest that the presence of dynastic legislators has a strong causal impact on the allocation of distributive benefits to municipalities. In short, our instrumental variable estimation also lends support to the hypothesis that dynastic legislators bring more distributive benefits to the district than non-dynastic legislators.
3.2 Election returns
The second hypothesis predicts that dynastic candidates have a higher probability of winning and a higher vote share as compared to non-dynastic candidates. We test this hypothesis by estimating the following model
 \begin{eqnarray}
[{\rm Re} turn]_{h,l} &=& \beta [dynasty]_{h,l} + \gamma _1 [Female]_{h,l} + \gamma _2 [Age]_{h,l} + \gamma _3 [Local]_{h,l} \\
&&+\, \gamma _4 [LDP]_{h,l} + \gamma _5 [DP]_{h,l} + \gamma _6 [Komei]_{h,l} \\
&&+\, \gamma _7 [Incumbent]_{h,l} + \gamma _8 [Term]_{h,l} + \rho _l + \in _{h,l} ,
\end{eqnarray}
where [Return]h, l is either a dichotomous variable that equals 1 if candidate h wins an election in district l or a continuous variable that equals the vote shares of candidate h in district l. For the dichotomous variable, candidates are assigned 0 even if they gained a seat in the PR tier after being defeated in a single-member district. The vote share is equal to the number of candidate's votes divided by the total number of eligible votes cast, multiplied by 100. ρl denotes a district-fixed effect, while εh, l denotes a candidate-specific error term. With ρl, the model exploits the variation across candidates within a district.
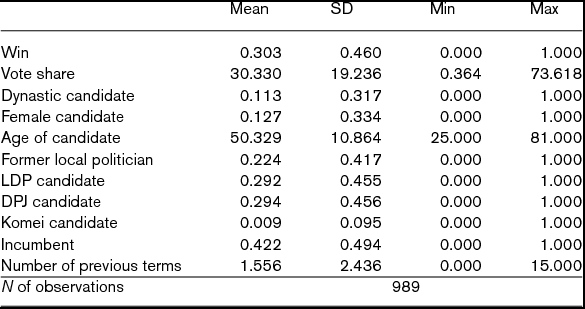
[Dynasty]h, l in (12) equals 1 if candidate h in district l is dynastic. Because it is extremely challenging to find the dynastic status of those who lost elections, we limit our search to candidates who ran in the 2005 General Election (N = 989). Thus, in this part of the analysis, the sample represents candidates who ran in 2005. The percentage of dynastic candidates is 11% in the 2005 election. In addition to [Dynasty]h, l, equation (12) includes several variables that control the effects of the demographic and political attributes of the candidates on election returns. [Female]h, l equals 1 if a candidate is female. [Age]h, l denotes the age of the candidates in 2005. [Local]h, l equals 1 if a candidate served as a governor, mayor, or representative at the prefecture or municipality level before running for the Lower House election. [LDP]h, l, [DPJ]h, l, and [Komei]h, l denote the party affiliation of the candidates. [LDP]h, l equals 1 if a candidate is from LDP. [DPJ]h, l equals 1 if a candidate belongs to the Democratic Party of Japan. [Komei]h, l equals 1 if a candidate belongs to the Komei party.Footnote 27 [Incumbent]h, l is a dummy variable for the incumbency status of candidates. [Term]h, l is the number of times that the candidate has been elected to the Lower House. The summary statistics are reported in Table 3.
Summary statistics for candidate-level data
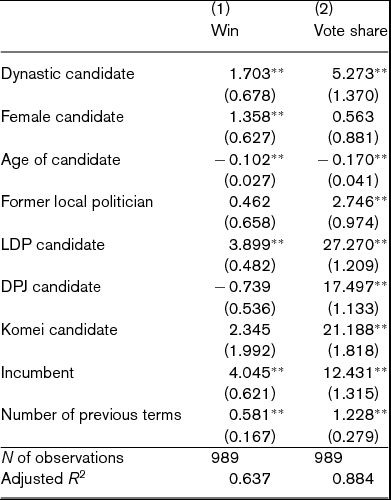
Table 4 presents the estimation results. We estimate a logit model when the dependent variable is the dichotomous variable of winning. The standard errors are clustered by districts. According to column (1), the positive and statistically significant coefficient associated with [Dynasty]h, l suggests that dynastic candidates are more likely to win the 2005 election as compared to non-dynastic counterparts. The estimated coefficient in column (1) suggests that their probability of winning is 22% higher than that of non-dynastic candidates.Footnote 28 When the vote share is the dependent variable, we estimate the standard fixed effect model. Column (2) of Table 4 suggests that the coefficient associated with the dynastic status is positive and statistically significant. That is, dynastic candidates enjoy higher vote shares as compared to non-dynastic candidates. The estimated coefficient in column (2) implies that the average vote share of dynastic candidates is 5.273 percentage points higher than that of non-dynastic candidates. These results show evidence in support for the second hypothesis.
The effect of dynastic candidates on the election returns in 2005
Notes: Table entries are logit regression coefficients in Column (1) and linear regression coefficients in Column (2) with robust standard errors in parentheses. Standard errors are clustered by districts. The estimates are based on candidates running for the 2005 Lower House election. The dependent variables are a binary variable that equals 1 if a candidate won the election in column (1), and the percent of vote share in column (2). The district fixed effects are included in the models. ∗∗ p < 0.05 and ∗ p < 0.10.
3.3 Economic performance
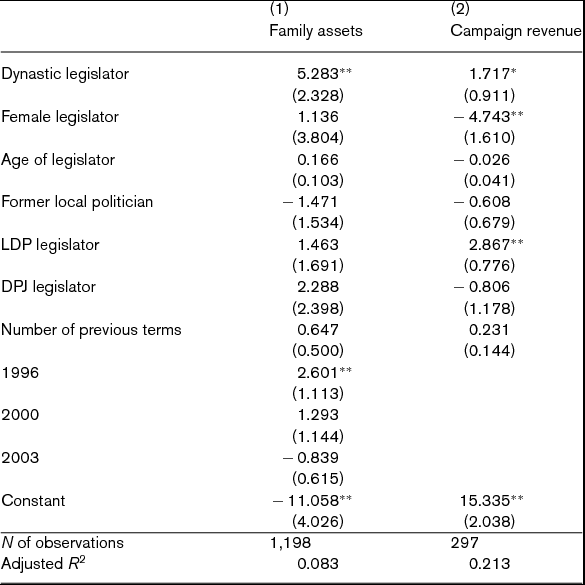
To test the hypothesis on economic performance (H3), we determine whether dynastic legislators are resource-rich or not by using the data on the reported amount of financial resources. Specifically, we rely on the total amount of family assets of dynastic legislators. We assume that more family assets allow dynastic candidates to spend more on campaign activities, which results in a higher cost of campaign for non-dynastic candidates. The data on the assets are available for 1996, 2000, 2003, and 2005. We code dynastic legislators as rich if their family assets exceed the mean of the reported assets among all legislators, and poor otherwise.Footnote 29 Our regression analysis reports that dynastic candidates own more family assets than non-dynastic candidates. Column (1) in Table 5 reports that the difference in the family assets is about 5 million yen, after controlling for several political and demographic attributes. Column (2) in Table 5 shows a similar result wherein dynastic legislators are more resource-rich than non-dynastic legislators when the total amount of campaign revenue is used as a measure of resources.Footnote 30
Dynastic legislators and financial resources
Notes: Table entries are linear regression coefficients with robust standard errors in parentheses. Standard errors are clustered by prefectures. The estimates are based on winners elected for the 1996, 2000, 2003, and 2005 Lower House elections in Column (1), and in the 1996 election in Column (2). The dependent variable in column (1) is the total asset in 1,000,000 yen, while the dependent variable in column (2) is the total campaign revenue in 1,000,000 yen. The prefecture fixed effects are included in the models. ∗∗ p < 0.05 and ∗ p < 0.10.
As a measure of local economic performance, we use the rate of GDP growth in prefectures. We expect that the prefectures represented by dynastic legislators achieve the lower levels of income and GDP growth than the prefectures represented by non-dynastic legislators. In this subsection, we use the prefecture-level data because the data on economic growth are unavailable at the municipality level.Footnote 31
We estimate the following model
 \begin{eqnarray}
{[}Growth{]}_{k,t} &=& \alpha {[}Growth{]}_{k,t - 1} + \beta _1 {[}P.RichDynasty{]}_{k,t - 2} + \beta _2 {[}P.RichDynasty{]}_{k,t - 3} \\
&&+\, \beta _3 {[}P.PoorDynasty{]}_{k,t - 2} + \beta _4 {[}P.PoorDynasty{]}_{k,t - 3} \\
&&+\, \gamma _1 {[}P.LDP{]}_{k,t - 2} + \gamma {[}P.LDP{]}_{k,t - 3} \\
&&+\, \gamma _3 {[}Transfer{]}_{k,t - 1} + \gamma _4 {[}Transfer{]}_{k,t - 2} \\
&& +\, \lambda {\bf w}_{k,t} + \phi_t + \rho_k + \in_{k,t} ,
\end{eqnarray}
where [Growth]k, t denotes the annual rate of GDP growth in prefecture k in year t. The right-hand side of (13) includes the lagged rate of growth, the lagged proportions of dynastic and LDP legislators, socioeconomic variables, and fixed effects for prefectures and years. Following prior research on economic growth (Caselli et al., Reference Caselli, Esquivel and Lefort1996), we include the lagged dependent variable in the right-hand side. Further, we take the log of the growth rate.
[P.RichDynasty]k, t − 2 measures the proportion of dynastic legislators who were elected in prefecture k in year t − 2 and whose family assets are above the mean of the sample, while [P.PoorDynasty]k, t − 2 measures the proportion of dynastic legislators who were elected in prefecture k in year t − 2 whose family assets are below the mean. [P.RichDynasty]k, t − 3 and [P.PoorDynasty]k, t − 3 are similarly defined. We use lags at t − 2 and t − 3 because there should be a time lag before projects and government investment can affect local economic performance. Legislators at t determine the amount of transfers at t + 1, which then affects the rate of income and GDP growth at t + 2 or later. Further, these lags also minimize the possibility of the reverse causality between the presence of dynastic legislators and economic performance. In order to calculate the proportions of resource-rich and resource-poor dynastic legislators, we first code each member of the Diet for their dynastic status. Once a legislator's family background is coded, we simply sum the number of resource-rich and resource-poor dynastic legislators using their assets in prefecture k in year t − 2 (or t − 3) and divide it by the total number of lawmakers in prefecture k. We expect β 1 and β 2 to be negative and β 3 and β 4 to be positive. We also include [P.LDP]k, t − 2 and [P.LDP]k, t − 3 to capture the effect of belonging to the party in power. These variables are equal to the proportion of representatives from LDP and are defined in the same way as [P.RichDynasty] and [P.PoorDynasty].
Equation (13) includes a measure of fiscal transfers from the national government to prefectures. We use a log of the total amount of government transfers per capita at t − 1 and t − 2. We assume that fiscal transfers are expected to improve the GDP growth rate. Thus, the coefficients associated with [Transfer] should be estimated to be positive. We use the lags of [Transfer] at t − 1 and t − 2 because fiscal transfers are not likely to have an immediate impact on local economic performance.
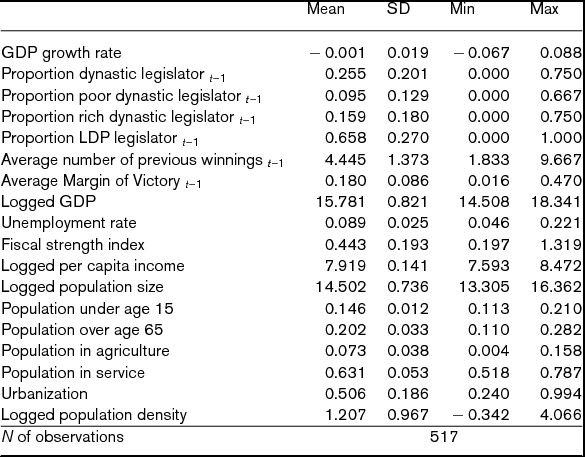
Additionally, we include wk, t and ρk in order to control the effects of underlying socioeconomic characteristics of prefecture k on [Growth]k, t. These characteristics are likely to affect the economic performance of prefectures and the election of dynastic legislators. The vector wk, t includes the rate of unemployment, fiscal strength index, total size of population, proportion of population under 15 years old and over 65 years old, proportion of population in the agricultural sector and service sector, degree of urbanization, and population density.Footnote 32 ρk controls the effects of unobservable time-invariant characteristics of prefecture k. The summary statistics are reported in Table 6.
Summary statistics for prefecture-level data
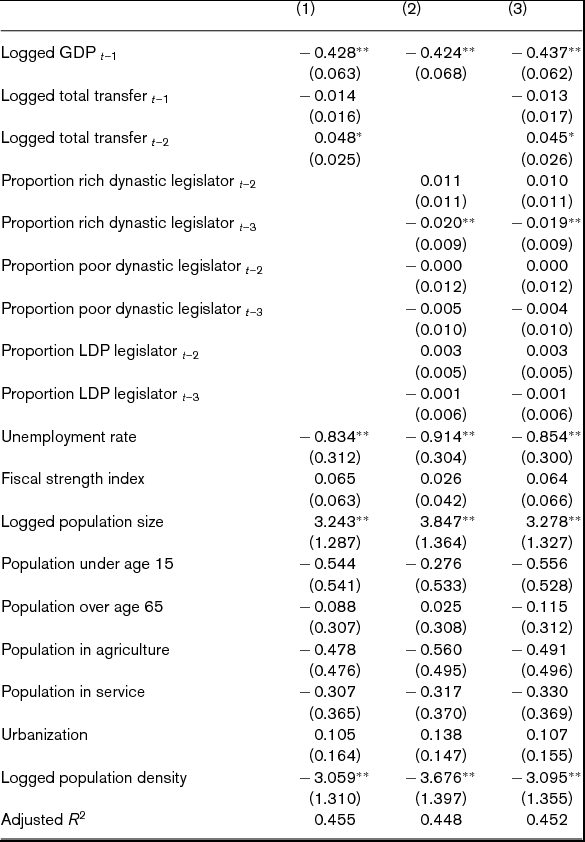
Table 7 reports the estimated results. We first check that the amount of fiscal transfers is positively correlated with the GDP growth rate. We include all non-political variables in the equation and estimate the impact of fiscal transfers. Column (1) of Table 7 indicates that the amount of transfers at t − 2 has a positive relationship with the GDP growth rate, while the amount at t − 1 has no statistically significant impact on the growth rate. This result offers evidence in support for our assumption that fiscal transfers have a lagged positive impact on local economic performance.
The effect of dynastic legislators on economic growth at the prefecture level
Notes: Table entries are linear regression coefficients with robust standard errors in parentheses. Standard errors are clustered by prefectures. Estimates are based on the prefecture-level data from 1997 to 2007. The dependent variable is the log rate of total GDP growth. The prefecture and year fixed effects are included in the models. The number of observations is 517. ∗∗ p < 0.05 and ∗ p < 0.10.
Next, we turn to our analysis of how the presence of dynastic legislators affects the GDP growth rate. Column (2) reports the estimated result for the third hypothesis. The proportion of rich dynastic legislators with more family assets at t − 3 has a negative and statistically significant impact on the rate of GDP growth. On the other hand, the proportion of poor dynastic legislators with less family assets at t − 3 has a negative but not statistically significant impact. The proportions of rich and poor dynastic legislators at t − 2 have no statistically significant impacts on economic growth.Footnote 33 Column (3) indicates that the result for rich dynastic legislators holds even after the impact of fiscal transfers is controlled.Footnote 34
The negative coefficient associated with [P.RichDynasty]k, t − 3 suggests that dynastic legislators elected from the dynastic district suppress the rate of economic growth by spending the distributive benefits in an inefficient manner. In short, dynastic legislators suppress local economic performance despite the fact they deliver a larger amount of distributive benefits to their districts. More distributive benefits improve local economic performance, yet dynastic legislators spend the distributive benefits inefficiently, which in turn suppresses the growth rate in their districts.
4. Conclusion
This article offer several notable findings. First, dynastic legislators bring more distributions to the district than non-dynastic legislators. Second, dynastic candidates enjoy higher electoral success. Third, most importantly, as compared to the districts electing non-dynastic legislators, the districts electing dynastic legislators with abundant resources display lower economic performance.
This study makes two contributions. First, our analysis shows that the types of politicians play an important role in the democratic policy-making process. Politicians are characterized by different abilities, resources, and preferences. Their personal characteristics constrain how they act in the policy-making process, resulting in different policy choices. The findings in this study suggest that exclusive attention to institutional structures does not always advance our understanding of democratic policy making. In addition, along with other previous works, this study shows that the citizen candidate model offers a useful framework for analyzing the role of politician types.
Second, our research implies that political dynasties have a negative consequence for democratic policy making. Dynastic politicians may be socially inefficient because their electoral advantage deters non-dynastic candidates from running for office, even if constituents prefer non-dynastic candidates to dynastic ones. Further, the large presence of dynastic legislators may result in less optimal policies for the majority of Japanese citizens. A similar discussion can be applied to other countries with a considerable presence of political dynasties.
Agendas for future research include extending our model to predict the behavior of other politicians with electoral and bargaining advantages. In Japan, former local politicians and politicians’ secretaries are likely to have characteristics similar to dynastic candidates.Footnote 35 It is also important to study other countries with the large presence of dynastic politicians to generalize our findings that are entirely drawn from Japan.
About the authors
Yasushi Asako is assistant professor at School of Political Science and Economics, Waseda University. He received his Ph.D. from University of Wisconsin-Madison. His primary areas of research include public choice, applied microeconomic theory, and formal political analysis. His article has appeared in Economic Inquiry.
Takeshi Iida is associate professor of political science at Doshisha University. He received his Ph.D. from the University of Texas at Austin. His research interests include public opinion and voting behavior in Japan and the United States. He is the author of Keiryo Seiji Bunseki [Quantitative Political Analysis] (Kyoritsu Shuppan, 2013). He has also previously published in Social Science Quarterly.
Tetsuya Matsubayashi is associate professor at Osaka School of International Public Policy, Osaka University. He received a Ph.D. from Texas A&M University. His primary areas of research include mass political behavior, political representation, and public health. His works have appeared in American Journal of Political Science, American Political Science Review, British Journal of Political Science, Political Research Quarterly, and Social Science & Medicine.
Michiko Ueda is research assistant professor of political science at Syracuse University. She received her Ph.D. from Massachusetts Institute of Technology. She has written journal articles and book chapters on American political institutions and legislative elections. Her research interests also include suicide prevention, social epidemiology, and public health.
Appendix 1: Variables used in the model
Appendix 2: The sources of data
Fiscal transfer: Shichosonbetsu Kessan Jokyo Shirabe (Report on the Condition of Municipalities’ Balance Sheet), published by the Ministry of Internal Affairs and Communications.
Biographical information of legislators: For those elected in 1996, we used the data compiled by Kabashima (Reference Kabashima2000). Because Kabashima's data only cover up to1996, we updated his dataset for more recent lawmakers in two ways. As for the conservative members of the Diet, we supplemented the information with the data collected by Asano (Reference Asano2006). Masahiko Asano generously shared his data with us. Most conservative legislators belong to LDP. For the rest of the representatives, we consulted booklets called ‘Kokkai Binran’ (Diet Manual) to fill in the dynastic information. For those who lost the 2005 election, we consulted the archives of various newspapers for candidate profiles. Because dynastic legislators are of great interest to the Japanese general public, newspaper articles mentioned their dynastic status in most cases. When newspapers did not carry candidate profiles, we consulted other sources, such as their web sites and biographical accounts by others.
Election returns: Japan Election Data compiled by Setsufumi Mizusaki and Yuki Mori (various years).
Social and economic data of prefectures and municipalities: Shakai Jinko Toukei Taikei (System of Social and Demographic Statistics) published by the Ministry of Internal Affairs and Communications.
Assets: Newspaper reports.
Campaign revenue: Kabashima (Reference Kabashima2000).
Appendix 3: The first-stage regression result for the instrumental variable