Implications
We have isolated the whole length of the complementary DNA of the Calreticulin (CRT) gene in the Asian seabass, studied the expression levels under normal condition and after 16°C cold challenge, analyzed the genomic organization and polymorphism, and identified the association between the single nucleotide polymorphism6 and cold tolerance. Our results suggest that the CRT gene may be involved in cold tolerance in the Asian seabass. Further investigation will be required to illustrate the underlying mechanisms.
Introduction
Calreticulin (CRT) is a major calcium-binding protein found in smooth muscle sarcoplasmic reticulum and no-muscle reticulum in vertebrates (Ostwald and Mclennan, Reference Ostwald and Mclennan1974). The CRT gene was first isolated from sarcoplasmic reticulum of rabbit skeletal muscle (Fliegel et al., Reference Fliegel, Burns, MacLennan, Reithmeier and Michalak1989). Since then, it has been cloned in a number of species of vertebrates (e.g. in rabbit; Fliegel et al., Reference Fliegel, Burns, MacLennan, Reithmeier and Michalak1989), invertebrates (e.g. in Boophilus microplus; Ferreira et al., Reference Ferreira, Da Silva Vaz, da Silva, Haag, Valenzuela and Masuda2002) and high plant species (e.g. in barley; Chen et al., Reference Chen, Hayes, Mulrooney and Pan1994). The CRT gene is highly conserved among vertebrates (Michalak et al., Reference Michalak, Corbett, Mesaeli, Nakamura and Opas1999) and expressed in a wide variety of tissues and species. A number of functions have been ascribed to the CRT, including Ca2+ sequestration, transcriptional regulation, antithrombotic activity and cell proliferation (Michalak et al., Reference Michalak, Corbett, Mesaeli, Nakamura and Opas1999). Recently, it has been proposed to be a molecular chaperone (Kales et al., Reference Kales, Fujiki and Dixon2004; Jia et al., Reference Jia, Xu, Jing, Li, Mao, Wang and Chang2008), as it has been found to be transiently associated with folding intermediates of glycoprotein. The CRT gene is believed to play a main role as a lectin-like chaperone to viral peptides. In humans, the CRT gene is a single-copy gene and consists of nine exons and eight introns spanning ca. 3.6 kb, and it encodes 417 amino acids (Michalak et al., Reference Michalak, Corbett, Mesaeli, Nakamura and Opas1999), whereas in mouse the genomic region of the CRT gene spanned 4.6 kb (Waser et al., Reference Waser, Mesaeli, Spencer and Michalak1997). Since its first molecular cloning in 1974 (Ostwald and Mclennan, Reference Ostwald and Mclennan1974), the protein has been well characterized in mammals and consists of three domains, each with well-conserved features. The N-terminal region of mammalian CRT is highly conserved and contains three cysteines, two of which are believed to form a disulfide bond (Hojrup et al., Reference Hojrup, Roepstorff and Houen2001). The P domain is a proline-rich region demonstrating high-affinity Ca2+ binding, which, along with its chaperone capabilities, is both believed to be due to the well-conserved amino acid sequence triplicate repeats referred to as repeats M and M2 by some authors (Michalak et al., Reference Michalak, Corbett, Mesaeli, Nakamura and Opas1999). The remaining C-terminal region is highly acidic, demonstrates low affinity, high-capacity Ca2+ binding and terminates with the endoplasmic reticulum (ER)-retrieval sequence, KDEL (Fliegel et al., Reference Fliegel, Burns, MacLennan, Reithmeier and Michalak1989). In rice, overexpression of a calcium-dependent protein kinase and CRT-binding protein confers cold tolerance on rice plants (Komatsu et al., Reference Komatsu, Yang, Khan, Onodera, Toki and Yamaguchi2007).
The Asian seabass (called Barramundi in Australia) Lates calcarifer, belonging to the family Lachidae, is widely distributed in coastal and freshwater regions of the tropical Indo-West Pacific, from the Persian Gulf to India to northern Australia (Nelson, Reference Nelson2006; Yue et al., Reference Yue, Zhu, Lo, Wang, Lin, Feng, Pang, Li, Liu, Gong, Tan, Lim, Chou and Orban2009). This species is an important marine food fish and is cultured in Southeast Asia and Australia (Chou and Lee, Reference Chou and Lee1997; Frost et al., Reference Frost, Evans and Jerry2006). According to the statistics of Food and Agriculture Organization (FAO), the annual production of Asian seabass in 2003 was about 40 000 MT (FAO, 2008), with Thailand, Malaysia, Indonesia, Singapore and Australia being the major producers. Recently, China, Israel, Germany and France have begun to culture this species (Guiguen et al., Reference Guiguen, Cauty, Fostier, Fuchs and Jalabert1994; Volvich and Appelbaum, Reference Volvich and Appelbaum2001; Tucker et al., Reference Tucker, Russell and Rimmer2002; O'Sullivan, Reference O'Sullivan2004). However, it is difficult to culture this fish in environments where the temperature is lower than 16°C. In aquaculture practice, cold-tolerant Asian seabass is preferred. In Asian seabass, a large number of microsatellites have been developed for studying genetic diversity, selective breeding and linkage mapping (Yue et al., Reference Yue, Li and Orban2001; Yue et al., Reference Yue, Li, Chao, Chou and Orban2002; Zhu et al., Reference Zhu, Lin, Lo, Xu, Renee and Yue2006). Only a few genes (e.g. GH, IGF receptor, parvalbumin, myostatin, TH1 and TH2) have been cloned and characterized (Yowe and Epping, Reference Yowe and Epping1995; Xu et al., Reference Xu, Zhu, Lo, Wang, Lin, Feng and Yue2006; De Santis et al., Reference De Santis, Evans, Smith-Keune and Jerry2008). However, up to date, there is no report on relationships between genes and cold tolerance in this species.
Among teleosts, the CRT gene has been only isolated and characterized in rainbow trout (Kales et al., Reference Kales, Fujiki and Dixon2004). In the current study, we cloned the full-length complementary DNA (cDNA) of the CRT gene of the Asian seabass and examined its expression in different tissues under a normal condition and after cold challenge. We also analyzed the genomic organization of the CRT gene, detected single nucleotide polymorphisms (SNPs) and mapped the CRT gene onto the linkage map of Asian seabass (Wang et al., Reference Wang, Zhu, Lo, Feng, Lin, Yang, Li and Yue2007). In addition, we examined whether the CRT gene was associated with growth traits and cold tolerance. This information about the cDNA sequence, expression, genomic structure, polymorphisms and location on the linkage map and associations with traits could be useful for understanding the functions of the CRT gene, and supplies potential markers for selection of cold-tolerant Asian seabass.
Material and methods
cDNA cloning of the CRT gene
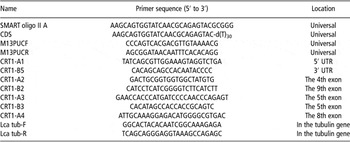
Six normalized cDNA libraries (brain, spleen, kidney, muscle, liver and heart) of Asian seabass were constructed using the pCMV-Sport-6 vector (Invitrogen, Carlsbad, CA, USA) in a previous study (Xu et al., Reference Xu, Zhu, Lo, Wang, Lin, Feng and Yue2006). From each library, 1500 clones were sequenced using M13 PUC-F primer (Table 1) and Bigdye chemicals (Applied Biosystems, Foster City, CA, USA) on an ABI3730xl DNA sequencer (Applied Biosystems). Sequences were clustered using Sequencher (GeneCodes, Ann Arbor, MI, USA). Clones containing the CRT gene were identified by blasting expressed sequence tags (ESTs) against known sequences in the GenBank. The inserts of these clones were amplified by PCR using M13 PUC-F and R primers. The full length of cDNA was sequenced by walking using CRT-specific primers (CRT1-A2, -A3, -A4, -A6, -B2, -B3 and -B5, see Table 1) and Bigdye chemicals.
Primers used in cloning and characterization of the CRT gene in Asian seabass

CRT = calreticulin.
Real-time reverse transcription (RT)-PCR analysis of CRT expression in different tissues
To examine the expression patterns of the CRT gene in different tissues of Asian seabass, brain, skin, eye, spleen, gill, heart, intestine, kidney and muscle tissues were collected from three individuals at the age of 30, 90 and 210 days post hatch, respectively. Tissues were immersed and homogenized in Trizol (GibcoBRL, San Francisco, CA, USA), followed by isopropanol precipitation and washing in 75% ethanol for total RNA isolation. Three micrograms of total RNA from each of the 10 tissues were reverse transcribed to cDNA with Superscript II (GibcoBRL), SMART oligo II A primer and CDS primer (Table 1) following the manufacturer's instruction.
For real-time PCR, the primers CRT1-A4 and CRT1-B5 (see Table 1) located in the open reading frame (ORF) and 3′ UTR were used. The housekeeping gene α-tubulin (primers see Table 1) was used to normalize the RT-PCR results (Xu et al., Reference Xu, Zhu, Lo, Wang, Lin, Feng and Yue2006). PCR was performed in a 25 μl reaction containing 1 × Taq polymerase buffer, 0.625 U Taq polymerase (Qiagen, Valencia, CA, USA), 300 nM of each primer, 200 μM dNTPs, 2.5 mM of Mg2+, 0.13 × SYBR Green 1 (Applied Biosystems, Foster City, CA, USA) and 2 μl template (first strand cDNA or plasmid DNA). The PCR program was as follows: 95°C for 3 min. followed by 40 cycles of denaturing at 95°C for 20 s, annealing at 55°C for 30 s and an extension at 72°C for 45 s. Following the amplification, a melt curve was determined by incubating the reaction at 95°C for 1 min, 55°C for 1 min, followed by 80 repeats of 55°C for 10 s, with the temperature increasing 0.5°C for each repeat. The standard curve method was used for the quantification of the expression of the CRT gene. The ratio between the expression of the CRT gene and α-tubulin was shown as the expression level of the CRT gene. To understand the difference of the CRT expression in different tissues and at different ages, an analysis of variance (ANOVA) was carried out using the SAS software (SAS Institute Inc., Cary, NC, USA).
Real-time RT-PCR analysis of the CRT expression in liver after cold challenge
One hundred and twenty individuals of Asian seabass at the age of 30 dph from a mass cross among 10 males and 10 females originating from a wild population in Singapore were put in 16°C water in a tank connected to a cooling system. Liver samples were collected from three fish after cold challenge for 30 min, 1, 2, 3, 4, 12 and 24 h, respectively. Liver samples were immersed in TriZol (GibcoBRL). RNA extraction and real-time RT-PCR were conducted as in section ‘Real-time reverse transcription (RT)-PCR analysis of CRT expression in different tissues’. The housekeeping gene α-tubulin (see primer sequence in Table 1) was used to normalize the RT-PCR results (Xu et al., Reference Xu, Zhu, Lo, Wang, Lin, Feng and Yue2006). ANOVA was performed using SAS software to analyze the difference of the CRT expression before and after cold challenge at 16°C.
Analysis of genomic structure and detection of SNPs in the CRT gene
The complete genomic DNA sequence of the CRT gene was amplified using PCR with primers (CRT1-A1 and CRT1-B5, see Table 1) and sequenced by walking with primers (CRT1-A1, -A2, -A3, -A4, -B2, -B3 and -B5, see Table 1) using Bigdye chemicals (Applied Biosystems). Exons and introns were identified by aligning cDNA and genomic DNA sequences of CRT using Sequencher (GeneCodes). SNPs were identified by sequencing and comparing the complete DNA sequences of six individuals collected from Singapore (two individuals), Malaysia (one individual), Indonesia (one individual), Thailand (one individual) and Australia (one individual).
Linkage mapping
Two mapping reference families (Wang et al., Reference Wang, Zhu, Lo, Feng, Lin, Yang, Li and Yue2007) consisting of three distinctly related parents were used to map the CRT gene. A total of 47 and 46 full-sib progeny were randomly collected from the two full-sib families, respectively. Due to the fact that the SNP6 was located in exon 3 and could be easily using SnapShot technology (Applied Biosystem), the SNP6 was selected for mapping the CRT gene. The informative SNP6 (C/G 1309) was genotyped in the three parents and 93 F1 individuals using SnapShot technology (Applied Biosystems). Linkage analysis was conducted as described previously (Wang et al., Reference Wang, Zhu, Lo, Feng, Lin, Yang, Li and Yue2007). Briefly, linkage analyses were carried out through a series of pairwise comparisons between loci using LINKMFEX (Danzmann et al., Reference Danzmann, Jackson and Ferguson1999). Map graphics were drawn with MapMaker software (Lander et al., Reference Lander, Green, Abrahamson, Barlow, Daly, Lincoln and Newburg1987).
Analysis of the association between the SNP6 and growth traits
To determine whether the CRT gene is associated with growth traits at the age of 90 dph, one F1 reference family (Wang et al., Reference Wang, Lo, Zhu and Yue2006) for quantitative trait loci (QTL) mapping including 380 F1 individuals was genotyped with the SNP6 using SnapShot technology, as the SNP6 was the only polymorphic SNP in the QTL mapping family. QTL analysis and association analysis were conducted as previously described (Wang et al., Reference Wang, Lo, Zhu and Yue2006; Xu et al., Reference Xu, Zhu, Lo, Wang, Lin, Feng and Yue2006). Briefly, QTL analysis was carried out by the use of MapQTL 4.0 (Van Ooijen et al., Reference Van Ooijen, Boer and Jansen2002) with the new genotypes at the CRT locus, and available genotype data of the 117 markers previously genotyped and phenotypic data of the 380 progeny (Wang et al., Reference Wang, Lo, Zhu and Yue2006). Interval mapping and multiple QTL model mapping were used to detect any significant association between traits and marker loci in the data sets. The logarithm of odds score significance thresholds were calculated by permutation tests in MapQTL 4.0, with a genome-wide significance level of α < 0.05, n = 1000 for significant linkages and a linkage-group-wide significance level of α<0.05, n = 1000 for suggestive linkages.
ANOVA was carried out to determine the difference of trait values between the two genotypes (C/C and G/C) of the locus CRT (SNP6), as the SNP6 was the only informative SNP in the QTL mapping family. The analysis was conducted using the general linear model procedure of SAS (SAS Institute Inc., Cary, NC, USA). The following statistical model was used: Yi = μ + Gi + εi, where Yi was the phenotypic value of the target trait; μ was the population mean; Gi was the effect of the i-th genotype and εi was the random residual.
Analysis of the association between the SNP6 and mortality after cold challenge
About 200 fish at the age of 30 dph from a mass cross between 10 males and 10 females originating from a wild population in Singapore were challenged at 16°C for 5 h. Fin clips of 48 dead fish and 48 live fish were collected, and stored in absolute ethanol. DNA was extracted using a method that we developed (Yue and Orban, Reference Yue and Orban2005). For the 200 fish, we conducted parentage assignment by genotyping the 20 potential parents and all 200 offspring using nine microsatellites as conducted in our previous study (Wang et al., Reference Wang, Lo, Zhu, Lin, Feng, Li, Yang, Tan, Chou, Lim, Orban and Yue2008). After parentage analysis, we knew that the 200 fish originated from 18 families, including five male and six female parents. As the SNP6 (C/G) was the only informative SNP in the mass cross, this SNP was genotyped using SnapShot technology. As in each of the 18 families the number of offspring was rather small (two to nine individuals), we did not include the family as a cofactor in the statistical analysis. Difference in allele frequency at the SNP6 locus in the 48 live and 48 dead fish was analyzed using chi-square test.
Results
cDNA and genomic organization of the CRT gene in Asian seabass
During the sequencing of ESTs from cDNA libraries of Asian seabass, we identified a clone containing the CRT gene by BLAST analysis. The whole length of the cDNA of the CRT genes was obtained by sequencing. It was 2194 bp long, containing a 113 bp 5′ UTR and an 818 bp 3′ UTR. Its ORF was 1263 bp in length, encoding 420 amino acids. A putative polyadenylation signal (ATTAAA) was recognized at the nucleotide position 2243 to 2248 (see Figure S1). The deduced amino acid sequence contained several features that are common to reported CRT gene in humans (Rokeach et al., Reference Rokeach, Haselby, Meilof, Smeenk, Unnasch, Greene and Hoch1991), mice (Michalak et al., Reference Michalak, Corbett, Mesaeli, Nakamura and Opas1999) and rainbow trout (Kales et al., Reference Kales, Fujiki and Dixon2004). The amino acid sequences encoded by isolated CRT genes could be divided into three major domains (Figure S1). Two potential CRT family signature motif KHEQKIDCGGGYV and IMFGPDICGY, which are highly conserved among CRTs in different organisms, were observed. The P domain was rich in proline and divided into two triplicate repeats (M1 repeat-1, 2, 3 and M2 repeat-1, 2, 3). The C domain was abundant in aspartic and glutamic acids and terminated with the ER-retrieval sequence KDEL (Figure S1). The genomic structure of the CRT gene was determined by sequencing genomic fragments amplified by PCR. The length of the CRT gene from the start codon to the stop codon was 2772 bp, consisting of nine exons and eight introns. The longest exon was exon 9 (213 bp), whereas the shortest exon was the 1st exon (73 bp). The 1st intron spanned 450 bp, being the longest intron among the eight introns. The cDNA and genomic DNA sequences of the CRT gene of Asian seabass were deposited in GenBank under the accession numbers HM597712 and HM597713.
Expression of the CRT gene in different tissues
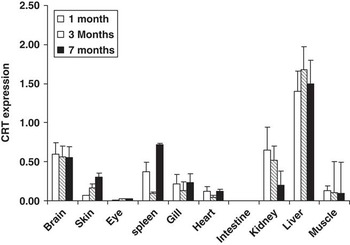
Expression of the CRT gene in different tissues of fish at 30, 90 and 210 dph was examined using qRT-PCR. Significant (P < 0.01) difference of the CRT expression was detected among different tissues and at different ages. The highest expression was seen in liver at the age of 30, 90 and 210 dph, whereas the expression of the CRT gene was almost not detectable in the intestine at all three stages (Figure 1). In the brain, skin, eye, heat kidney, spleen and muscle, its expression was detectable, but was significantly (P < 0.05) lower than that in the liver. In all three stages, the expression levels in some tissues (i.e. brain, eye, gill, heart and muscle) were similar (P > 0.05), whereas the expressions in spleen, kidney, liver and skin were different (P < 0.05) at 1, 3 and 7 months post hatch. In skin and kidney, the expression level was highest at 7 months post hatch, whereas in the liver the highest expression was seen at 3 months post hatch.
Expression of the calreticulin (CRT) gene in different tissues of Asian seabass at different developing stages (30, 90 and 210 days post hatch). Data are expressed as the ratio between the expressions of the CRT gene and the α-tubulin gene.

Expression of the CRT gene in the liver after cold challenge at 16°C
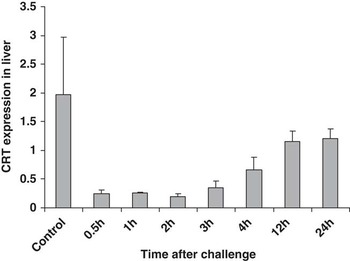
As under normal conditions the CRT gene was expressed highly in the liver, we examined its expressions in the liver of fish at the age of 30 dph after cold challenge at 16°C. Thirty minutes after cold challenge at 16°C, the expression of the CRT gene reduced down to eightfolds (P < 0.01), and this low expression level was maintained for 1 to 3 h after cold challenge. At 4 h after cold challenge, the expression of CRT began to rise if the fish survived the stress, but the expression level was three folds lower than the control (P < 0.05). At 24 h after cold challenge, the expression was still significantly (P < 0.05) lower than the control (Figure 2)
Expression of the calreticulin (CRT) gene in the liver of a 30-day-old Asian seabass at 30 min, 1, 2, 3, 4, 12 and 24 h after cold challenge at 16°C. Data are expressed as the ratio between the expressions of the CRT gene and the α-tubulin gene.

Detection of SNPs in the CRT gene
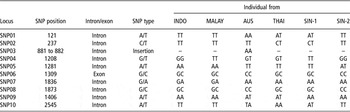
SNPs in the CRT gene were identified using six individuals from different regions. A total of 10 SNPs were identified (Table 2). Only the SNP6 (C/G, 1309) was located in exon 3 and did not change amino acid sequences, whereas the remaining nine SNPs were located in introns. The SNP03 was an insertion of amino acid, and the insertion was absent in all five fish from Southeast Asia, but present in the fish from Australia. The detailed information about the 10 SNPs is listed in Table 2.
SNPs detected in the CRT gene of six Asian seabass individuals

CRT = calreticulin; SNP = single nucleotide polymorphism; INDO = Indonesia; MALAY = Malaysia; AUS = Australia; THAI = Thailand; SIN = Singapore.
–, no AA sequence.
Linkage mapping
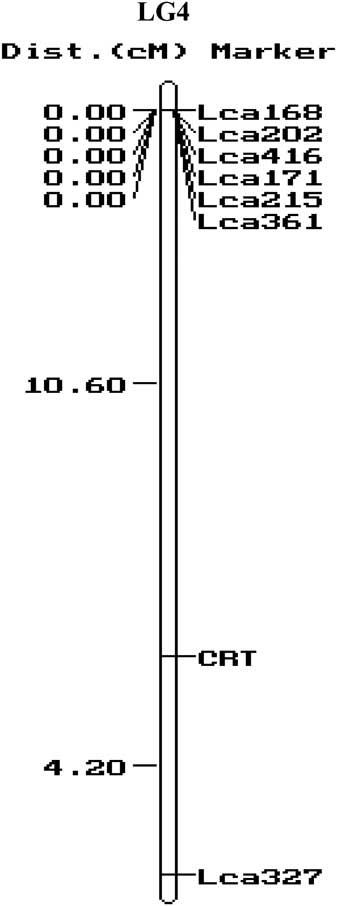
The SNP6 (C/G 1309) was genotyped in our mapping reference families using SNPshot technology. The CRT gene was located on linkage group 4 (LG4) between two markers Lca327 and Lca361 (Figure 3).
Location of the calreticulin (CRT) gene on the linkage group 4 (LG4) of Asian seabass revealed by linkage mapping.

Analysis of the association between the SNP6 and growth traits
The SNP6 was used to conduct an association analysis and QTL mapping as it was located in exon 3 of the CRT gene. In the QTL mapping family, two genotypes (C/C and G/C) were detected at the SNP6 locus. In the association analysis, the SNP6 was not associated with body weight, body length and condition factor (all P > 0.05). In the QTL mapping, no significant QTL was detected on the LG4 where the CRT gene was located.
Analysis of the association between the SNP6 and mortality after cold challenge
In the 48 live and 48 dead individuals after cold challenge at 16°C for 5 h, two genotypes (C/C and G/C) were detected at the SNP6 locus. Of the 48 live fish, 39 showed C/C genotype and nine showed G/C genotype, whereas of the 48 dead fish 36 showed G/C genotype and 12 showed C/C genotype. Allele frequencies at the SNP6 locus showed significant difference in dead and live fish (chi-square = 34.95, df = 1 and P < 0.001). The frequency of C allele was much higher in live fish (90.6%) than in dead fish (60.0%).
Discussion
We have cloned and characterized the CRT gene in Asian seabass. The ORF of the CRT gene in the Asian seabass was 1263 bp encoding 420 amino acids, similar to that of the rainbow trout (1260 bp; Kales et al., Reference Kales, Fujiki and Dixon2004) and humans (1257 bp; Fliegel et al., Reference Fliegel, Burns, MacLennan, Reithmeier and Michalak1989). The structure of the ORF was also similar to that of rainbow trout (Kales et al., Reference Kales, Fujiki and Dixon2004). Like its mammalian counterparts, this cDNA contained conserved cysteine residues believed to form a disulfide bond, a proline-rich region that includes a potential N-glycosylation site, and a highly acidic C-terminal domain terminating with the endoplasmic reticulum retrieval sequence, KDEL. The genomic structure of the CRT gene of the Asian seabass is similar to that in humans (Fliegel et al., Reference Fliegel, Burns, MacLennan, Reithmeier and Michalak1989), mouse and rainbow trout (Kales et al., Reference Kales, Fujiki and Dixon2004), consisting of nine exons and eight introns. However, the length of genomic sequences differs significantly among Asian seabass (2.8 kb), mouse (4.6 kb) and humans (3.6 kb), which may be related to the difference of the genome size and structure in different species.
The CRT gene is a multiple functional gene in humans, mice and some fish species (Michalak et al., Reference Michalak, Corbett, Mesaeli, Nakamura and Opas1999; Kales et al., Reference Kales, Fujiki and Dixon2004). In this study, we found that the CRT gene was expressed in all tissues tested except in the intestine. However, the expression level in different tissues differed. The highest expression was seen in the liver followed by that in the brain, spleen and kidney. This expression pattern is similar to that in rainbow trout (Kales et al., Reference Kales, Fujiki and Dixon2004). Furthermore, in three developing stages (1, 3 and 7 months post hatch), the expressions of the CRT gene in the four tissues – skin, kidney, liver and spleen – were significantly different, whereas in other tissues the expression levels were similar, suggesting that the CRT gene may be involved in immune functions as in fish the spleen, kidney and liver are immune organs. Previous studies demonstrated that the CRT gene was involved in immune responses in humans (Perrone et al., Reference Perrone, Tell and Di Lauro1999) and mice (Porcellini et al., Reference Porcellini, Traggiai, Schenk, Ferrera, Matteoli, Lanzavecchia, Michalak and Grassi2006). However, to our surprise, the expression level of the CRT gene was not detectable in the intestine, whereas in rainbow trout this gene was expressed in every tissue. The reasons for this difference between Asian seabass and the rainbow trout warrants further study.
We have detected 10 SNPs in the CRT gene. The majority of SNPs were located in non-coding regions. The SNP6 located in the 3rd exon of the CRT gene did not change the amino acid sequence. These detected SNPs in the CRT gene could be useful for linkage mapping, association studies and QTL mapping. The CRT gene was mapped in LG4 of the linkage map of the Asian seabass (Wang et al., Reference Wang, Zhu, Lo, Feng, Lin, Yang, Li and Yue2007). The association study in the QTL mapping family and QTL analysis showed that the CRT gene was not associated with growth traits, suggesting that this gene may not play an important role in the early growth of Asian seabass.
In rice and Arabidopsis, the expression of the CRT gene was related to cold stress or resistance to salinity stress (Komatsu et al., Reference Komatsu, Yang, Khan, Onodera, Toki and Yamaguchi2007; Li et al., Reference Li, Cao, Zhang and Chen2008). In this study, the expression of the CRT gene in the liver reduced sharply after 0.5 to 2 h of cold challenge and then increased slowly in live fish that were able to recover from the stress. The significant response of the CRT gene to cold challenge implies that the CRT gene may be involved in cold tolerance in Asian seabass. We further examined the difference of allele frequency at the locus SNP6 in live and dead fish after cold challenge at 16°C for 5 h and found that this polymorphism was associated with cold tolerance; the frequency of the C allele was much higher in live fish. Although the SNP6 is located in the coding region of the CRT gene, the mutation did not change the amino acid sequences. Therefore, this mutation is not a causative mutation for cold resistance. The significant association between the SNP6 and cold tolerance may be caused by a linkage of SNP6 with a QTL for cold tolerance. In the future, QTL for cold tolerance should be screened on the whole genome using DNA markers evenly covering the whole genome of Asian seabass. Certainly, differentially expressed genes in cold-tolerant and non-tolerant fish can also be identified using cDNA microarray in the future. The combination of gene expression and QTL analysis on the whole genome will lead to better understanding the mechanisms underlying cold tolerance in Asian seabass.
In conclusion, we have isolated the whole length of the cDNA of the CRT gene in the Asian seabass, studied the expression levels under normal condition and after 16°C cold challenge, analyzed the genomic organization and polymorphism, and identified the association between the SNP6 and cold tolerance. Our results suggest that the CRT gene may be involved in cold tolerance in the Asian seabass. Further investigation will be required to illustrate the underlying mechanisms.
Acknowledgments
This study is funded by Ministry of National Development for the project ‘To ensure self-sufficiency of safe seafood for Singapore through the development of aquaculture genomic tools for marker-assisted selective breeding of tropical marine foodfish’. The authors thank the staff at Marine Aquaculture Center, Agri-Food & Veterinary Authority of Singapore for their technical support in spawning.
Supplementary materials
The supplementary material referred to in this article is available online at http://www.journals.cambridge.org/anm