Implications
This study shows that it is possible to predict diet digestibility in pigs by NIRS analysis of faeces. The easy measurement of digestibility, with low cost and low animal disturbance, would allow experimental designs with a high number of animals, especially in the context of genetic studies on digestion capacities of animals. From a practical point of view, a rapid estimate of digestibility without heavy experimental facilities could be used in field studies.
Introduction
The increasing cost and scarcity of raw materials necessitate managing feeding as closely as possible to the requirements of animals. It is, therefore, essential to know precisely the nutritional value of resources and to adapt the formulation matrices to the actual value of these resources. Because of the high cost of in vivo measurements of energy and nutrient digestibility, especially in large-sized animals such as pigs, feed characterization is most often performed by chemical analysis of samples and by the application of prediction equations that relate the composition vector to nutritional properties for a category of animals (Le Goff and Noblet, Reference Le Goff and Noblet2001; Carré et al., Reference Carré, Lessire and Juin2013). It can also be performed by NIRS with calibration equations predicting nutritional value from feed spectrum within a specific family of ingredients (e.g. Zijlstra et al., Reference Zijlstra, Swift, Wang, Scott and Edney2011). The NIRS is based on the absorption of (IR) light by the chemical bonds of samples. Although the NIRS’ predictive power basically concerns chemical components of samples, the spectra can be related to more complex parameters (e.g. nutritional value) according to the relationships that can exist between these parameters and the chemical (or chemico–physical) properties of the samples.
Although the diet has a potential nutritional value, its actual utilization by the animal depends on several factors of variation, including the BW, or the age, of the animal (Le Goff and Noblet, Reference Le Goff and Noblet2001) or its genetic background (Noblet et al., Reference Noblet, Gilbert, Jaguelin-Peyraud and Lebrun2013). Faeces represent the end-product of the digestive process, and thus contain information on both the feed itself and the history of its transit through the animal digestive tract. In poultry, it has been shown that valuable information on digestibility can be retrieved by analysing excreta (Bastianelli et al., Reference Bastianelli, Carré, Mignon-Grasteau, Bonnal and Davrieux2007). These studies performed on broilers have been done by NIRS, based on the fact that the spectra contained mixed chemical and physical (color, particle size, etc.) information on the samples, thus maximizing the quantity of information related to digestive processes. To date, no similar experiment has been reported in pigs.
The present trial is based on the samples originating from the experiment of Noblet et al. (Reference Noblet, Gilbert, Jaguelin-Peyraud and Lebrun2013). This experiment has the advantage of being performed with a unique feed fed to animals varying in genetic background and age or BW. The feed effect is absent, and the difference observed in faeces, therefore, comes only from the digestive process. Taking advantage of this experimental context, the objective of this study was to evaluate to what extent NIRS can detect what happened during digestion in the pig, through calibration of digestibility parameters.
Material and methods
Experiments
The experiments were conducted in accordance with the French legislation on animal experimentation, welfare and ethics. A total of 200 digestibility collections were carried out on 20 castrated male pigs. The animals with a variable genetic background (Large White breed from four different boars) were tested for digestibility each week by total collection of excreta for 5 days (no collection on Friday and Saturday) during 10 consecutive weeks (from 30 to 95 kg BW) after a 1-week adaptation period to the diet and the cages. They were fed a high dietary fibre diet (NDF=21.4% DM) in order to maximize potential digestibility differences between boar origins and their variations with BW increase. The feed was distributed as pellets in two meals per day and slightly below the ad libitum level. The detailed description of the experiment is given in Noblet et al. (Reference Noblet, Gilbert, Jaguelin-Peyraud and Lebrun2013).
Samples and analyses
Feed was sampled weekly, and all the samples were pooled at the end of the experiment for further chemical analyses of the diet. Faeces were collected daily and totally and stored at +4°C. Faeces corresponding to a collection week (5 days) of one pig were pooled, homogenized, sampled, freeze-dried and ground (1-mm sieve) for chemical analyses. Gross energy (bomb calorimeter model C5000, IKA-Werke, Staufer, Germany), total nitrogen content (Dumas combustion method) and minerals (ashing at 550°C) were measured on feed and faeces, allowing the calculation of digestibility coefficients of dry matter (dDM, %), organic matter (dOM, %), energy (dE, %) and nitrogen content (dN, %) (Noblet et al., Reference Noblet, Gilbert, Jaguelin-Peyraud and Lebrun2013). Total nitrogen (N, % DM) and apparent digestible energy contents (ADE, kJ/kg DM) were expressed relatively to DM. All these parameters were available for each pig at each week of the trial. In total, 4 weekly measurements were discarded (one for diarrhoea and three for important feed refusals); therefore, 196 digestibility data were available for this study.
NIRS
NIR spectra were recorded on the same faeces samples that were used for chemical analyses – that is, freeze-dried and ground. Samples were scanned on a monochromator spectrometer NIRSystem 6500 (FOSS, Laurel, MD, USA) in reflectance mode from 400 to 2500 nm (with 2 nm steps). Samples were presented in circular cups equipped with a quartz window (diameter 36 mm). An illustration of the faeces spectra is given in Supplementary Figure S1. Spectra were taken in duplicate (two different cup fillings) and were averaged. Various mathematical treatments of spectra were tested in order to optimize the performance of calibration models (Naes et al., Reference Naes, Isaksson, Fearn and Davies2002): derivation order (no derivative, first order or second-order derivative), smoothing and derivation gap (on 5, 10, 15 or 20 data points) and standardization options for spectra (standard normal variate, detrending, multiplicative scatter correction).
Calibration models were obtained by partial least square regression (Wold et al., Reference Wold, Ruhe, Wold and Dunn1984) with the MPLS procedure of WINISI software (version 4; Infrasoft International, Port Matilda, PA, USA). The spectral database was randomly split into the following two subsets: the CAL database (146 samples) used for calibration and the VAL database (50 samples) used for validation. The statistical evaluation during model building was done on calibration process (R 2 cal and SEC for standard error of calibration) and on cross-validation process (R 2 cv and SECV for standard error of cross-validation), as stated by Naes et al. (Reference Naes, Isaksson, Fearn and Davies2002). Cross-validation was performed on four groups, by sequentially calibrating on three groups and validating on the fourth group. Subsequently, the calibration models were applied to the VAL database for validation, leading to the determination of R 2 val and standard error of prediction (SEP). The agreement between measured and predicted values was described by the slope of the regression, and the bias was defined as the mean of the differences between observed and predicted values (Naes et al., Reference Naes, Isaksson, Fearn and Davies2002).
Results
Range and variability of the parameters
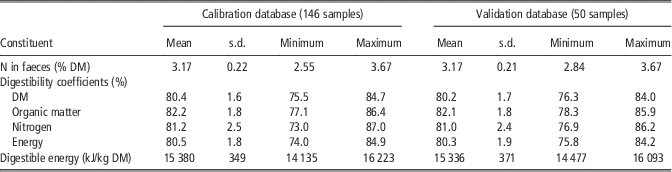
Although the diet was the same for all the animals in all periods, the digestibility parameters were quite variable (Table 1). Coefficients of variation were 2.1% for dDM and dOM, 2.4% for dE, 3.1% for dN and 2.4% for ADE, whereas CV of total N content of faeces was 6.9%. There was a significant effect of the age of the animals (P<0.001 for all parameters) and of the boar origin (P<0.01 for all parameters, except P=0.025 for dN).
Range and variability of calibration and validation databases

DM=dry matter.
Calibration equations
The precision of calibration models was influenced by the mathematical pre-treatments applied to the spectra. Derivative spectra led to better models than raw spectra; second-order derivative was often the best treatment. Detrending of spectra, associated or not with normalization, was also beneficial. Within the various types of second-order derivative and detrending, all combinations of parameters led to similar results, so that a unique mathematical pre-treatment of spectra could be used for all the variables studied. The combination of parameters leading to the best overall results was chosen in this paper and corresponds to spectra treated with second-order derivative and smoothed with a gap of 5 data points (i.e. 10 nm), after detrending and normalization.
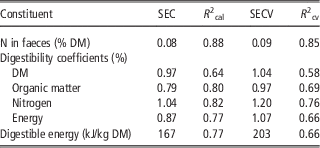
The statistics of calibration models are given in Table 2. The calibration for N content of faeces was quite precise, with an R 2 of 0.88 and an SEC of 0.08%, which is close to the repeatability of the laboratory measurement, about 0.09% in our laboratory. The dDM and dOM had R 2 values of 0.64 and 0.80, respectively, which correspond to SEC values of 0.97% for dDM and 0.79% for dOM. Calibration for dE had an intermediate precision with R 2 of 0.77 and SEC of 0.87%. Apparent digestible energy content, expressed on DM basis, had the same R 2 than dE and an SEC value of 167 kJ/kg DM. Calibration for dN showed a slightly higher error (SEC of 1.04%), but a higher R 2 related to a higher variation in the population (R 2=0.82).
NIRS calibration and cross-validation statistics for faeces N content and digestibility parameters and apparent digestible energy in growing pigs (calibration database, 146 samples)
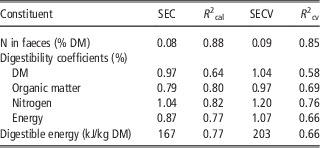
SEC=standard error of calibration; R 2 cal=coefficient of determination of calibration; SECV=standard error of cross-validation; R 2 cv=coefficient of variation in cross-validation; DM=dry matter.
Validation
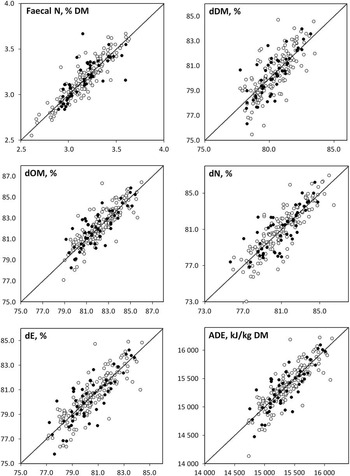
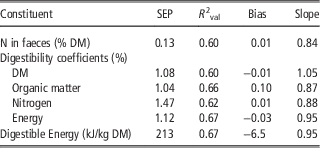
The first validation was done through cross-validation on the CAL database. The results are shown in Table 2. The SECV values are slightly above the SEC values, but the difference does not exceed 20%. The conclusions on the predictability of digestibility parameters are the same as for calibration parameters. The second validation corresponds to an ‘external’ validation performed on 50 samples measured in the same conditions but not included in the calibrations. Table 3 presents the results of this validation, including SEP, as well as bias and slope of the regressions between measured and predicted values. The bias was always very low, and the slope was not significantly (P>0.05) different from 1 for all parameters. The SEP values were higher than the calibration errors (SEC). For most parameters, they were close to SECV values; however, in the case of N and dN, they were much higher. As illustrated in Figure 1, validation of N content results in three outlier values that increase the error: SEP is 0.13% with these points but only 0.08% when the three points are removed. To a lesser extent, the situation is comparable for dN: SEP is 1.47% (R 2=0.62) with all points and falls to 1.32% (R 2=0.69) with two outlier points removed. These two points are the ones with the highest prediction error for N content. This can be due to laboratory error in N determination, with subsequent impact on dN calculation, or due to the fact that these points could be intrinsically less well predicted by NIRS for these two parameters. However, the error in these two samples for other digestibility parameters is not particularly high.
NIRS calibration of digestibility in the pig. The figures represent measured (x axis) v. predicted (y axis) values for the calibration data set (146 samples, open circles) and the validation data set (50 samples, solid circles) for faecal N content (N) and digestibility of dry matter (dDM), organic matter (dOM), nitrogen content (dN), energy (dE) and apparent digestible energy content (ADE).

NIRS validation statistics for faeces N content and digestibility parameters and apparent digestible energy in growing pigs (validation database, 50 samples)
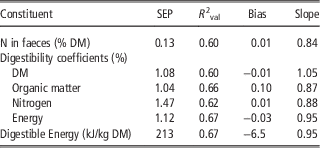
SEP=standard error of prediction; R 2 val=coefficient of determination in validation; Bias, Slope=characteristics of the regression between predicted and measured values; DM=dry matter.
Discussion
The results obtained in this study clearly show that some information on digestibility is present in pig faeces: digestibility of DM, energy or nitrogen content in pigs can be predicted by NIRS on faeces. To our knowledge, there is no existing reference on faecal NIRS prediction of nutritional value in the pig, although some references exist on prediction with feed spectra (e.g. Zijlstra et al., Reference Zijlstra, Swift, Wang, Scott and Edney2011). The relatively low variation in digestibility in our data set makes it quite difficult to obtain good calibration models. On the other hand, the fact that all animals are fed the same diet prevents from having sub-groups only due to diet differences. This study isolates the ‘animal’ factor of variation of digestibility, in the same way as in experiments previously reported in poultry (Bastianelli et al., Reference Bastianelli, Carré, Mignon-Grasteau, Bonnal and Davrieux2007).
A limitation of the present study is the moderate variation in the animals. Only 20 Large White pigs were involved, with repeated measures at different ages, and the validation set was, therefore, not fully ‘external’ in the sense that the animals used for validation were closely related to those in the calibration set. Therefore, the extrapolation capacity of the models developed was limited. However, the pigs represented different families (four males and different females; Noblet et al., Reference Noblet, Gilbert, Jaguelin-Peyraud and Lebrun2013), and the variable age ensured the robustness of the models to this factor.
Total nitrogen content is not directly linked with digestibility, but the calibration shown here is interesting because it allows comparison with published NIRS prediction of chemical composition of pig faeces/manure (e.g. Yang et al., Reference Yang, Han and Fan2006). The precision of the calibration obtained here is good (SEC=0.08%, and SEP=0.13% with all samples and SEP=0.09% when three outliers are removed) and is in the same range of – or better than – published data on calibration of N content in pig manure (SEC=0.11%, Yang et al., Reference Yang, Han and Fan2006), in poultry excreta (SEC=0.23%, Bastianelli et al., Reference Bastianelli, Bonnal, Juin, Mignon-Grasteau, Davrieux and Carré2010) or in rabbit faeces (SECV=0.08%, Meineri et al., Reference Meineri, Peiretti and Masoero2009). Therefore, the performance of N calibration models shows that there was no problem with the experiment, spectra acquisition and reference data in general.
Calibration for dDM had an error around 1.0%, which is quite precise in absolute value, even if the relatively low variation of the database (s.d.=1.6%) leads to a low R 2 value. The r.s.d. in the models presented in the experiment described by Noblet et al. (Reference Noblet, Gilbert, Jaguelin-Peyraud and Lebrun2013) was 1.1%, which is very close. Most data published in other animal species on dDM were obtained from more variable databases and have, therefore, higher R 2 values, despite higher prediction errors (SEC or SECV), generally ranging between 1.5% and 2.0%. In poultry, Coulibaly et al. (Reference Coulibaly, Métayer, Chartrin, Mahaut, Bouvarel, Hogrel and Bastianelli2013) obtained an SEC of 2.0% (SECV=2.3%) and an R 2 of 0.83 with a quite variable database (CV=8.5%). In rabbits, Núñez-Sánchez et al. (Reference Núñez-Sánchez, Martínez Marín, Pérez Hernández, Carrion, Gómez Castro and Pérez Alba2012) had an SECV of 1.7% (R 2=0.69). In ruminants, Li et al. (Reference Li, Tolleson, Stuth, Bai, Mo and Kronberg2007) obtained an SEC value of 1.5% and SEP around 2.0% in sheep, whereas in cattle Boval et al. (Reference Boval, Coates, Lecomte, Decruyenaere and Archimède2004) had an SEC of 2.0% and Coates and Dixon (Reference Coates and Dixon2011) had an SEC of 1.87%, which are less precise than the results obtained in the present study.
Energy digestibility was slightly more variable than dDM, leading to better R 2 values of calibration models, despite similar SEP values. ADE SEC was 167 kJ/kg DM, to be compared with the error of 451 kJ/kg DM reported in faecal NIR prediction of ME in poultry (Coulibaly et al., Reference Coulibaly, Métayer, Chartrin, Mahaut, Bouvarel, Hogrel and Bastianelli2013). In the rabbit, Meineri et al. (Reference Meineri, Peiretti and Masoero2009) obtained an SECV value of 1.6% of energy digestibility, corresponding to a 283 kJ/kg DM error on DE. In all cases, the R 2 values were around 0.80 in calibration models and lower in validation models.
Nitrogen digestibility led to better prediction models in connection with a higher variability in the population: SEC was 1.04% (R 2=0.82), whereas SEP was 1.32% (R 2=0.69, with two outliers removed). These values are of the same magnitude as the r.s.d. of ANOVA models in the publication of Noblet et al. (Reference Noblet, Gilbert, Jaguelin-Peyraud and Lebrun2013) with the same data. In poultry, Coulibaly et al. (Reference Coulibaly, Métayer, Chartrin, Mahaut, Bouvarel, Hogrel and Bastianelli2013) reported SEC of 2.42% (R 2=0.73) for faecal prediction of dN. In rabbits, Meineri et al. (Reference Meineri, Peiretti and Masoero2009) obtained SECV of 1.92% (R 2=0.70) and Núñez-Sánchez et al. (Reference Núñez-Sánchez, Martínez Marín, Pérez Hernández, Carrion, Gómez Castro and Pérez Alba2012) reported SECV of 1.47% (R 2=0.86). Thus, similar to energy digestibility, the precision of the present models was better than those in the literature, but the magnitude of R 2 was similar, suggesting that the proportion of variation that can be captured by NIRS is about the same.
Overall, this study reports SECs around 1% for all digestibility parameters and validation errors between 1.0% and 1.5%. This is quite precise if we consider that these are individual measurements. In the case of data resulting from several individual measurements, the error would be decreased – for example, in the validation set of this study, there are on average five animals per experimental period (50 validation points covering 10 periods), and the error on the prediction of average dDM per period is 0.57%, against 1.08% for individual measurements.
As stated previously, this experiment investigated the animal factor only, as the diet was the same for all the animals. This situation could occur in genetic studies where the objective is to identify the digestive capacity of animals and the heritability of this trait (Mignon-Grasteau et al., Reference Mignon-Grasteau, Muley, Bastianelli, Gomez, Sellier, Millet, Besnard, Hallouis and Carré2004). The present work showed that for a particular feed, calibration of digestibility could be achieved with about 150 samples. This number could even be reduced by building a calibration strategy limiting the redundancy between calibration samples, although in the present case we had several pigs for each combination of age and genetic background. It can be anticipated that a number of 80 to 100 reference data would be a sufficient number of samples to start with.
In a more general context, the use of NIRS could be extended to the study of feed digestibility itself. In this case, the diets can be very variable and the database would not have the same characteristics at all. The prediction error in digestibility would probably be higher, which can explain the favourable comparisons presented above with poultry or rabbits in the context of quite variable feeds (Núñez-Sánchez et al., Reference Núñez-Sánchez, Martínez Marín, Pérez Hernández, Carrion, Gómez Castro and Pérez Alba2012; Coulibaly et al., Reference Coulibaly, Métayer, Chartrin, Mahaut, Bouvarel, Hogrel and Bastianelli2013). When the calibration databases cover a wide range of feeds, a possibility of improving calibration models is to combine the information coming from the feed and the faeces. Both NIR spectra can be used together to obtain a satisfactory prediction. This has been tested in ruminants (Decruyenaere et al., Reference Decruyenaere, Lecomte, Demarquilly, Aufrere, Dardenne, Stilmant and Buldgen2009), and the prediction errors decreased by 10% to 20% compared with faecal spectra only. In rabbits, the advantage of such a strategy was not constant and appeared mainly for digestibility of protein and fats (Meineri et al., Reference Meineri, Peiretti and Masoero2009). In contrast, combining spectra of feeds and faeces showed considerable advantages in poultry (Coulibaly et al., Reference Coulibaly, Métayer, Chartrin, Mahaut, Bouvarel, Hogrel and Bastianelli2013), where error on dDM prediction was decreased by 35% and error on apparent metabolizable energy was more than halved (218 v. 452 kJ/kg DM). No data exist in pigs, but the comparison with poultry suggests that in the case of a database with very variable feeds, the concatenation of feed and faeces spectra would be useful. From a more general point of view, one perspective for better prediction models is to combine faeces spectra with other sources of information (Bastianelli, Reference Bastianelli2013), which can be quantitative (feed spectra or chemical composition), semi quantitative (feed ingredient formula) or qualitative (presence of enzymes, technological treatments of feeds, etc.).
Acknowledgements
The authors gratefully acknowledge Regis Janvier, Yvon Billon, Thomas Lebrun, Francis Le Gouevec, Anne Pasquier and Agnès Starck for their technical assistance.
Supplementary Material
To view supplementary material for this article, please visit http://dx.doi.org/10.1017/S1751731114003097