


1. Introduction
The crystal structure of ice Ih has an hexagonal symmetry, and, in accordance with Neumann’s Principle (see, e.g. Nye, 1957, p. 20–24), the physical properties of the ice crystal must, in turn, have at least this symmetry. In the case of those physical properties which are represented by second-rank tensors, such as the electrical properties, this implies that the tensors have at the most two independent coefficients, with the hexagonal symmetry axis of the crystal coinciding with an axis of rotational symmetry of the physical property. Hence the dielectric constant of ice may be uniaxially anisotropic, and ice may possibly exhibit uniaxial birefringence, although not definitely, since Neumann’s Principle only predicts the minimum allowable symmetry of the physical property.
The existence of birefringence in ice at optical frequencies is well known, and it has been used, as in many other minerals, to determine crystal orientation fabrics of natural poly-crystalline samples (Langway, 1958). The birefringence is very small in comparison with most other minerals, and corresponds to a difference between the two principal values of the dielectric constant of 3.7 × 10⁻³, or 0.2% at — 1°C and the frequency of the sodium-D line (Ehringhaus, 1917). It has been suggested that this anisotropy, an anisotropy of the electronic polarization in ice, is caused by an anisotropy of the local field in the ice lattice (Johari, 1976). The absorption of light at optical frequencies appears to be isotropic within the limits of experimental accuracy (Lyons and Stoiber, 1959, p. 13), and the early measurements by Plyler (1924) which detected an anisotropy of absorption in the near infra-red have not been confirmed by Ockman (1958) and Lyons and Stoiber (1959, p. 13).
Little is known about the existence of anisotropy in the vibrational polarizations which contribute to the dielectric response at radio frequencies. Preliminary results of isotopic dilution studies (private communication from M. Falk) of the OH (or OD) stretching resonances show that OH stretchings occurring parallel to the r-axis of the crystal are indistinguishable from the other OH stretchings. There is unlikely to be a significant contribution to the anisotropy of the dielectric constant from this mechanism. Johari and Charette (1975) present the most recent measurements of the dielectric properties of ice in the radio frequency range. They conclude that the anisotropy in the dielectric constant is less than 1%; the difference between the principal values is therefore not greater than about 3.2 × 10⁻².
Johari and Jones (1978) are unable to detect any anisotropy in the static dielectric constant of ice, to within 2%, although both Humbel and others (1953) and Von Hippel and others (1972) have observed a significant anisotropy. The consequent anisotropy in the conductivity at frequencies above the low-frequency dispersions has been observed by Ruepp (quoted in Paren, unpublished). Johari and Charette (1975), however, did not observe any anisotropy in their absorption measurements, although within the limits of their accuracy a difference as large as 6% would remain undetected.
Thus we can say, on the evidence to date, that the upper limit of the radio-frequency anisotropy of the dielectric constant is set by the measurements of Johari and Charette (1975). Although the sign and magnitude of the anisotropy of the vibrational polarizations contributing to the radio-frequency dielectric constant are not known, it would seem unlikely that it should cancel the anisotropy of the electronic polarization, also contributing to the radio-frequency dielectric response. As a tenative lower limit of the anisotropy, we might use the anisotropy of the dielectric constant at optical frequencies, which is equivalent to a difference between the principal values of 3.7 × 10⁻³.
There have been several observations of a change in the polarization state of radio waves after propagation and reflection in polar ice sheets (Jiracek, 1967; Bogorodskiy and others, 1970; Kluga and others, 1973), which could be attributed to the birefringence of the ice crystal, among other possibilities. From radio-echo observations in the region of DYE-3 base in central southern Greenland, Hargreaves (1977, unpublished) shows that the radio echo reflected from the internal layers of the Greenland ice sheet is elliptically polarized, and, by observing the change of the polarization of reflections from successively deeper layers, obtains an estimate of the birefringence of the ice sheet. On the assumption that the optic axis of the ice sheet is at 90° to the direction of propagation, Hargreaves obtains a value of 1.0 × 10⁻³ for the difference between the principal values of the dielectric constant of the ice sheet. If the optic axis is at any other orientation, the anisotropy must be larger, to account for the observed level of birefringence, and Hargreaves’ estimate is thus the minimum possible value of the anisotropy. If we attribute the birefringence of the ice sheet to the existence of an anisotropy of the dielectric constant of the ice crystal at radio frequencies, we must further say that since the crystal c-axes in polar ice are not all perfectly aligned, although there may well be some preferred orientations, Hargreaves’ estimate is also the minimum possible value of the anisotropy of the single crystal.
The question then arises as to how we can relate measurements on polycrystalline ice (with a certain orientation distribution of crystal c-axes) to the conjectured birefringence of the single ice crystal. By answering this question, we will be able to investigate the plausibility of explaining the observed birefringence of the ice sheet as a combination of the two effects: an anisotropy of the single-crystal dielectric constant plus an ordering of the ice-crystal orientations. We will also be able to obtain an estimate of the value of the single-crystal anisotropy which it is necessary to assume in order to explain the experimental observations of ice-sheet birefringence.
2. The birefringence of a polycrystalline medium
One possible approach to the problem of evaluating the dielectric tensor of polycrystalline ice is to treat the medium as a mixture of different dielectrics, the different dielectrics being the individual crystals, and each having a different dielectric tensor by virtue of their differing orientations. Methods of deriving dielectric constants for mixtures of isotropic materials are well established (see Beek, 1967, for a review); an example of their application would be the derivation of the dielectric constants of different snows, which are mixtures of ice and air or water (Evans, 1965; Glen and Paren, 1975). We will here follow closely the treatment of Polder and van Santen (1946), extended, however, to a mixture of anisotropic dielectrics.
If DM and EM are the macroscopic flux-density and electric field vectors, then the relationship:

defines the dielectric tensor ε′ which describes the macroscopic electrical properties of the medium. The macroscopic field vectors are the volume average of the fields in each crystal (Panofsky and Phillips, [c1962], p. 33–36). The volume average is over a volume which is small compared with the wavelength we are considering, and yet is sufficiently large compared with the size of the individual crystals to contain a representative sample of the crystal-axis orientations. If the wavelengths are of the order of a metre, this condition can be satisfied if the average crystal size is of the order of a few millimetres, which is the case in polar ice from the centre of an ice sheet in all except the lower part of the ice sheet (see, e.g. Gow and Williamson, 1976, for results from the “Byrd” station bore hole in West Antarctica).
In each crystal we have the relationship D = ε 0ε(j). ?, where D and E are the field vectors in the crystal and ε(j) is the dielectric tensor of the crystal. By summing ε 0ε(j). ? over all the crystals, each of which is in a volume V j , or volume fraction f j of the total volume V, we obtain:
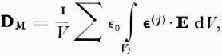
which for convenience we will write as:

where Em (j) is the mean electric field in crystal j.
The problem now is to relate the mean field in each crystal to the macroscopic field, which is the average electric field throughout the volume. An exact solution to this problem docs not exist. In general, we can relate Em (j) to the macroscopic field by a relationship such as:

where α(j) is a tensor which is a function of the shape and orientation of the crystal and of ε′.
If the crystals are only weakly anisotropic, and are reasonably close to being spherical (both of which conditions are likely to be satisfied in polar ice) then it can be shown (see Hargreaves, unpublished) that an approximate expression for α(j) is

I being the unit matrix, and Δ(j) being a matrix whose coefficients are all of the order of Δ, the characteristic difference between the principal values of the dielectric tensor of the crystal, and are thus small compared with any of the principal values. Substituting Equation (3) into Equation (2) and by comparison with Equation (1),

and since the last term in this expression is of the order of Δ2, we have, to a first order in Δ:

Equation (4) may be written in an integral form by defining a probability function for the distribution of crystal orientations, weighted according to volume, and by writing each component of ε(j) explicitly as a function of the crystal orientation. Since, for ice, the medium is uniaxial, we can define the orientation of the optic axis of each crystal by spherical coordinates (θ, φ), If the orientation probability function is ρ(θ, φ), then the proportion of crystals whose optic axes are in the range θ to θ + dθ, φ to φ + dφ, is ρ(θ, φ) sin θ dθ dφ. All the crystals have the same principal values of the dielectric tensor; in the principal coordinates (different for each crystal) the dielectric tensor is

and by the usual tensor transformation, a crystal with the optic axis at an orientation (θ, φ) has a dielectric tensor

Equation (4) becomes:

Since the optic axis is centro-symmetric ρ(θ, φ) = ρ(π — θ, φ + π) and in addition ε(θ, φ) sin θ = ε(π — θ, φ + π) sin (π—θ), hence the limits of integration in Equation (5).
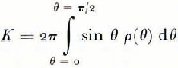
If the distribution is symmetrical about the z-axis, that is, if ρ is a function of θ only, then the only non-zero terms in Equation (5) are

K is the normalization constant
Normally we would choose to evaluate ε′ in the most convenient set of coordinates. For instance, if there is an axis of symmetry in the crystal axis distribution, we would use this as our z-axis, and obtain ε′ from Equations (6). Even if the distribution as a whole does not have a convenient axis of symmetry it might be possible to split the distribution into separate parts which are individually symmetric, and evaluate the dielectric tensor, ε i ′, for each part i (which occupies a total volume V i ), Then the dielectric tensor of the total distribution is:

where the second sum is over all crystals j in part i

Each ε i ′ may be evaluated in the most convenient coordinates, and then transformed to the coordinates chosen for ε′.
As a general comment on the above treatment, we should note that we have included in our expressions only the bulk polarization, and interfacial polarization, which gives rise to a Maxwell–Wagner dispersion, has been ignored. However, the treatment may be extended to obtain the frequency dependence of the dielectric tensor, and it can be shown that the Maxwell Wagner dispersion occurs well below radio frequencies.
Knowing the distribution of crystal-axis orientations (the crystal fabric as it is normally called), we may use the treatment above to evaluate the dielectric tensor of a piece of poly-crystalline ice, given also the values of the single-crystal dielectric tensor. By solving Maxwell’s equations for wave propagation in a particular direction (see the Appendix), we can then obtain the level of birefringence for that direction of propagation.
3. Ice fabric and the birefringence of the ice sheet
The subject of crystal fabrics and their development in moving ice is dealt with in an extensive review by Budd (1972) which predicts certain types of fabric for different stress/strain situations in the ice sheet. Figure 1 shows the results of calculations of the dielectric tensor and birefringence for a few examples of these idealized fabric types.
In Figure 1.1 the distribution of axes is uniform within a cone of half-angle θ 0 and zero elsewhere. The z-axis is a symmetry axis of the distribution, and the values of components of the dielectric tensor are calculated using Equations (6). The medium is electrically uniaxial, the optic axis being the symmetry axis of the distribution. A wave propagating at an angle β to the z-axis has refractive indices n 1 and n 2 such that:

(from Hargreaves, unpublished, and the Appendix). The value of (ε
33
c —ε
11
c) is given in Figure 1.1(c). (ε
33
c—ε
11
c)/(b—a) is the relative anisotropy of the medium (relative to the full single-crystal anisotropy) and is shown in Figure 2.1 as a function of θ
0 (curve A). Note that when θ
0 = 90° the distribution of c-axes is uniform throughout all θ, the relative anisotropy, and hence the birefringence for all directions of propagation, is zero, and the (principal) values of the dielectric tensor are all equal to  , which is a standard result for the average of a uniformly orientated tensor. Figure 2.1 also shows the computed variation of the relative anisotropy of a Gaussian distribution of axes with half width θ
0, i.e. ρ
 exp (—θ
2/θ
0
2) (curve B). The relative anisotropy is smaller than that of the uniform conical distribution for small values of θ
0, but becomes larger at large values, since even when θ
0 is very large the second distribution is not completely uniform.
In Figure 1.2, the distribution is a girdle at an angle θ
0 about the z-axis. The z-axis is a symmetry axis of the distribution, and the medium is again uniaxial. The same comments apply as before for wave propagation at an angle β to the optic axis. The relative anisotropy is plotted in Figure 2.2 (curve A), which also shows the computed relative anisotropy for axis distributions which are Gaussian about θ
0, i.e. ρ
 exp {— (θ — θ)2/W
2}, where W is the half-width of the distribution (curves B, C, D). AS we would expect, the relative anisotropy at a particular value of θ
0 becomes smaller in magnitude as the width of the distribution increases.
The results of calculations of the dielectric tensor and birefringence for different examples of fabric types.

Finally, in Figures 1.3 and 1.4 the distributions are multiple-pole distributions. When the ice fabric is, for instance, a combination of two conical distributions orientated symmetrically about the vertical (the type of fabric predicted by Budd in a region of longitudinal extension and vertical compression), the dielectric tensor is obtained by using Equation (7), together with the results of Figure 1.1. From Figure 1.1 we can calculate the dielectric tensor of a conical distribution with a cone axis at an orientation of θ = θ
1, = φ = π/2, and for a similar cone at θ = θ
1, φ = 3π/2 (which in fact has identical diagonal components, but opposite sign off-diagonal components, compared with the other cone). If both distributions are of equal strength ( ) then the resulting dielectric tensor of the complete distribution is given in Figure 1.3. The refractive indices for propagation in the direction of the z-axis are obtained by solving Maxwell’s equations for wave propagation in this direction (see the Appendix). It is interesting to note that the two-pole distribution, although not without some symmetry about the z-axis, does in fact allow for birefringence when a wave propagates along the z-axis.
The anisotropy (ε33 — ε11)/(b—a) of some examples of fabric type relative to the single crystal anisotropy. In Figure 2. 1, curve A is the relative anisotropy of the distribution of Figure 1.1, plotted against θ0, and carve B is the relative anisotropy of a Gaussian distribution of crystal axes, with a half angle θ0 (i.e. p  exp (— θ2/θ0
2)). In Figure 2.2, curve A shows the relative anisotropy of the distribution of Figure 1. 2, again plotted against θ0. Curves B, C, D are the relative anisotropies of distributions which are Gaussian about θ0 (ρ
 exp {— (θ —θ0)2/W2}) with half-widths W of 10°, 20°, and 30° respectively.

By adding in two more cones, at φ = 0 and φ = π, we can obtain the equivalent results for a four-pole distribution, which are shown in Figure 1.4. In this case there is no birefringence for wave propagation along the z-axis.
Turning our attention to the field measurements of birefringence at DYE-3, we are faced with the unfortunate fact that there is no experimental information on the ice fabric at depth in this part of the Greenland ice sheet (although there has been a 400 m core drilled at DYE-3, no fabric analysis has been made to date). It is obvious that we can combine an infinite number of fabric types with an appropriately chosen value ?f the single-crystal anisotropy in order to obtain a birefringence equal to that observed in the field measurements. We are, however, as indicated earlier, limited to a value of the single-crystal anisotropy within the range of 1%, or (b—a) = 3.2 × 10⁻², as an upper limit and a value equal to the anisotropy at optical frequencies, equivalent to (b—a) = 3.7 × 10⁻³, as a tentative lower limit. Can we construct a plausible crystal fabric which, together with a value of (b—a) in this range, would account for the observed level of birefringence?
DYE-3 station is situated just down-stream from an ice divide, and measurements by S. J. Mock (U.S.A. CRREL, private communication) have shown that the surface strain-rates are small (of the order of 10-4 years-1 compared with 10-3 years-1 on the Ross Ice Shelf (Crary, 1961)), and are predominantly extensive longitudinally and compressive vertically, with a slight transverse extension. On the basis of Budd’s analysis we would predict that the fabric is likely to be a combination of a girdle centred on the vertical and two poles distributed at 45° or less to the vertical. The suggested fabric is shown in Figure 3. Since the strain-rates are comparatively low, the fabric will be only poorly developed, so that in addition to the two components shown in Figure 3 there will also be a proportion of the crystal axes which are randomly orientated. If the volume fractions of the random component, the girdle, and the two-pole component are f 1, f 2, f 3 respectively, then with the z-axis vertical, we can write the components of the dielectric tensor as

The off-diagonal components are zero, and the components ε 11 g, ε 11 t, etc., are given in Figure 1.
Solving Maxwell’s equations for plane-wave propagation along the vertical gives

since ε 22 g = ε 11 g. In a sense, the two-pole part of the fabric is the only “active” component of the fabric; only this component contributes to the observed birefringence for propagation along the vertical. An experiment which is restricted to propagation in the direction of the vertical therefore measures only the strength (volume fraction and angle of the poles with the vertical) of the two-pole component.
The fabric predicted at DYE-3 (on a horizontal projection with the vertical normal to the page) on the basis of the surface strain-rates at DYE-3. The strain is predominantly extensive longitudinally (in the direction of flow), and compressive vertically, with a slight transverse extension.

The experimentally observed value of n 2 2 – n 1 2 is 1 × 10⁻³. From Figure 1 we have

if we assume θ 0 = 10°. (In fact a value of θ 0 between 0° and 30° changes the cos θ 0 (1 + cos θ 0)/2 factor from only 1 to 0.81, and does not substantially alter our later conclusions.)
So. combining these results, we have

If we take (b—a) as the upper limit of 3.2 × 10⁻², we obtain f 3 sin2 θ 1 = 3.4 × 10⁻². With sin2 θ 1 in the range 0.5 or less (corresponding to θ 1 = 45° or less) then f 3 must be 0.07 or more, a value well in keeping with our suggestion that the fabric is only poorly developed. If (b—a) is the lower limit of 3.7 × 10⁻³, then f 3 sin2 θ 1 = 0.28. Then for sin2 θ 1 = 0.5 or f 3 = 0.56 or more. An unlikely value for a poorly developed fabric.
Thus the experimental observations can be accounted for by a fabric in which a reasonable proportion of the crystal axes have a two-pole distribution, and if the single crystal anisotropy is somewhat larger than the value at optical frequencies, but smaller than the upper limit set by the most accurate laboratory experiments. A suitable combination of values might be: 10% of the crystal axes in a two-pole distribution at 45° to the vertical, and a value of (b—a) of approximately 2 × 10⁻².
Deduced birefringence of cores of known fabrics and values of single-crystal anisotropy needed to give the observed DYE-3 birefringence

Despite the fact that there has been no fabric analysis of the core from DYE-3, we can use the fabrics observed in the “Byrd” station core (Gow and Williamson, 1976) as possible examples of fabrics from a similar region of an ice sheet. By obtaining the relative weight of each crystal-axis orientation from the fabric diagrams, the dielectric tensor can be calculated by taking a weighted average of the dielectric tensor of each orientation. The birefringence can then be computed for propagation along the vertical. In the first column of Table I we show the results of calculations of the birefringence (relative to the single-crystal anisotropy) of the fabrics from the “Byrd” core which are shown in Figure 4.1 (after Gow and Williamson, 1976) and also of the fabrics from the Ross Ice Shelf at Little America V which are shown in figure 4.2 (after Gow, 1970). In the second column of Table I we have used the experimental result from DYE-3 to calculate the (b —a) value which these fabrics require in order to account for the experimental result.
The 1 382 m fabric from “Byrd” is typical of the single-pole distribution observed below about 1 200 m at “Byrd”. This fabric cannot account for the observed experimental result at DYE-3, since it would require a value of (b—a) larger than the allowable upper limit. However the fabrics from 300, 400, and 638 m all predict a value of (b—a) less than the allowed upper limit. It would therefore appear possible to explain the experimental result at DYE-3, which is based on observations of reflections from within the top 1 000 m of the ice sheet, on the basis of the fabrics observed at “Byrd” station in this same upper region of the ice sheet. This result also confirms our previous deduction that the single-crystal anisotropy may be close to, but need not be greater than, the upper limit set by the laboratory measurements.
As an example of the possible range of values of birefringence which can be produced by a change in the fabric type, the value obtained for the 140 m core from the Ross Ice Shelf is approximately four to five times greater than the average of the 300, 400, and 638 m cores from “Byrd” station. So in a region where the fabrics are well developed (the fabric in the 140 m Ross Ice Shelf core is noticeably better developed than the fabrics from the other sections of the core) the birefringence may be as much as five times greater than that observed at DYE-3; this prediction has been confirmed in a preliminary analysis of results of polarization measurements by A. Woodruff of British Antarctic Survey (private communication).
Top mid middle rows: Fabrics at selected depths from the deep drill hole at “Byrd” station (after Gow and Williamson, 1976). Bottom row: Fabrics at selected depths from the Ross Ice Shelf at Little America V (after Gow, 1970).

4. Conclusion
The conjectured anisotropy of the electrical properties of the ice crystal, together with an ordering of the ice-crystal orientations, is one possible explanation of the observed radio-frequency birefringence of polar ice sheets. On the basis of both the observed and the postulated ice fabrics, it is possible to explain the observed level of birefringence if the single-crystal anisotropy is slightly less than the upper limit of 1% (or (b—a) = 3.2 × 10⁻²) set by the accuracy of the experiments which have failed to detect an anisotropy.
In as much as the ice in a glacier is in a mechanically strained condition, it is possible that the observed birefringence might result from a change in the electrical properties of ice produced by the strain. The measurements of Johari and Charette (1975) show that, within an accuracy of 0.2%, the electrical properties of their samples were not changed by a uniaxial or hydrostatic stress of up to 100 bar.
In addition on the basis of an analysis of their results, Mae and Higashi (1973) conclude that the effect of a mechanical strain on the electrical properties of ice is very small, and would seem to be incapable of serving as an explanation of the birefringence.
Hargreaves (1977) mentions the possibility of explaining the birefringence by the existence of layering in the ice sheet. Since the observations of the birefringence are from reflections normal to the approximately parallel layers, so that the direction of propagation is approximately along the optic axis of the layered medium, this again would seem to be an unlikely explanation of the birefringence.
Air bubbles that are trapped in polar ice by the sealing off of interconnecting pores in the compressed snow, even if tubular or otherwise distorted, are not usually regularly orientated, and so the dielectric constant of the ice/air mixture will be isotropic. However Gow (1070) observed a parallel arrangement of elongated bubbles in some of the ice cores from the Ross ice Shelf at Little America V, although the ice cores from “Byrd” station did not appear to show a similar effect. It is possible that, as a result of the distortion produced by the flow of the ice, the enclosed bubbles may be stretched in the direction of flow, and the dielectric constant of the mixture will then be anisotropic. We can investigate this anisotropy by using a modified version of the treatment of the dielectric constant of heterogeneous media of Section 2 of this paper.
The heterogeneous dielectric is made up of two isotropic components, a dilute dispersed component of volume fraction ν 1, dielectric constant ε 1, and the majority component of dielectric constant ε 2. From a modified Equation (2), together with Equation (1) and the appropriately modified definition of α (j), we can write the dielectric constant of the medium as:

If the bubble inclusions are approximated by ellipsoids with the α-axes of all the ellipsoids parallel to the external field, then α is given by

where A α is the depolarization factor of the ellipsoid in the direction of the α-axis (Polder and van Santen, 1946).
If the electric field is parallel to the direction of stretching of the bubbles, and the proportional stretching δ along the α-axis is small, then it can be shown that we can approximate A
α
by  . On the other hand, if the electric field is perpendicular to the direction of stretching, then we may approximate A
α
by
 . Applying these two values of A
α
to Equations (8) and (9), and with ε
1 = 1 for air and ε
2 = 3.2 for ice, we find that the difference between the dielectric constants, ε
1
′ and ε
2
′, in these two cases is:

From Langway (1967) the volume fraction occupied by the air bubbles at 300 m depth in the Greenland ice sheet is about 0.4%. The field observations give a value of the anisotropy of at least 1 × 10⁻³ (assuming the most favourable orientation of the optic axis). To explain the experimental observations as anisotropy produced by stretched bubbles would require a stretching of at least 25% at 300 m depth (which is far greater than that observed in the ice cores) and a still greater distortion at greater depths, whereas in fact the bubbles are observed to become not only smaller but also more uniformly spherical with depth (Langway, 1967). We can conclude that the observed birefringence is not caused by the distortion of the air bubbles in polar ice.
It is not only the electrical properties of polar ice which are apparently anisotropic Laboratory measurements of the elastic properties of the ice crystal (e.g. Dantl, 1968) show that an anisotropy also exists in those properties, and Bentley (1971) shows that variations of travel times of seismic waves in West Antarctica can only be explained by an anisotropic model of the ice sheet. Bennet (1972) in laboratory measurements on ice cores from several parts of the Antarctic and Greenland ice sheets also observes variations of velocity with wave type and direction of propagation which indicate that the elastic properties of polar ice are anisotropic. Bennet furthermore provides a treatment for evaluating the velocity of seismic waves in polycrystalline ice and is able to show that his observations can be explained on the basis of the observed fabrics of his samples. That there is a relationship between the ice fabric and the anisotropy of the ice sheet has been further demonstrated by Bentley’s (1972) results of P-wave velocity measurements in the deep drill hole at “Byrd” station. Using Bennet’s treatment for the average velocity, together with the observed fabrics of Gow and Williamson (1976), Bentley shows that the changes in the velocity down the drill hole can all be explained by the changes in ice fabric which occur with depth (other than those produced by density changes in the upper part of the ice sheet). We have here fairly conclusive evidence that the anisotropy of one of the physical properties of the ice sheet is related to the ice fabric and the anisotropy of the single crystal.
If one accepts that the radio-frequency birefringence of the ice sheet is similarly related to the ice fabric and to the crystal electrical anisotropy, then measurements of birefringence open up the possibility of determining the ice fabric by radio-echo sounding techniques. Measurements in different regions of the ice sheet, along a flow line for instance, might be used to observe the changes in the ice fabric from place to place on the ice sheet. On the other hand, measurements where fabrics at depth are known might be used to evaluate the anisotropy of the crystal dielectric constant. However, if the anisotropy is of the order suggested by this present work, then through a slight improvement in experimental accuracy it should become possible to measure this anisotropy in the laboratory.
Appendix
Electromagnetic propagation in a birefringent medium
The electrical properties of the medium are represented by the real symmetric tensor ε. The Maxwell’s equations of interest for this medium are:

If we try a plane-wave solution E = E0 exp i(k·r – ωt) these give:

By choosing the z-axis as the direction of propagation, and by further defining the refractive index n by n = |k|/(ω 2/c 2), then Equation (A. 1) becomes

To obtain non-trivial solutions to these three simultaneous homogeneous equations we must set the determinant of the matrix of coefficients equal to zero, which results in the quadratic in n 2:

A different propagation direction means that the orientation of the z-axis is redefined. By transforming ε to these new axes, and using the new ε ij components in Equation (A.3), we can find the values of the refractive index for this direction of propagation. As mentioned in Section 2 of this paper, we would normally evaluate ε in the most convenient coordinates and then transform to the appropriate coordinates for a given direction of propagation. The difference between the two refractive indices which are obtained from Equation (A.3) then gives the level of birefringence for that direction of propagation.
Discussion
W. F. BUDD: DO you think the radio-frequency technique can be used to determine the symmetry of the crystal orientation fabrics in polar ice sheets?
N. D. HARGREAVES: By presenting the discussion in terms of the different components of the fabric which I have mentioned I am merely picking out the different types of symmetry which are present in the fabrics. However, as I have pointed out, an experiment which is restricted to propagation in a vertical direction only provides information on the symmetry of the fabric about the vertical. To obtain further information on the symmetry it would be necessary to perform perhaps a wide-angle reflection experiment.
C. R. BENTLEY: Trepov and Bogorodskiy have measured a similar birefringence in ice near Molodezhnaya, finding also a velocity anisotropy of about 0.1%. They also believe that the only satisfactory explanation is anisotropy of ε in single-crystal ice.



