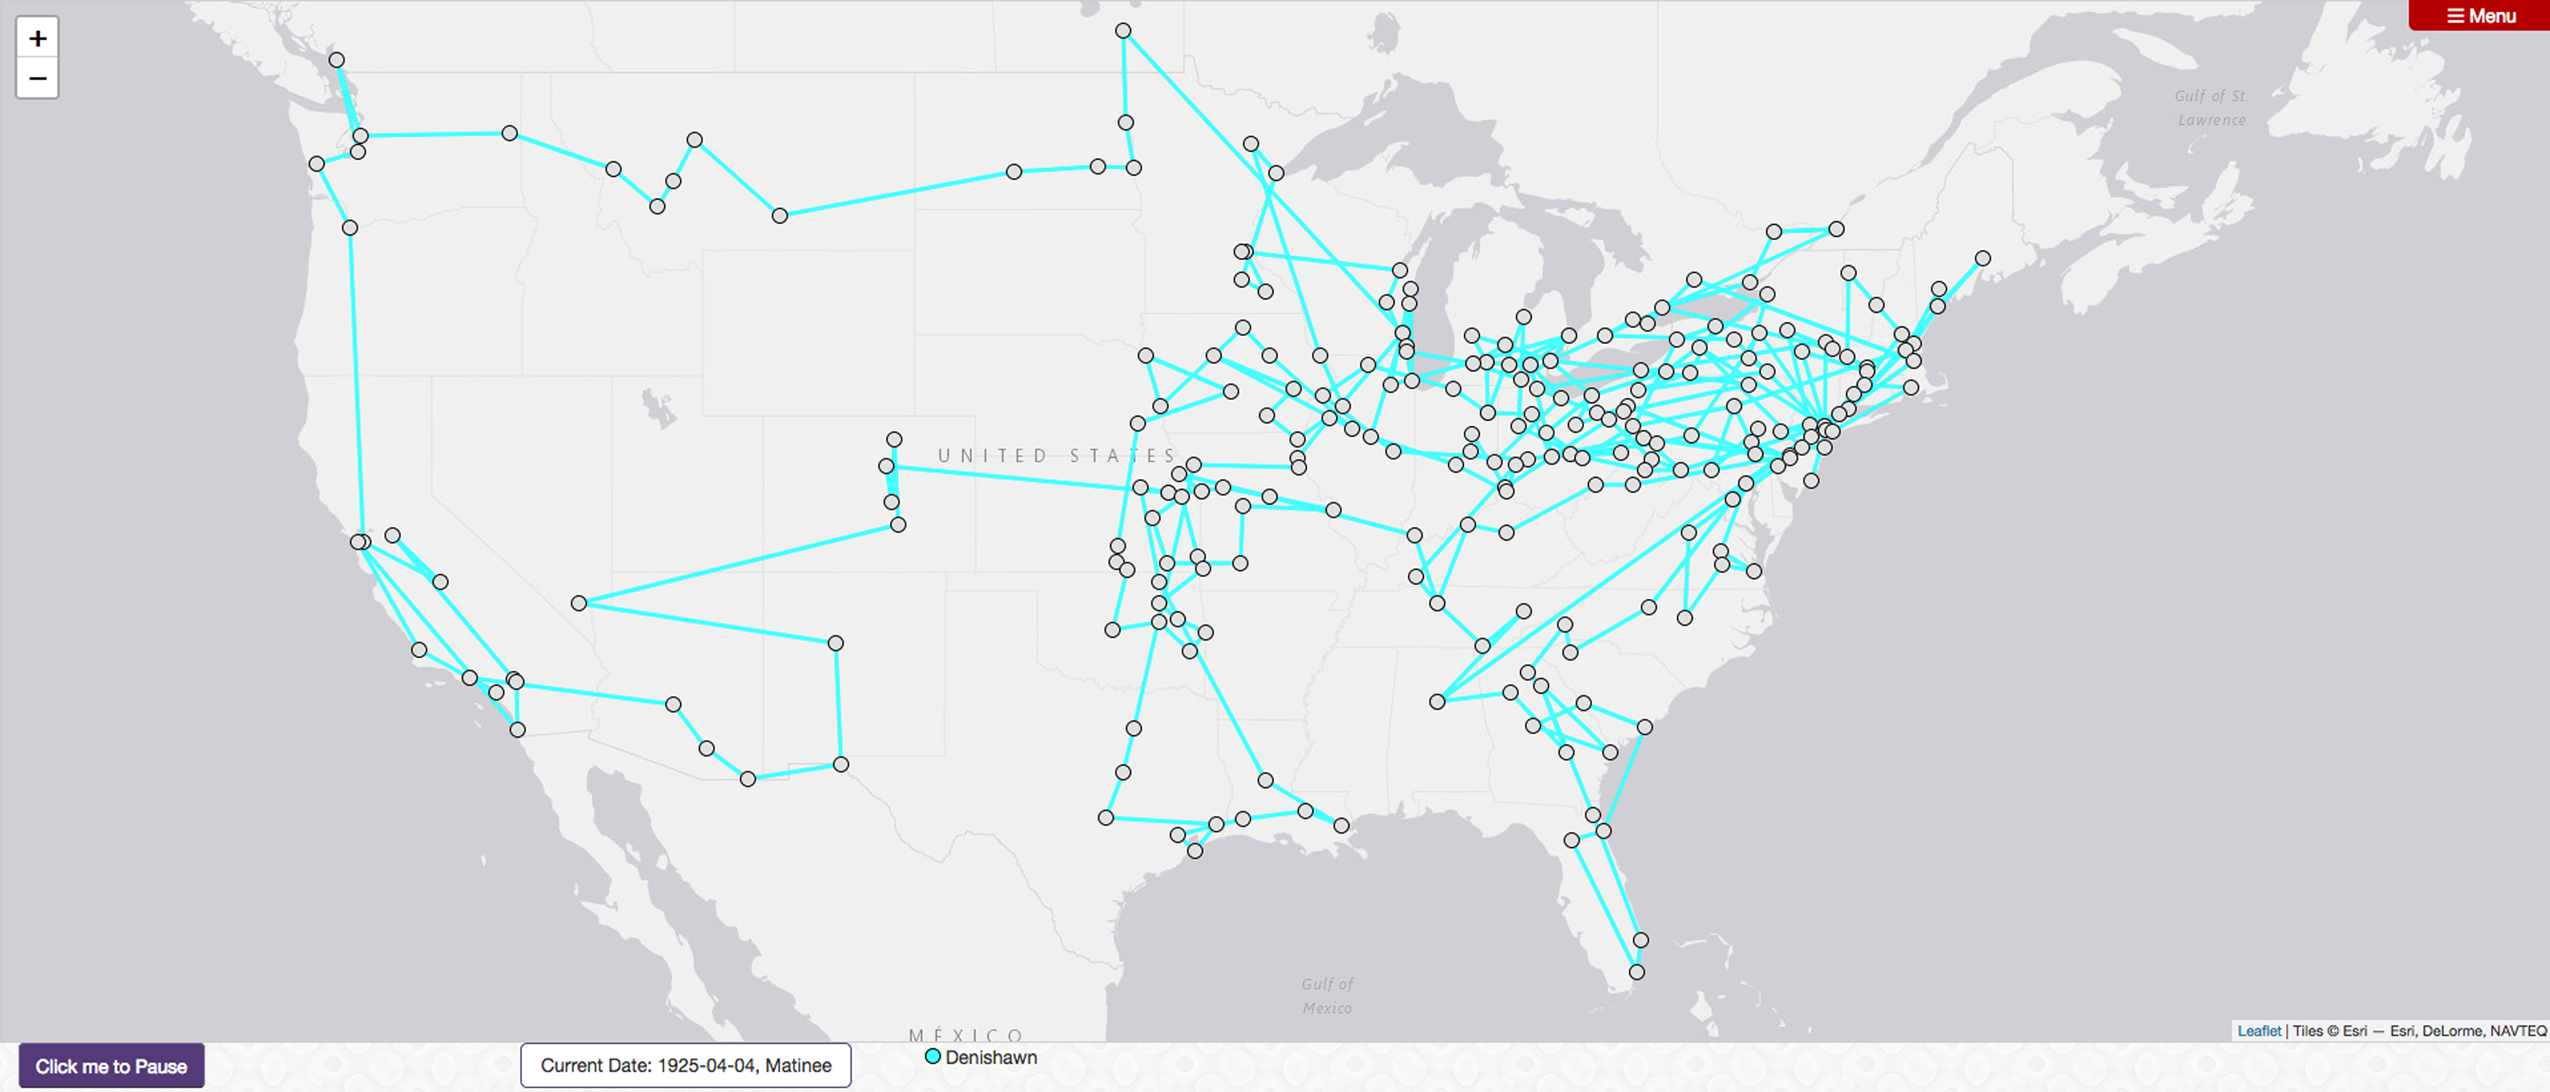


On my computer screen is a map of the United States. I can zoom out for a broader (though still two-dimensional) view of the world, or zoom in to examine individual states or cities, but the default map centers the continental United States. Below the map are fields to select date parameters and the names of dance troupes such as Les Ballets Russes and Denishawn, among others. I set start and end dates, select Denishawn, and click “Play during the specified time.” An aqua-colored line begins to snake across the screen, and white bubbles pop up as the line shifts and redirects, bouncing from location to location on the map. I pause the animation and click on one of these bubbles. A new window opens displaying information about that data point: the troupe name and what they performed on which dates and in which location. I close the pop-up window and resume the animation.
This is the animated route view of Mapping Touring, an in-progress digital humanities project that uses concert dance programs held in library special collections to document and track the appearances of concert dancers, choreographers, and dance troupes during the first half of the twentieth century as they toured domestically and internationally. Of particular concern for the project is representing the dates of performances, cities and venues, and repertory performed for the purposes of spatial and comparative analysis. Although the project does cull from existing itineraries complied by other scholars, the primary historical sources from which Mapping Touring is built have largely not been digitized, and much of the labor involved thus includes traveling to archives and special collections, photographing documents, and extracting key performance data for inclusion in a database. To date, this project has employed thirteen student researchers in this pursuit,Footnote 1 and pulled materials from nine physical and online special collections.Footnote 2 Although the intentions behind Mapping Touring are global, there is at present a strong U.S. bias in the project, due to my own familiarity and access to archival collections.
This article serves to introduce the project and lay out some of the larger questions around engaging digital methodologies, namely digital mapping and spatial analysis, in the field of dance studies. Mapping Touring is based on preexisting physical collections, and thus I see this work as part of the archival turn in dance. As indicated in the article title, Mapping Touring remediates artifacts held in archives and reimagines them for online delivery and research, in particular through the forms of the database and map.Footnote 3 In addition to being informed by ongoing work in the digital humanities, my conceptualization of Mapping Touring grew out of an interest in the culturally informed revisionist histories produced by dance scholars in the 1990s and 2000s. As I will discuss later, Edward Said's (Reference Said1983) comments on how theory travels in academic contexts have also been particularly influential in my understanding of how dances travel, and with them, theories of embodiment embedded in dance repertory. Mapping Touring makes visible the possible avenues and trajectories along which theories of embodiment may have been disseminated through the phenomenon of dance touring. Though Mapping Touring cannot represent the movement content of the dance works touring troupes performed, by mapping the extent of dancers’ travels, it does bring their global circulation into greater relief.
For the purposes of illustration, I focus throughout the article on the joint efforts of Ruth St. Denis and Ted Shawn to offer possibilities for this type of computationally enabled analysis. I analyze Denishawn's touring from 1923 to 1928, which encompasses their so-called Far East tour, as well as the U.S. tours leading up to and immediately following their time abroad. St. Denis had a career as a soloist that included international appearances before she met and joined forces with Shawn, who auditioned to be her partner for ballroom dance numbers in 1914. They married soon thereafter, established a dance school in 1915, and toured nationally and internationally with their pupils as Ruth St. Denis, Ted Shawn, and their Denishawn Dancers until 1931 when St. Denis and Shawn separated. Shawn went on to establish the all-male company Ted Shawn and His Men Dancers, which toured just as extensively, and St. Denis resumed her career as a soloist and dance educator. Their tours from 1923 to 1928 collectively represent a case study for my broader argument that data visualizations can assist in accounting for the importance of dancers’ global circulation within the early years of aesthetic modernism. This period was marked by the pervasive use of primitivism and exoticism as aesthetic strategies in representations on stage, even as these aesthetic strategies also served to articulate connections across cultural and movement diasporas (see Burt Reference Burt1998; Kraut Reference Kraut2003; Shay and Sellars-Young Reference Shay and Sellars-Young2003). As Susan Manning argues in Modern Dance, Negro Dance: Race in Motion, although dance scholars “have illuminated cross-cultural influences,” the field still lacks “a comprehensive intercultural account of American dance” (Reference Manning2004, xxiv). One intention behind Mapping Touring is to support an understanding of early modernism in the dance field as intercultural and transnational, or in the language I will use in this article, global at its core, by drawing attention to the collective phenomenon of travel as a significant mode whereby performers both gather and disseminate cultural information. Before offering a full description of Mapping Touring and the choices I have made regarding how to digitally represent dance in this ongoing project, I wish to attend to the question of remediating dance's archives, which is a central consideration for the project overall.
Remediating Dance Archives
Scholars have already noted how archives shape what kinds of histories can be written (Mosley and Wheatley Reference Mosley and Wheatley2008) and how the history of archival practices is one of privileging the artifacts of elites (Haskins Reference Haskins2007). Dance archives especially tend to focus on celebrity choreographers and star performers, reinforcing their status through their archivization while, in effect, delegitimizing those practices and people that are absent from the archive. Dance studies, for example, has grappled very little with burlesque and erotic dance, or even folk dance troupes that travel the same touring routes as concert dance performers. Feminist historian Kathryn M. Hunter cautions that when creating and using digital archives, researchers must take care to “not allow digital records to become an episteme instead of a tool” (Reference Hunter2017, 210). Built upon the cultural biases and personal preferences woven into physical archives, digital archives, which both narrowly curate those contents and make them more broadly accessible, risk reifying rather than ameliorating absences in the archive (see Bench and Elswit Reference Bench and Elswit2016).
Further, Hunter observes quoting Patrick Leary, in an era of mass digitization, “un-digitised sources are becoming an ‘offline penumbra’ [and] ‘unvisited shadowland’” because these artifacts are not electronically searchable (Reference Hunter2017, 205). Remediating concert dance archives for online access similarly confronts the reality that, in an era of tightening budgets in the “traditional” humanities and the expansion of budgets for digital projects, accompanied by a rising generation of digitally literate scholars, those artifacts with greater online availability will likely receive greater scholarly attention. Still, dance scholars are unlikely to feel the field-altering impacts of digitization that literary and political historians must attend to since, if the physical objects in dance archives are digitized at all, it is generally as a part of a small sample of a special collection's holdings rather than as a corpus of work. For example, the Jacob's Pillow Dance Interactive website (https://danceinteractive.jacobspillow.org/) showcases an array of audiovisual holdings at the renowned dance-presenting institution through a continuously growing collection of one- to two-minute video clips, and the New York Public Library Digital Collections (https://digitalcollections.nypl.org/) includes a number of digitized manuscripts and video from the Jerome Robbins Dance Division, but no single collection has been digitized in its entirety. In both cases, the online collections illustrate the extent of the physical collections rather than serving as substitutes for them.
Even as special collections have expanded to include film and video alongside printed documents and artifacts, the structure of archives and their media preferences disadvantage concert dance, not to mention social dance and other practices. Dance artists and scholars have therefore articulated different relationships to the archive, resulting in a few prominent trends in dance's archival turn. An archival sensibility in dance opens onto questions of preserving dances and dance practices through embodied archives and media technologies, and the transformations that result in reenacting or otherwise re-presenting dance archives. Included among these trends, which I will not fully elaborate here, are the ways contemporary artists plumb the gestural and movement archives of modern dance repertory or their own choreographic careers in projects of reenactment and reperformance (Lepecki Reference Lepecki2010; Elswit Reference Elswit2014; Franko Reference Franko2017), as well as the use of social media platforms as vernacular archives through which documentations of past and present dances circulate (Bench Reference Bench and Bleeker2016).
Another trend in dance's archival turn that is closer to the terrain in which Mapping Touring operates is the creation of so-called artist-driven archives, for which dance artists direct or deeply participate in building digital archives around their bodies of creative work (Whatley Reference Whatley2013; Esling Reference Esling2013; Candelario 2018). Dance researcher Sarah Whatley describes creating an online, “born-digital” archive around UK choreographer Siobhan Davies's work. She notes that prior to creating an online platform showcasing Davies's choreography, it was “hard to find, difficult to view and … once no longer performed live, had largely disappeared from public view” (Whatley Reference Whatley2013, 85). Siobhan Davies RePlay (2009) is “born digital” in the sense that Whatley's team did not digitize an existing physical collection and make some or all of its contents accessible online. Instead, they worked with Davies and her company members and staff to pull together an archive that was online and open-access from its inception. As Graban, Ramsey-Tobienne, and Myers argue, archives and those who build them are part of much broader disciplinary and cultural conversations regarding “access, proprietary rights, the boundaries of technology, and the conflicts between personal and communal interest” (Reference Graban, Ramsey-Tobienne, Myers, Ridolfo and Hart-Davidson2015, 235). Whatley and her team discovered some of these challenges while building Siobhan Davies RePlay, including unexpected questions of copyright and intellectual property, “ownership” inside of collaborative artistic processes, and the sense that other choreographers felt online access to Davies's work accorded her a special legitimacy not granted to them (2013, 90–91, 93).
Building an online archive includes the additional labor of verifying the accuracy of automated processes, such as geographical coordinate assignments,Footnote 4 as well as maintaining the site, since digital platforms change with such frequency that websites and digital tools rapidly become obsolete (Chun Reference Chun2016; Bench Reference Bench, Giersdorf and Wong2019). As Natalia Esling has observed in evaluating online dance archives, digital environments are “impermanent but accessible, transient but productive” (Reference Esling2013, 32). I agree with Esling's pairing of the impermanent and transient with the accessible and productive, since even a short-lived online archive can reach a broad audience who may not have the resources to travel to a physical collection, if they are even aware of it. However, just as physical archives have not been well-equipped to address the medium-specificity of dance, online archives necessitate a further reconsideration of the archive vis à vis dance practices, since digital archives favor proliferation, circulation, and transformation over long-term preservation. Indeed, preserving digital objects in a meaningful way requires their dynamic proliferation, circulation, and transformation rather than conservation as an artifact. A good deal of hidden labor goes into creating and maintaining online archives, including protecting against data loss, structuring data for reuse, and ensuring databases and websites remain online and available. Just as archivists catalogue and organize their physical collections to make their contents available to researchers, so too do those who build or remediate archives for online access engage in processes of “documentation and encoding, long thought to be the unattractive work of service providers” (Graban, Ramsey-Tobienne, and Myers Reference Graban, Ramsey-Tobienne, Myers, Ridolfo and Hart-Davidson2015, 236; paraphrasing Buehl, Chute, and Fields Reference Buehl, Tamar and Anne2012). There is value in this work. Dance scholars in particular understand that interpretation is already embedded in the “raw stuff” of movement description, and in digital archives, such interpretation is also embedded in choices of how to describe, present, and arrange digital representations of physical objects or the data extracted from them.
Mapping Touring represents yet another approach to dance archives, namely in the re-presentation or remediation of the contents of material artifacts documenting performance events. What tends to be archived in physical collections is part of what dance scholar Susan Leigh Foster calls a dance's frame: “the way the dance sets itself apart as a unique event” (Reference Foster1986, 59). For Foster, this framing includes such elements as announcements in newspapers, posters advertising the event, invitations, descriptions and graphical depictions in these announcements, as well as the location and type of performance venue, cost of admission, and the information presented in the (printed) program.Footnote 5 These cues help to orient viewers and establish what may be expected of them. What strikes me, however, is how many of the framing devices Foster identifies document the event before it happens. More than recordings of dances, these “ephemera”—posters, advertisements, newspaper criticism, photographs—index (Giannachi Reference Giannachi2016, 27) a performance that is not, itself, in the archive.
For scholars who spend a lot of time in archives, there is nothing especially profound about this observation. Historians work with archived remains, as well as oral histories, informal record keeping, restaged repertory, embodied memory, and other avenues of access to construct historical understandings of dances, dancers, dance makers, and dance practices. What is perhaps of greater interest is that much of what Foster (Reference Foster1986) includes in a dance's framing could also be described as its metadata. Metadata describe the content and context of other data, in this case a performance event. A performance's metadata could include the date, location, and venue, the names of performers, the dances performed and their creators, among other pieces of information that can usually be found in a concert dance performance program (sometimes called a playbill), which generally follows a standardized scheme. For this reason, Mapping Touring focuses on the collection of performance metadata from concert programs, supplemented by newspaper advertisements and reviews. This information is stored in a database that powers a series of customized geographic visualizations as I will show later, or can be exported for use in other visualization platforms.
Who, What, When, Where
Collecting and organizing data from printed programs, Mapping Touring follows a basic who, what, when, where structure. In conversation with dance scholars, database managers, and the application developers on the project,Footnote 6 I identified the following categories as central to this study: troupe, people, works, program, date, time of day, location, and venue. A performance event is a unique combination of all of these. Each of these terms merits some further explanation.
Date, time of day, location, and venue are fairly straightforward. A single performance can only happen once, and identifying the date of its occurrence, whether the show was a matinee, evening, or a less conventional time, and in what venue it took place—usually a theater, but possibly a high school gymnasium, auditorium, amphitheater, or even the reading room of a railway station—helps us to point to a specific performance rather than a general time period or touring destination. At present, Mapping Touring provides the name of each performance venue as available, but describes location at the level of the city rather than the specific latitude/longitude coordinates of each venue. We rely on scholarly knowledge of theaters’ relative prestige or experimentalism, audience makeup, and localized aesthetic hierarchies. This specialized knowledge is not easily represented in such a large-scale project, but it is this very expertise that can illuminate patterns in the data and make them meaningful by providing the context of a given tour with reference to a particular artist or a particular place. For example, when Kate Elswit and I presented a conference paper collaboratively examining ballet companies’ South American tours, dance scholar Christina Rosa (Reference Rosa2017) commented that by touring the national theaters, these artists “never really left Europe.” Such observations can only be made with reference to localized knowledge and experience and cannot be replaced or represented by a data point. Describing venues by city has the drawback that the same geo-coordinates are automatically assigned to each venue, thereby erasing neighborhood-level specificity. But when theaters with different aesthetic and political agendas appear situated in the same spot on a digital map, there is the benefit of denaturalizing the spatial logics of social segregation. Such spatial reimagination through digital representation can thus provoke questions about how touring performers both inherit and construct audiences, and how performing artists reinforce or disrupt social divisions through the audiences they attract.
For the purposes of Mapping Touring, the category of “people” refers to the dancers, choreographers, musicians, composers, teachers, rehearsal directors, et al., that are affiliated with a troupe. In the process of identifying the authors of musical compositions that accompany repertory, I confronted the uncomfortable but predictable situation in which composers within the Western classical tradition are identified, but those working outside of that tradition are not. However, our database structure does not distinguish among crediting practices. As a result, where artists have identified “native Indian airs” (Ruth St. Denis), “folk tunes” (Ted Shawn), “Indian drums” (Lester Horton), or “Original Japanese music” (Anna Pavlova) as the source of their accompanying music, these sources become endowed with a subjectivity in the database that their creators were denied in the original production materials. In other words, having been identified as the composer, “native airs” becomes a person. Further research would be required to properly identify these composers.
A “troupe” can be a solo performer, a temporary configuration of performers, or a formal organization that lasts many years. Troupe is more or less synonymous with company, cast, or ensemble, but “company” expresses a formality and financial stability that early twentieth century touring performers rarely possessed, and “cast” seems too narrowly focused on the performers in a single work or a single performance. The theatrically oriented term “ensemble” comes closest in its description of a stable but fluid entity, yet it also suggests a group of a particular size. All of these terms are inadequate to describe the various possible configurations of performing soloists and groups that emerged over a half century across a range of stages, styles, sizes, and organizational models. I have selected the term “troupe” as, I hope, a more flexible idea that can capture vaudeville dance acts such as those of soloist Ruth St. Denis, who appeared alongside uncredited musicians (Srinivasan Reference Srinivasan2012, 83–84); the performer- or choreographer-centric dance groups like The Incomparable Anna Pavlova, which toured globally with dozens of dancers and a full orchestra; or Katherine Dunham and Her Dancers, Singers, and Musicians, which performed on concert stages in addition to nightclubs (see Bench and Elswit, Reference Bench and Elswitforthcoming) and Hollywood films; as well as entities such as Diaghilev's Ballets Russes, which initially drew its performers from the Imperial Russian Ballet when dancers were on their summer holidays. Troupes exist for a limited duration but can sustain an identity over long breaks. They generally change their membership over time and may even change the name under which they appear. Different troupes may even perform under the same name and with some of the same performers, as famously happened when René Blum and Colonel de Basil squabbled over the Ballet Russe de Monte Carlo after their partnership dissolved. Still, the dance troupe offers a fairly stable entity for data organization and visualization purposes and reflects the way dance scholars and students already tend to analyze concert dance, where dance companies, individual choreographers, and works in repertory are prominent considerations.
Like troupe, a “work” refers to an entity that both changes and remains coherent over time. Given the common repetition of work titles and the inheritance of repertory across dance troupes, sometimes unique works can only be identified with reference to the musical composer or composition. Particularly in ballet, a single work may be performed by many dancers and be in the repertory of many troupes simultaneously. Some works are only performed a few times; others are performed frequently over many years. Either way, Mapping Touring assumes that a work sustains a core identity across iterations, even if it changes quite radically over the course of its lifetime. For example, Gay Morris observes that before George Balanchine's 1946 ballet The Four Temperaments came to epitomize his neoclassical style, it was imbued, especially through costuming and design, with surrealist elements (Reference Morris2006, 53–54). Clare Croft notes also that an early version of “Sinner Man” from Alvin Ailey's signature 1960 work Revelations was accompanied by what she describes as a “banjo twang” rather than the “driving, electric sound” with which contemporary audiences are familiar (2015, 30). Changes to music and costuming can have profound implications for how dances are perceived and understood. One might even go so far as to ask whether such early versions of now-canonical works are even the same. Yet, performing arts scholars are habituated to such indeterminacy. Even when changes are not as pronounced as these two examples, performers will bring different physical histories and interpretations to a role, different venues will impact the arrangement of sets and props, and changes in casting or real-world events can significantly alter how a work reads to an audience.
For Mapping Touring, I consider a work as “an assemblage,” which as Deleuzian social theorist Manuel DeLanda argues, “can have components working to stabilize its identity as well as components forcing it to change …” (Reference DeLanda2006, 12). While dance scholars might justifiably argue that a work's core identity resides in its sequencing of movement imbued with a particular choreographer's style, in Mapping Touring, a work is a choreographic object predominantly identified by its title, its choreographer, and the composer of the music. Although there are some famous collaborations between choreographers and set designers—Martha Graham and Isamu Noguchi, Merce Cunningham and Robert Rauschenberg—the frequency of changes to set, lighting, and costume design as works are restaged and reimagined over time have discouraged me from including these elements in what constitutes a work for the purposes of Mapping Touring. Again, specialist knowledge or access to visual documentation is required to tether designated works to their choreographic content and styles, as well as to understand how versions of works may substantially deviate from previous iterations.
More than other factors, it is the definition of choreographic works as such that limits the scope of Mapping Touring to concert dance in the first half of the twentieth century. This limited scope reflects the impact of postmodern compositional practices, including reconstruction and reenactment, self-citation, improvisation, choreographic collaboration, and audience participation, all of which undermine the stability of a work, which is already under pressure from accumulating changes in performers’ physical training and abilities, casting choices, and transmission through oral history and embodied memory.Footnote 7 The choreographic work and, indeed, the concept of the choreographer, are modernist ideas that have limited reach beyond a certain historical, aesthetic, and geographic context. By containing the scope of Mapping Touring, I wish to acknowledge the limits of these concepts, while at the same time trying to keep them as open as possible to reflect a wide array of stage-based dance practices and keep them in dialogue with other touring artists and performing arts practices.
The dance concerts documented in Mapping Touring commonly present multiple works in a showcase format rather than a single evening-length work. I therefore refer to works presented together as a “program.” A program may remain consistent for consecutive performances or change with each event. Typically, a touring troupe will arrange a selection of works—the repertory selected for that season—into a few different programs. For the purposes of Mapping Touring, I do not distinguish between consistent and inconsistent groupings of works; any collection of works reflected on the printed brochures, handouts, and news articles that provides the performance data constitutes a program given by a troupe and its affiliated people. These, in tandem with the date, time of day, location, and venue, describe a unique performance event.
The database structure and information organization are only parts of Mapping Touring. I am particularly interested in how digital mapping as a methodological approach offers a sense of the transnational movement of traveling dance performers in the first half of the twentieth century. In The Practice of Everyday Life, Michel de Certeau critiques the use of mapping techniques to represent spatial navigations and negotiations. He argues that a map's “synchronic or achronic” representation is reductive and insufficient because it cannot capture “the temporal articulation of places” or “the itineraries that were the condition of [the map's] possibility” (de Certeau Reference de Certeau and Rendall1984, 35, 120). One objective of Mapping Touring is to reassert touring performers’ itineraries inside of the map, to visually represent touring as something that unfolds sequentially in time across days, months, and even years. Further objectives include demonstrating how performance sites relate to each other and facilitating comparative analysis of troupe pathways and repertory performed.
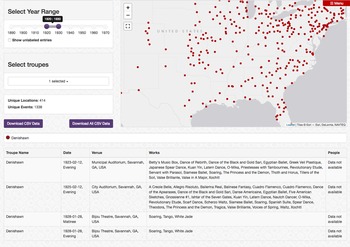
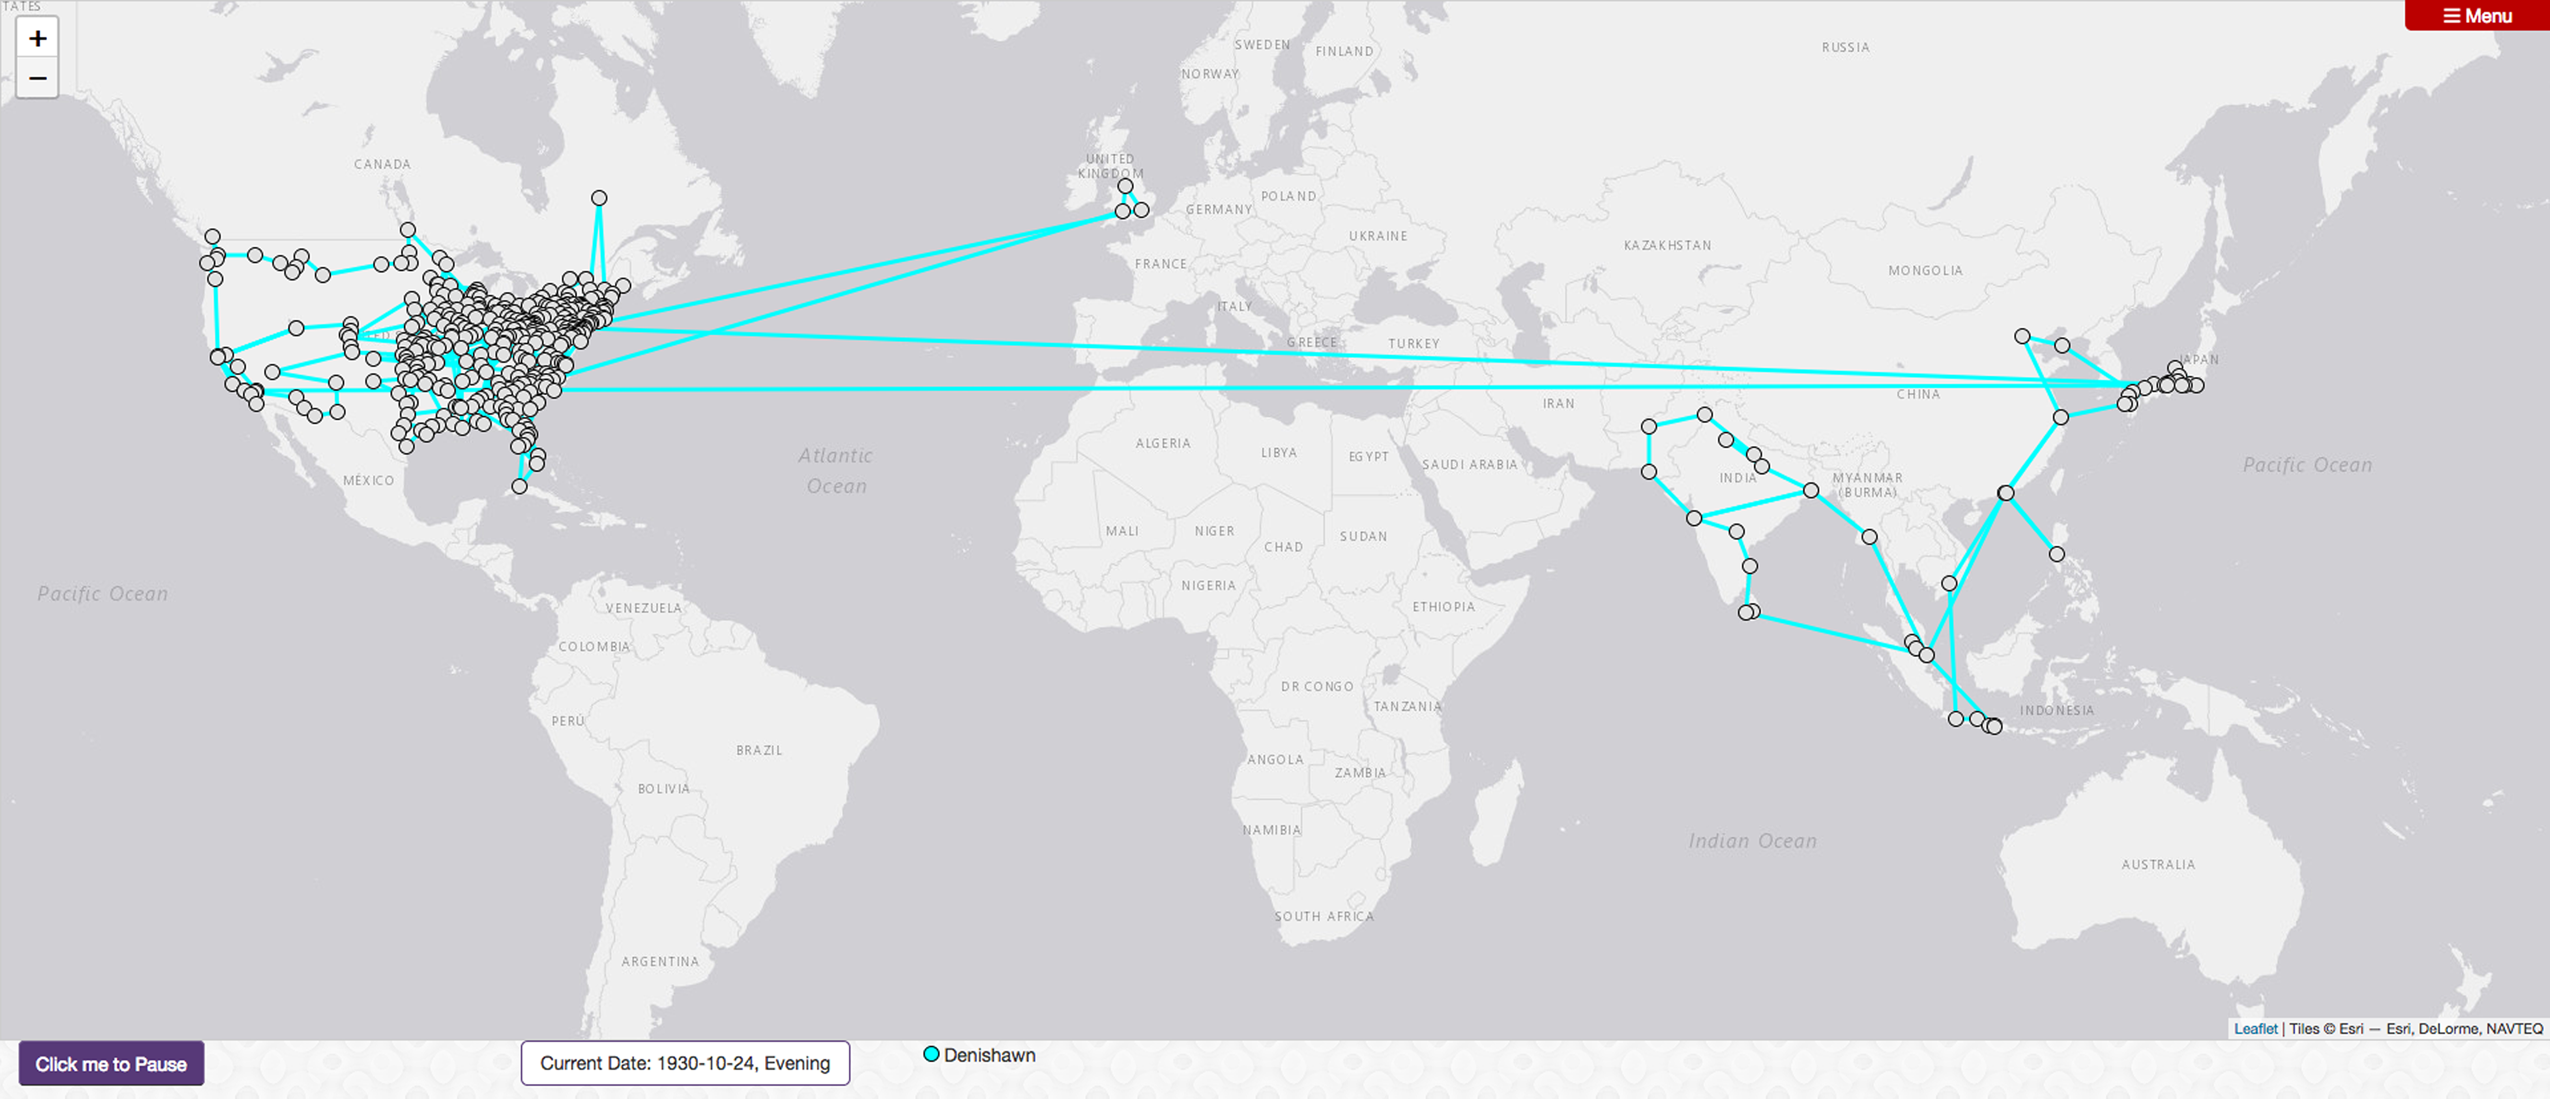
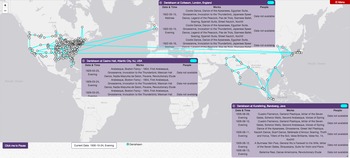
Mapping Touring includes two mapping options: an interactive but static map of the very sort de Certeau critiques, and an animated route map that maintains the element of time. Both visualization tools can display multiple dance troupes at once, and will display multiday performance runs on “click.” For example, Photo 1 is a mid-range close-up on a static map view of the Denishawn dance troupe's performance engagements 1920–30. Clicking on Savannah, Georgia, reveals the individual performances given in that city—one in 1923, one in 1925, and two in 1928—along with the repertory Denishawn performed. Photo 2, is a zoomed-out view at the conclusion of the animated route map encompassing this same timeframe, and Photo 3 shows examples of the panels that appear “on click” with further details about the performances at each location. Whereas the static map view offers a “deep time” perspective, displaying all performance engagements regardless of the tour on which they occurred, the layering of data in the route map visualization means that only information for the most recent visit to a location will be displayed. The static and route maps thus work together to illuminate different aspects of a troupe's touring and repertory.
Screenshot of the Mapping Touring Static Map visualization option with the touring data for Denishawn's performance engagements from 1920 to 1930. Only Denishawn is shown here, but the platform can plot data for multiple troupes simultaneously. When a user clicks on a city, a window will display the location, date, and repertory information available. This image shows the performances Denishawn gave in Savannah, Georgia, within the specified timeframe. People assigned to specific performances are not available at this time. Source: Mapping Touring data visualized by the author with a visualization tool designed by Chris Britt. https://mappingtouring.osu.edu/visualization/map.

Screenshots of the Mapping Touring Route Map visualization option with the touring data for Denishawn's performance engagements from 1920 to 1930. Only Denishawn is shown here, but the platform can plot data for multiple troupes simultaneously. As shown in Photo 3, when a user clicks on a city, a window will display the location, date, and repertory information available. People assigned to specific performances are not available at this time. Source: Mapping Touring data visualized by the author with a visualization tool designed by Chris Britt. https://mappingtouring.osu.edu/visualization/route.

Screenshots of the Mapping Touring Route Map visualization option with the touring data for Denishawn's performance engagements from 1920 to 1930. Only Denishawn is shown here, but the platform can plot data for multiple troupes simultaneously. As shown in Photo 3, when a user clicks on a city, a window will display the location, date, and repertory information available. People assigned to specific performances are not available at this time. Source: Mapping Touring data visualized by the author with a visualization tool designed by Chris Britt. https://mappingtouring.osu.edu/visualization/route.

It is important to emphasize that while Mapping Touring does have an intellectual agenda, which I discuss next, it is not the culmination of an argument in digital form. Digital humanities projects have notoriously short life cycles, and while Mapping Touring will continue to grow in the coming years, it will never be complete in any sense. It may never even be comprehensive enough to fully manifest my underlying argument that, although globalization is a phenomenon that scholars tend to associate with the late twentieth century, a deeper examination of late nineteenth- and early twentieth-century touring reveals the multidirectional, global circulation of aesthetic information through touring artists, and their reach into small towns dotted throughout the interior of the United States, the implications of which dance scholars have yet to fully examine. Mapping Touring offers a launching point for posing new questions and investigations, or a means of supporting existing questions that can now be approached from a different angle (see Bench and Elswit Reference Bench and Elswit2016). In the next section, I elaborate my own investments in Mapping Touring as an intellectual enterprise that builds on archival research but is inspired by the ethnographic and revisionist histories that figured prominently in dance studies in the 1990s and 2000s.
Traveling Dance as Traveling Theory
Although it takes the forms of digital databases and maps, Mapping Touring is particularly inspired by dance scholars who have combined ethnographic tools with archival research to reread canonical Western concert dance history. For example, Jacqueline Shea Murphy (Reference Shea Murphy2007) has persuasively connected Martha Graham's choreographic aesthetic to the residual effects of her frequent trips to the American Southwest to watch Native dances, and Priya Srinivasan (Reference Srinivasan2012) has debunked the popular origin story of Ruth St. Denis's Orientalist dances, drawing attention to the influence of a troupe of Indian dancers performing at Coney Island and others later in St. Denis's employ. These alternative genealogies of performance, examples of historical revision spurred by Brenda Dixon Gottschild's (Reference Gottschild1996) Africanist readings of ballet choreographer George Balanchine, are tales of interdisciplinary encounter, intercultural influence, and imbalances of power that demonstrate, despite historical narratives to the contrary, that American concert dance is and always was transnational at its core. To consider this blend of influences, I turn to Edward Said's essay “Travelling Theory” in his collection The World, the Text, and the Critic (Reference Said1983).
In this text, Said considers how theoretical language, concepts, ideas, and frameworks travel from one author to another across generations and locations, and what transformations occur en route. He notes how, like any other cultural object, theories are shaped and reshaped by the intellectuals and disciplines that take them up. Although he concedes that the circulation of ideas, “whether it takes the form of acknowledged or unconscious influence, creative borrowing, or wholesale appropriation” (Said Reference Said1983, 226) sustains intellectual discourse, he is also interested in how theoretical ideas become tamed as they become codified.Footnote 8 His example is Georg Lukács's ([Reference Lukács and Livingstone1923] 1971) articulation of class consciousness and how this theory travels from Lukács's Budapest, through his student Lucien Goldmann ([Reference Goldman and Thody1955] 1964) to Paris, and is later taken up by Raymond Williams (Reference Williams1980) at Cambridge. In Said's view, it is insufficient to interpret the transformations that a theory undergoes as so many examples of productive or unproductive misreadings. It is more interesting to consider “what happens to [a theory] when, in different circumstances and for new reasons, it is used again and, in still more different circumstances again” (Said Reference Said1983, 230). For Said, theory travels primarily as a textual object. By contrast, prior to the advent of video sharing on the internet, or even the earlier influence of Hollywood dance musicals, dance's primary medium of “geographical dispersion” (Said [Reference Said1994] 2000, 451) was dancers themselves. For this reason, I consider traveling dance, and specifically traveling dancers, as a type of traveling theory.
Susan Leigh Foster has argued that as corporeal manifestations of physical techniques and disciplinary training, dancing bodies are, among other things, “bod[ies]-of-ideas” (Reference Foster and Desmond1997, 236). She follows both Marcel Mauss and Michel Foucault to argue that every culture identifies “methods of cultivating the body,” employing metaphors, imagery, verbal and written descriptions, mimetic action, and other approaches to shape bodies and their behaviors (Reference Foster and Desmond1997, 236). How, then, do these ideas—these theories of movement, comportment, and corporeality—travel with and through touring dancers? Since a large portion of the early modernist aesthetic project was representing cultural others as both exotically foreign and knowable, how does dance repertory in the first half of the twentieth century act as both a means of representing cultural others and embodying/transmitting the various theories of corporeality their movements make visible? Certainly the dilution Said describes in traveling theory pertains in the domain of dance as well, not only because codification and institutionalization (Said Reference Said1983, 239) transform movement, but, as dance scholars have demonstrated, this process of corporeal assimilation also obscures the histories and trajectories of the practices referenced in movement and gesture. Gottschild (Reference Gottschild1996), Shea Murphy (Reference Shea Murphy2007), Srinivasan (Reference Srinivasan2012), and others therefore trace aesthetic influence backward in a genealogical mode of recovery, mining the dancing “bodily archive [that] reveals the kinesthetic legacy” that dancers leave in each other's bodies (Srinivasan Reference Srinivasan2012, 72) as movement ideas circulate.
In her book Digging the Africanist Presence in American Performance: Dance and Other Contexts, Gottschild (Reference Gottschild1996) both lays out principles of movement that are key to Africanist aesthetics and demonstrates their pervasiveness in performance practices that are coded as “white.” Her most widely cited contribution in this vein is her analysis of Balanchine and “the black text in [his] Americanization of ballet” (60). Rhetoric in both dance criticism and dance history has amplified Balanchine's innovation within the ballet idiom, including decentering the dancer's vertical line and emphasizing speed and “attack,” while the legacies of these Africanist aesthetics have been “invisibilized” (78). More recently, Clare Croft (Reference Croft2015) has written on the 1962 tour of the New York City Ballet, the company Balanchine founded with Lincoln Kirstein in 1948, to the Soviet Union. The tour, Croft notes, which was part of American efforts at cultural diplomacy during the Cold War, “heightened the dancers’ sense of Russia as part of their artistic genealogy” (55). Yet Balanchine did not merely transport the Russian classical ballet (itself of French inheritance) to the United States intact. “Balanchine was exposed to … the phrasing, counting, and timing that comes from the Africanist influence in American culture” (Gottschild Reference Gottschild1996, 76). As with other American concert dance practices, Balanchine's aesthetic, which is generally understood to epitomize American ballet, is a fully transnational, intercultural amalgam of movement sources.
For Srinivasan, the white female choreographers that dominated pre- and early modern dance (as compared to the male-dominated world of ballet) embraced discourses of the artist-as-genius in ways that required the implicit and explicit erasure of the sources of their movement innovations. “When white bourgeois American women are battling against patriarchal control over labor and for political, social, constitutional, and citizenship rights, they simultaneously seize representational and discursive control by using the laboring practices of people of color for ‘cultural capital’” (Srinivasan Reference Srinivasan2012, 69). Anthea Kraut (Reference Kraut2016) has likewise shown how, compared to white male choreographers whose authorial status was unquestioned, female choreographers in the first half of the twentieth century occupied an ambivalent social position in relation to authorship. Examining some of these white female choreographers’ autobiographies and contemporaneous accounts reveals that the masculine gendering of genius forced women to claim it indirectly, attributing their dance artistry to divine inspiration. For example, Ruth St. Denis famously describes how a cigarette poster depicting the Egyptian goddess Isis propelled her into a life of dance, offering inspiration for the dances that followed. However, as Srinivasan points out, St. Denis first created a series of Indian-themed dances rather than Egyptian ones, thus challenging her own story of choreographic awakening.
Jacqueline Shea Murphy has similarly uncovered the centrality of Native American themes to American modern dance. Choreographer Ted Shawn asserted that it was the responsibility of dance artists “to study, record and translate the dance art of the Indian to present and future generations” (quoted in Shea Murphy Reference Shea Murphy2007, 111). Partaking of an early twentieth century logic, the reinterpretation of these practices for the stage legitimized them from the perspective of white performers and audience members, for whom, Shea Murphy argues, the landscape, peoples, and practices of the American Southwest “were available to viewers in a primarily visual capitalist economy” (115). Picking up on these “visual codes” (Shea Murphy Reference Shea Murphy2007, 127), Shawn sartorially referenced a mix of Native identities and cultures in his project of amplifying masculinity in dance. In contrast, Martha Graham rendered her muses of the Southwest invisible over the course of her career, until they were only a haunting presence. Largely eschewing the representational impulses of St. Denis and Shawn—her one-time teachers—Graham's early work leaned more toward aesthetic abstraction. Native resonances were embedded in rhythmic information, invented rituals, and spare and repetitive movements that evoked indigenous themes as an overall impression rather than obvious depiction (Shea Murphy Reference Shea Murphy2007, 149–53).
Collectively, these authors demonstrate that whiteness as a social position shored up the authorial status of white ballet and modern dance choreographers by legitimizing their stage-based transformations and abstractions of cultural material, while downplaying the extent to which these artists were influenced by and borrowed from people of color.Footnote 9 It is clear from these scholars that, whether dance artists actively depicted cultural others onstage or abstracted their referents through such formal elements as rhythm, pacing, spatial design, mood, line, and energy, their choreography became a means through which movement information traveled from one site to another. In a very real sense, dancers collect movement in a bodily archive (Srinivasan Reference Srinivasan2012) or repertoire (Taylor Reference Taylor2003) and disseminate these styles of moving and theories of embodiment as they tour. In turn, audience members observe, absorb, and reinterpret this movement once more. As cultural practices become fodder for aesthetic projects that both decontextualize and recontextualize them, these practices become available for broader dissemination and consumption beyond the communities that originate and sustain them (DeFrantz Reference DeFrantz, Nielson and Ybarra2012).
Mapping Touring cannot represent the nuances of such instances of cultural appropriation and influence on its own, but it can make these operations more visible by recognizing the extent to which travel and touring informed the early twentieth-century dance landscape. As Jonathan Bollen remarks in his analysis of data models for theatrical research, “The model in itself will never reveal what happens inside a performance. … [Its value] is how it can be used to reveal the connections among performances” (Reference Bollen2016, 627). That is to say, working in this way, “following the trajectories of people, companies, productions, and works through time, across space, and among performances” can illuminate aspects of the phenomenon of transmission (Bollen Reference Bollen2016, 627). With the rise of residential dance companies in the United States in the second half of the twentieth century, particularly concentrated in New York City, the histories of itinerant performing ensembles are easily forgotten. Mapping Touring brings these histories of traveling dance back into the foreground to query what travels when dance and dancers travel. My own objective with Mapping Touring is to show the geographic distribution of early twentieth-century dance artists, as well as to establish the global circulation of dancers and consequently the globalization of dance vocabularies within aesthetic modernism, and to do so at scale. However, there are many uses for the data I am collating under the auspices of Mapping Touring. In the next section, I employ location data and repertory information gathered for Ruth St. Denis, Ted Shawn, and the Denishawn Dancers (hereafter Denishawn) to demonstrate one possible avenue for analysis.
All the World's on Stage
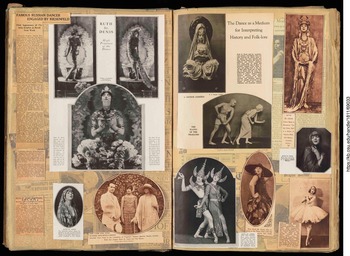
As early modern dancers, Ruth St. Denis and Ted Shawn, both with and without the Denishawn Dancers, straddled the transition from popular entertainment in vaudeville to later high art status in concert dance. Throughout their careers, St. Denis and Shawn blurred the boundaries between the “serious” and the “sensational,” and when Denishawn was at its most active, popular performance was still a key part of how audiences understood themselves in relation to a broader world. As Sherman remarks, “Denishawn programs became so popular because they gave people total theatrical experiences that exposed them to hitherto unfamiliar cultures” ([Reference Sherman1979] 2005, 2). Yet, emphasis on art and middle-class respectability as dance became part of international cultural diplomacy efforts (Prevots Reference Prevots1998; Croft Reference Croft2015) occlude the importance of vaudeville and other performance circuits in the late nineteenth and early twentieth centuries.Footnote 10Photo 4, an image from Burrill Henry Leffingwell's scrapbook documenting New York performances in the 1922–23 performance season, indicates the wide range of cultures on display in the Denishawn repertory—abutting each other in Denishawn's programs just as they do in the scrapbook. Whereas dance scholarship has emphasized close readings of Denishawn's repertory with an eye toward onstage representations of cultural others, Mapping Touring foregrounds the broad dissemination of these representations and the possible impact of Denishawn's touring programs. In this section, I rely on the itinerary of performances compiled by Christena L. Schlundt in The Professional Appearances of Ruth St. Denis and Ted Shawn: A Chronology and an Index of Dances, 1906–1932 (Reference Schlundt1962), additional performance appearance and repertory data collected and mapped as part of Mapping Touring, and information on Denishawn's travel and repertory in The Drama of Denishawn Dance by former Denishawn dancer Jane Sherman.
The majority of images in these two scrapbook pages feature Denishawn works, including “Tillers of the Soil,” “Quan Yin, Chinese Goddess,” and “The Abduction of Sita” among others. Courtesy of The Ohio State University. Jerome Lawrence and Robert E. Lee Theatre Research Institute. Scrapbook Collection. Burrill Henry Leffingwell Scrapbook Collection. Scrapbook 15. http://hdl.handle.net/1811/69033.

In addition to analyzing the cultural representations Denishawn staged, it is equally important to examine how Denishawn's touring repertory offered a shared point of cultural (il)literacy for American audiences across the nation. How might audiences have come to imagine their own global citizenship through Denishawn's repertory? Ruth St. Denis and Ted Shawn “studied indigenous dance wherever they traveled” Sherman notes, and Denishawn's repertory “extended from every Oriental [sic] tradition to the Spanish, and the American Indian, the square dance, and the Strauss waltz” ([Reference Sherman1979] 2005, 2, 1). As the dancers traveled, what gestural information did they carry with them? What did they gather from their touring locations and what did they leave behind? Mapping Touring illustrates the extent of Denishawn's touring in a way that can be parsed and analyzed in greater detail than traditional historical narrative or biography, offering greater insight into how far their representations of dancing cultures spread throughout the United States. In what follows, I analyze a series of Denishawn's tours from 1923 to 1928, encompassing two tours of the United States and Canada (1923–24 and 1924–25), an extended tour of Asia (1925–26), and two additional North American tours (1926–27 and 1927–28).Footnote 11
Photo 5 illustrates the extent of Denishawn's touring in the two years preceding their tour to Asia. This impressive coverage was facilitated by the sponsorship of the well-connected manager and impresario Daniel Mayer, and the U.S. railway network. Indeed, examining Denishawn's touring pathways in conjunction with railroad maps of the era reveals the central role the railway played in early twentieth-century dance touring, not only in terms of transportation, but also in terms of what locales the performers could reach.Footnote 12 The density of both the population and railroad access help to explain the clustering of performances in the Midwest, Great Lakes, and Northeast, and railroad connectivity can also help to make sense of otherwise surprising performances given in the sparsely populated states of Montana and North Dakota.
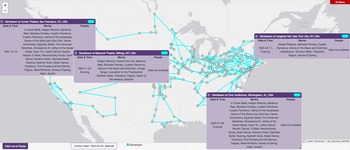
Screenshots of the Mapping Touring Route Map visualization option with the touring data for Denishawn's 1923–24 and 1924–25 tours of the United States and Canada. The panels in Photo 6 allow for comparisons among engagements in Billings, Montana, Birmingham, Alabama, San Francisco, California, and New York City, New York, during the latter tour. Source: Mapping Touring data visualized by the author with a visualization tool designed by Chris Britt. https://mappingtouring.osu.edu/visualization/route.

As seen in Photo 6, it is worth emphasizing that, despite regional variations among audiences, in their 1924–25 tour, Denishawn performed many of the same works in Billings, Montana, and Birmingham, Alabama, as in San Francisco and New York City.Footnote 13 These included not only a variety of waltzes and Americana, but also “Dance of the Black and Gold Sari” (1921), “Cuadro Flamenco” (1923), and “Balinese Fantasy” (1924)—pieces that were developed and performed without firsthand knowledge of the cultures on display. In other words, the presumably cosmopolitan audiences in large coastal cities and stereotypically unsophisticated audiences in small towns in the rural West and South saw the same idealized reflections of themselves in Denishawn's Americana, and portrayals of cultural others in their Orientalia and other exoticizing repertory. Denishawn, which was certainly not an outlier among touring performance troupes in an era known for its cultural exoticism, thus not only represented the world for their largely North American audiences, they connected their audiences to that world, and to each other.
Screenshots of the Mapping Touring Route Map visualization option with the touring data for Denishawn's 1923–24 and 1924–25 tours of the United States and Canada. The panels in Photo 6 allow for comparisons among engagements in Billings, Montana, Birmingham, Alabama, San Francisco, California, and New York City, New York, during the latter tour. Source: Mapping Touring data visualized by the author with a visualization tool designed by Chris Britt. https://mappingtouring.osu.edu/visualization/route.

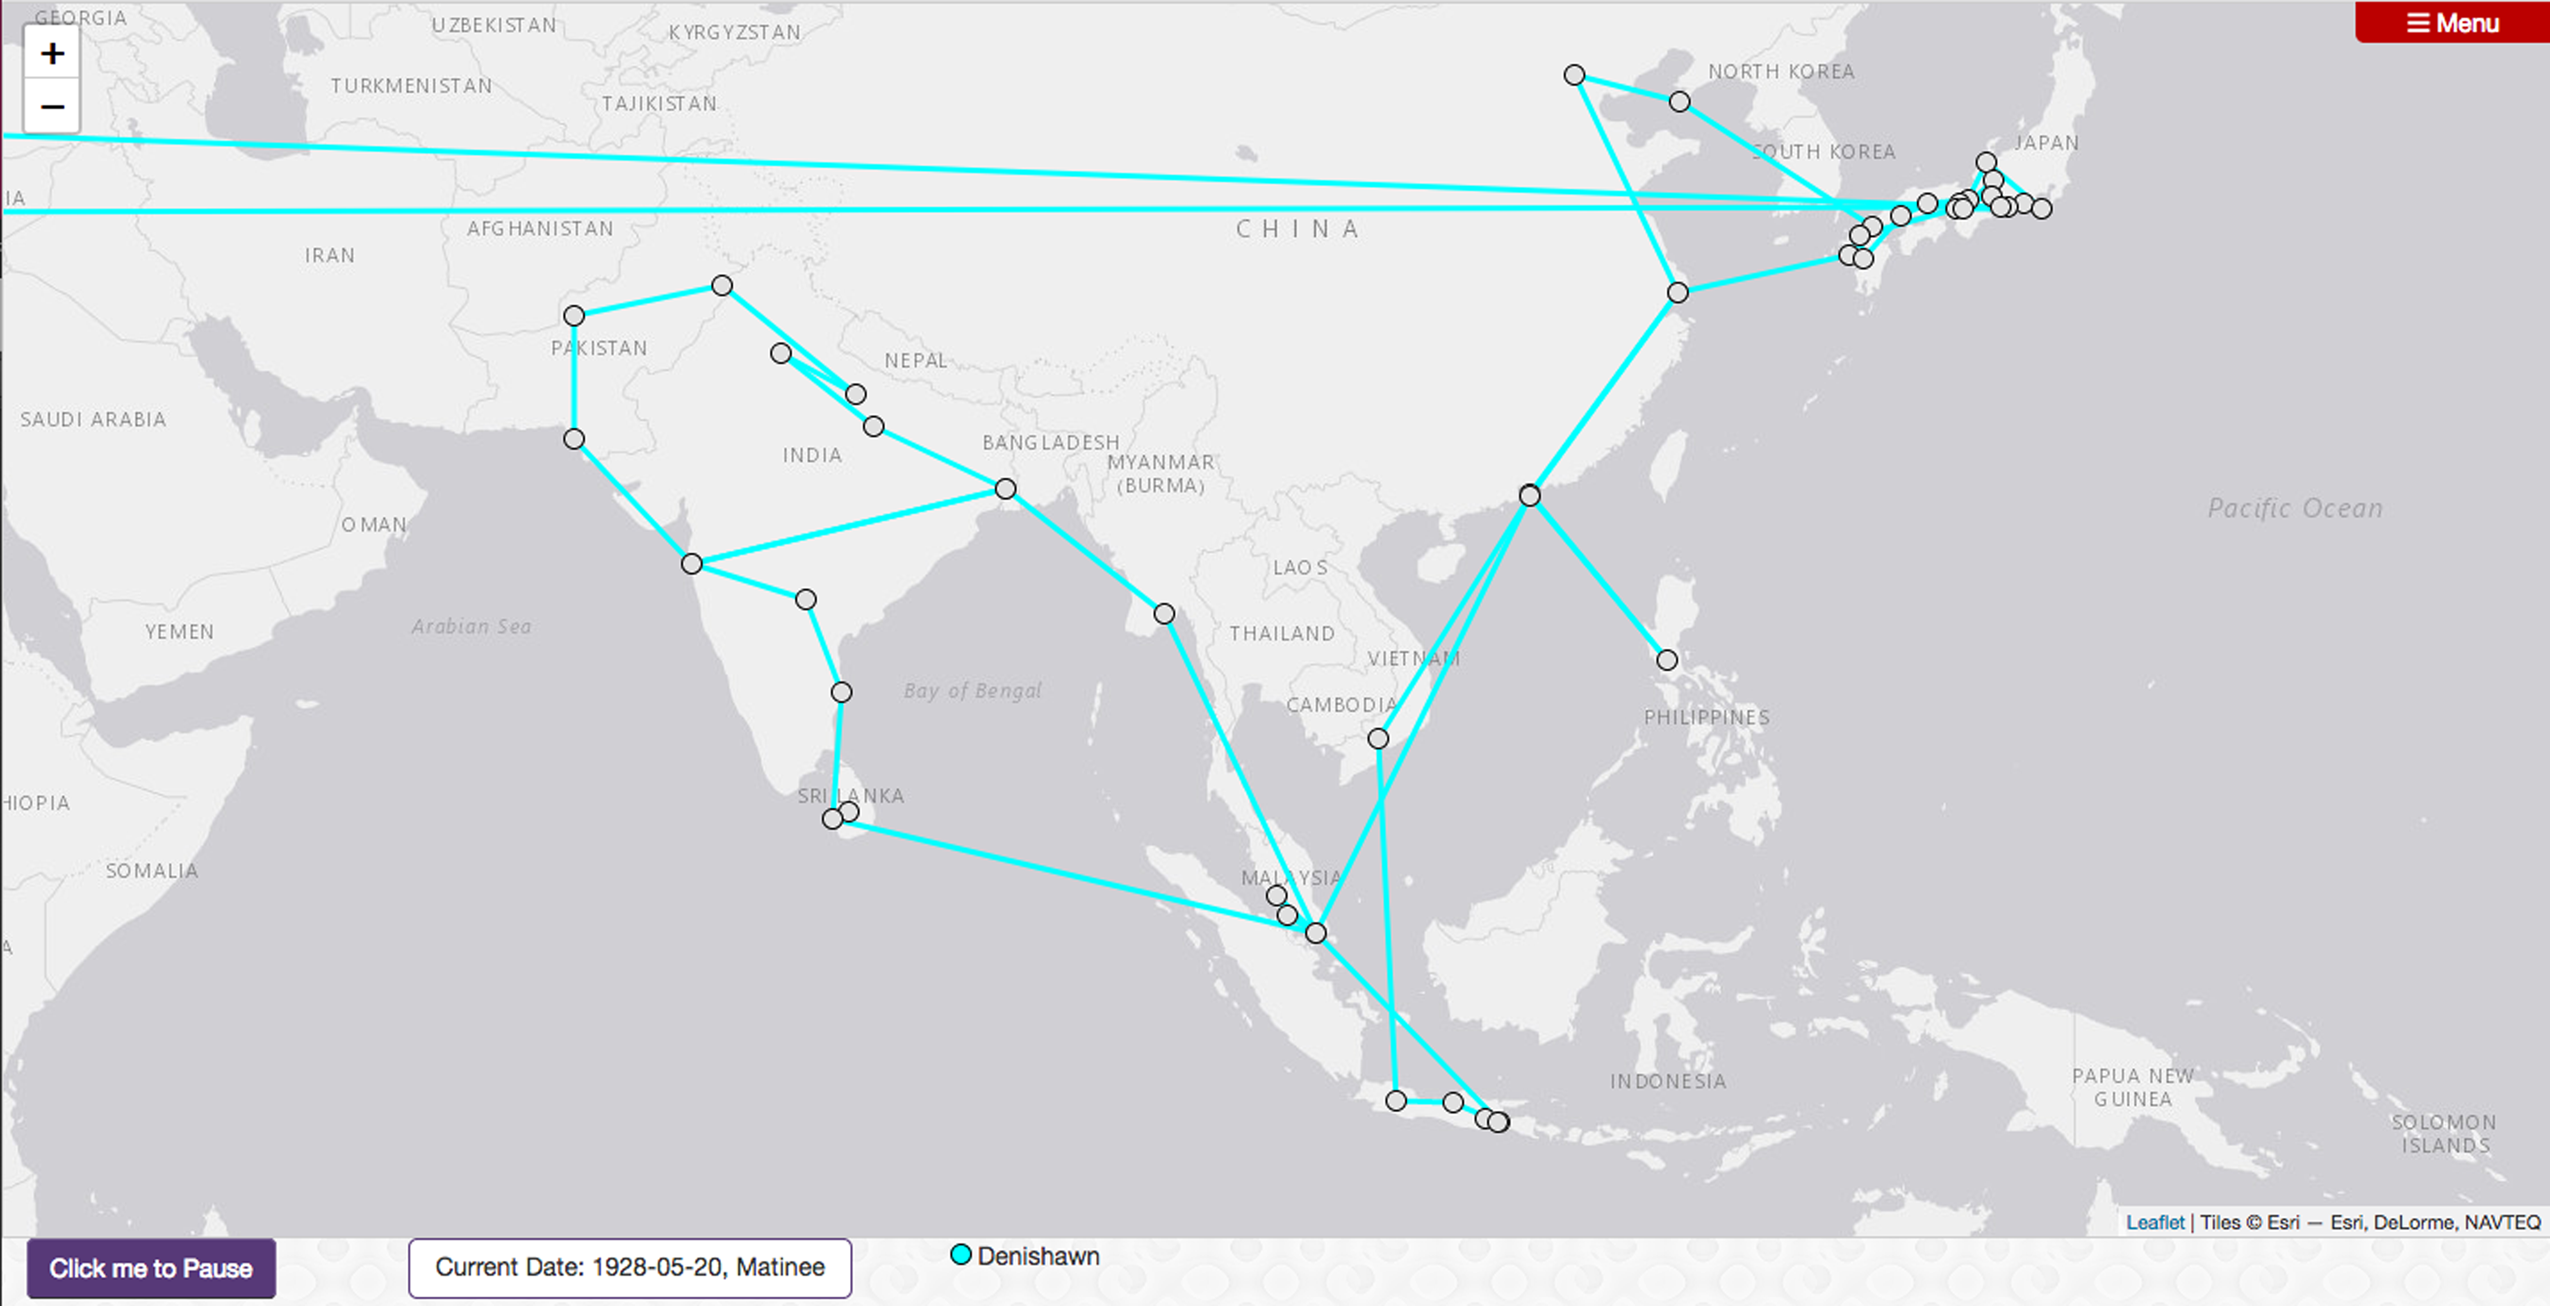
During their so-called Far East tour of 1925–26 (see Photo 7), Denishawn performed many of the same waltzes, “Spanish-style” numbers, music visualizations, and Americana, as well as the questionably sourced Balinese, Siamese, Burmese, Cambodian, and Indian pieces they had toured throughout the United States and Canada. But whereas Denishawn performed the same works across the United States regardless of the size or presumed sophistication of the audience, it is also noteworthy that although St. Denis performed many of her Indian-inspired “nautch” numbers in India, Denishawn did not perform “Spear Dance Japonesque” while in Japan or “Quan Yin, Chinese Goddess” while in China, though they did perform these works elsewhere while touring Asia. This suggests a selection process for evaluating the appropriateness of material for audiences in Asia that was different from that of their American audiences. Although portraying Asian peoples and practices through the distorting lens of Denishawn repertory was seemingly not a problem while touring the broader region, they generally opted not to represent cultures or nations that they were currently visiting.Footnote 14
Screenshot of the Mapping Touring Route Map visualization option with the touring data for Denishawn's so-called Far East tour of 1925–26. The nearly horizontal lines across the Middle East denote Denishawn's arrival from and departure to the United States—travel that would have occurred by boat via the Pacific Ocean but which is not well-represented on this map. Source: Mapping Touring data visualized by the author with a visualization tool designed by Chris Britt. https://mappingtouring.osu.edu/visualization/route.

While traveling in Asia, Denishawn continued to develop repertory that drew its inspiration from across the globe. In addition to premiering works that seem far removed from their travels, such as “A Legend of Pelée” (1925) in which, with reference to Hawaii, St. Denis impersonated an exploding volcano, they also developed many more works informed by their touring destinations. Notable examples include Shawn's statuesque solo “The Cosmic Dance of Siva” (1926), based on the Hindu god's form as Nataraja, as well as St. Denis's “A Javanese Court Dancer” (1926), inspired by female performers who dance for the Sultan. Other works debuted in the United States after they returned, including Shawn's ritualistic piece for three men “Sinhalese Devil Dance” (1926), an adaptation of the Japanese kabuki “Momiji-Gari” (1926), and St. Denis's popular “White Jade” (1926), among many others. Sherman ([Reference Sherman1979] 2005) describes the company training with local performers to learn various techniques of dance, drama, costuming, and makeup, and the way St. Denis and Shawn also adapted versions of the dances they saw for Denishawn's repertory with the help of local artists. Sherman ([Reference Sherman1979] 2005) suggests that, as a result, the repertory increased in what I might describe as anthropological realism on this tour,Footnote 15 in comparison with the theatrical impressionism that preceded their firsthand engagement with the dances they portrayed. The point here is not to debate how expert a few weeks of study would make St. Denis or Shawn when learning any dance form—even with the aid of the photographs and film with which they documented these dancesFootnote 16—but rather to emphasize that as they traveled, they collected gestures and movements along with props and costumes, which they then composed into new repertory, taught to their dancers, and further disseminated both while on tour throughout Asia as well as upon their return to the United States.
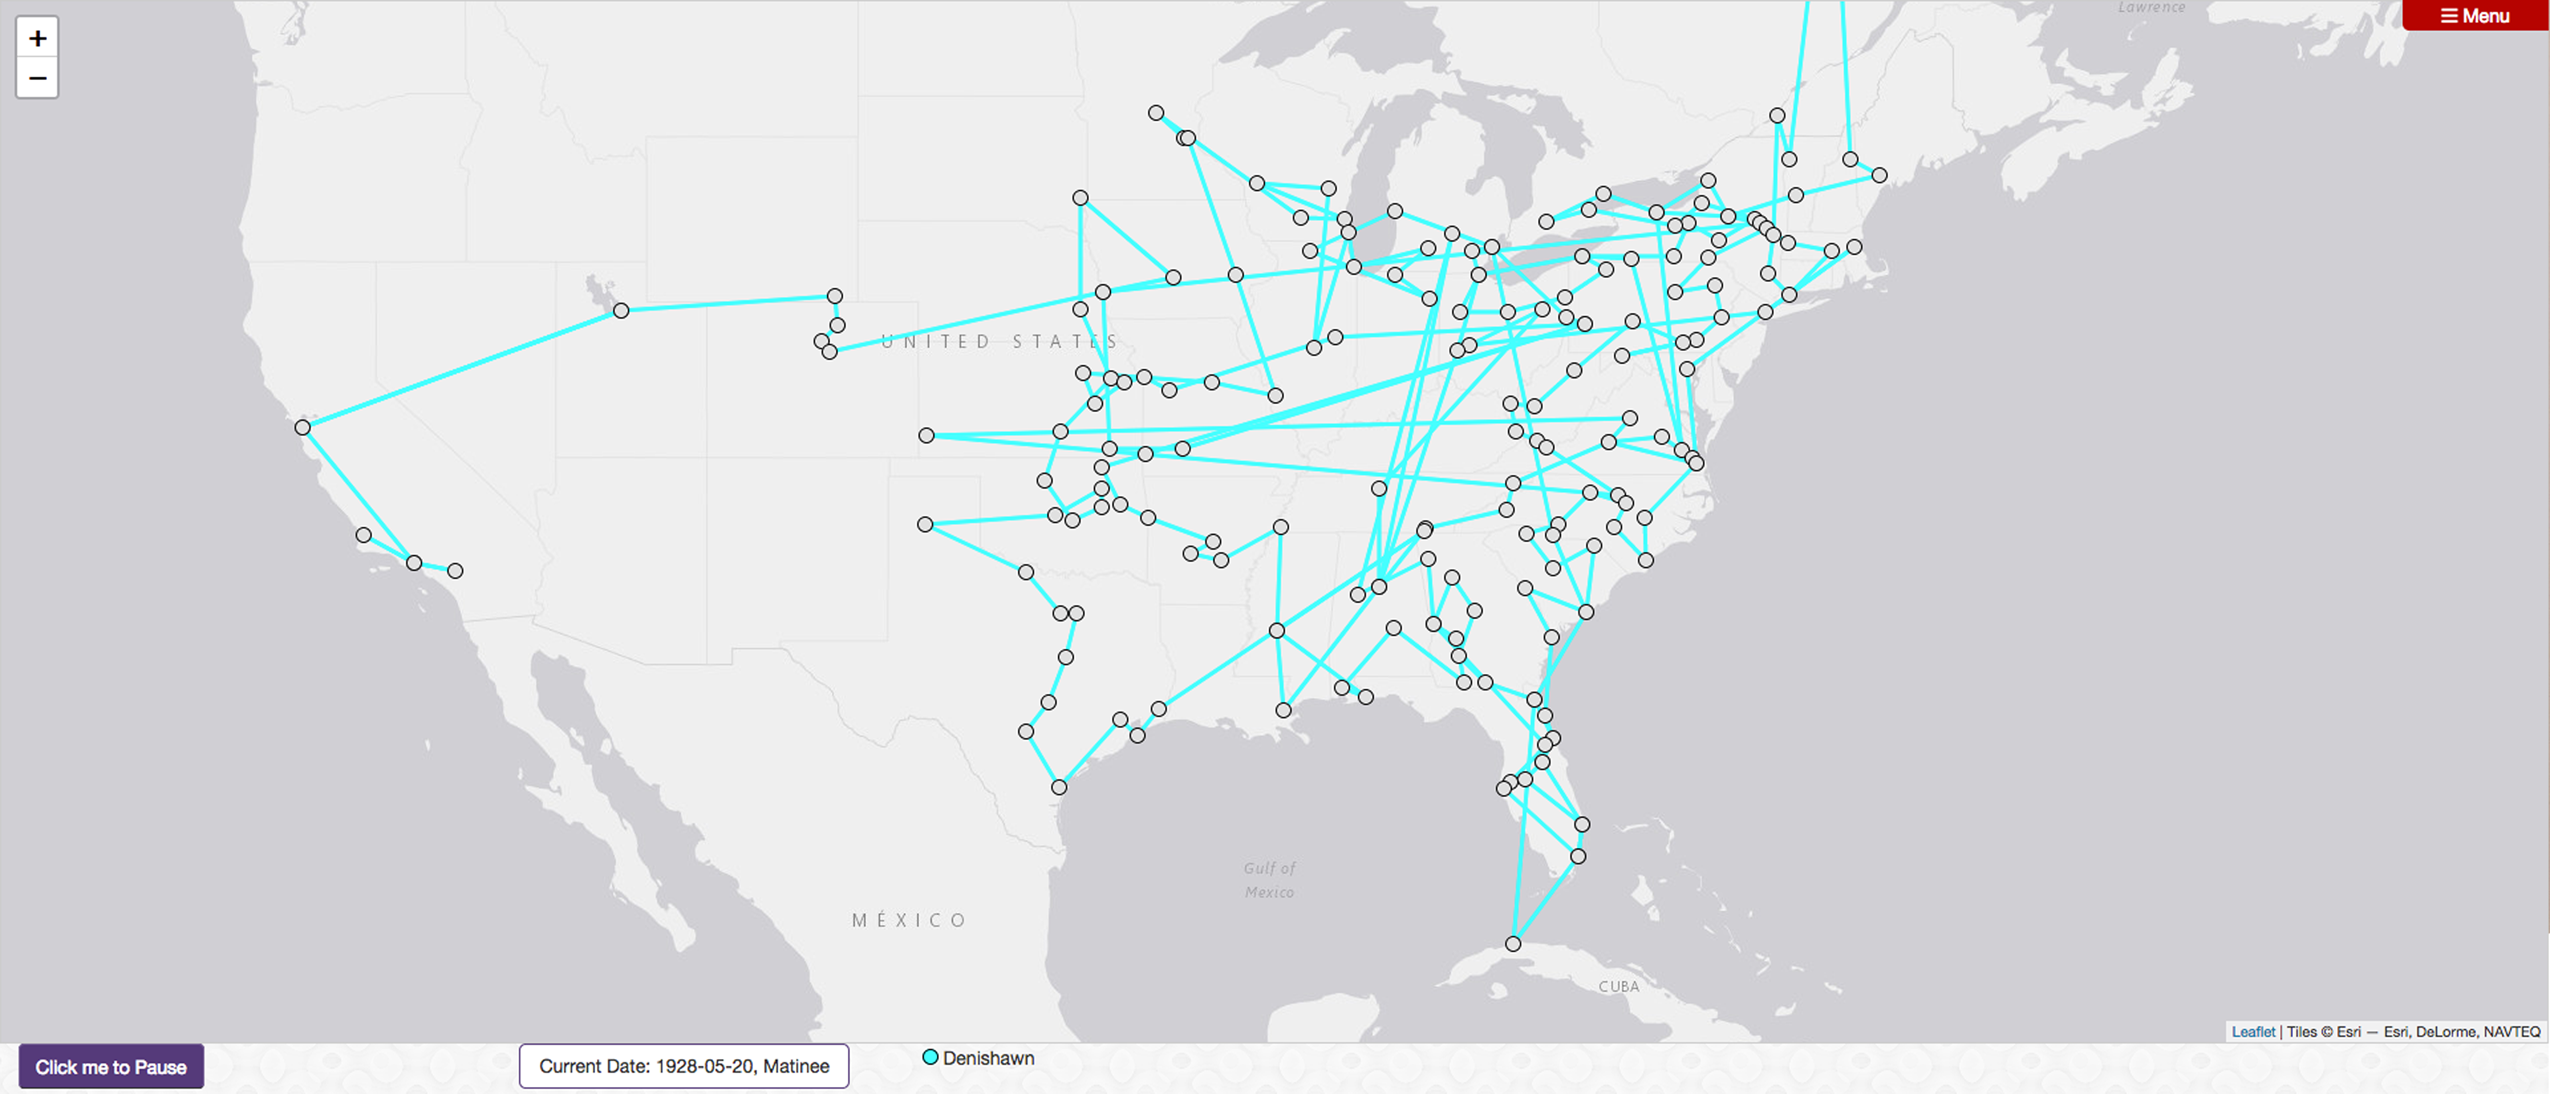
Although Denishawn typically observed a fall to spring performance season, after spending fifteen months abroad without a substantial break, they immediately began touring the United States, reprising old favorites and introducing new works to their American audiences. As can be seen in Photo 8, the two tours after Denishawn returned to the United States covered much of the same territory as the two preceding their departure, but whereas their 1924–25 tour stopped in many destinations throughout the North- and Southwest, the abbreviated 1926–27 American season skipped most of this area. For the 1927–28 tour, widely regarded as the beginning of the end of Denishawn,Footnote 17 they joined the Ziegfeld Follies in touring the East and Midwest, as well as to Havana, Cuba. Even though Denishawn's roots were in Los Angeles, these tours collectively favor the eastern half of the United States. Nevertheless, the geographic distribution of their performance engagements is remarkable. It shows a portrait of the early twentieth-century dance landscape distinct from the picture that would later emerge as more and more dance groups, including those founded by former Denishawn dancers, established themselves in New York City and other metropoles. Seeing the sheer extent of Denishawn's travels just in the handful of years explored in this article suggests that dance scholars have much more to learn about the part that heretofore overlooked towns throughout the American Midwest and South played in supporting a performing arts ecosystem in the first half of the twentieth century, as well as the historical importance of touring circuits to the past and present of concert dance in the United States.
Screenshot of the Mapping Touring Route Map visualization option with the touring data for Denishawn's 1926–27 and 1927–28 tours of the United States, Canada, and Cuba. Source: Mapping Touring data visualized by the author with a visualization tool designed by Chris Britt. https://mappingtouring.osu.edu/visualization/route.

Conclusion
Part of a field-wide return to and reimaging of dance archives, Mapping Touring culls performance metadata from archived ephemera, focusing on performance programs supplemented by newspaper advertisements and reviews, scrapbooks and other memorabilia, to track early twentieth-century dance troupes as they toured. Whereas other digital archive dance projects tend to focus on a single artist/troupe or on highlighting aspects of library-held special collections, Mapping Touring gathers location and repertory data for multiple dance troupes to underscore the importance of touring to both the collection and dissemination of gestures and movement vocabularies in twentieth-century dance histories. This is an iterative and ongoing process, and this essay marks a specific juncture in the history of this project, which will continue to grow and evolve.Footnote 18
In this article, I have introduced and described Mapping Touring and employed it in a spatial analysis of Denishawn's touring prior to and immediately following the company's tour to Asia. Acknowledging the common dance studies approach of examining repertory with an eye toward the politics of cultural representation onstage, Mapping Touring traces instead how far these representations, in the form of repertory, traveled. Traveling dancers both pick up and disseminate movements in the places they visit. I therefore contend that dance is a specifically corporeal form of traveling theory, and that dance offers a means of circulating theories of embodiment. Thus, in addition to addressing the representational politics of their work, further consideration of the extent of their touring is warranted. Whereas narratives of dance history tend to emphasize large metropoles in the development of concert dance in the United States, Mapping Touring in general and Denishawn's touring in particular invite a reevaluation of the broader dance landscape, including the importance of smaller cities throughout the American South and Midwest in sustaining dance troupes in the early twentieth century.