In recent years, the microelectromechanical system (MEMS) industry has seen an increase in the number of devices using metal films as moving components, particularly in the area of radio-frequency power handling switches.[Reference Keimel, Claydon, Li, Park and Valdes1, Reference Pillans, Kleber, Goldsmith and Eberly2] As device performance is greatly dependent on the mechanical properties of the films used, which are, in turn, heavily dependent on their deposition parameters, there is a need for quality control (QC) techniques that can quickly and reliably detect variations in these properties. Such techniques must rely solely on fabrication processes that are compatible with, if not identical to, those used to make the actual devices. The techniques must also be relatively quick and easy to perform on a large number of samples, so that process tolerances can be accurately defined based on acceptable statistical variations. These requirements rule out any focused ion beam-dependent techniques, which are extremely common today,[Reference Uchic, Shade and Dimiduk3, Reference Greer and Nix4] as it is not feasible for such techniques to generate large enough data sets for QC applications. The requirements also rule out techniques that are reliant on complex equipment or in situ observation,[Reference Kiener, Grosinger, Dehm and Pippan5, Reference Takahashi, Kondo, Niimi and Nokuo6] as these tests tend to be slower in both experimental setup and data analysis.
In this work, we extend the application of the microscale theta test specimen to metal thin films. This specimen, introduced previously,[Reference Gaither, DelRio, Gates, Fuller and Cook7] allows for a statistically significant number of samples to be tested in a time-efficient manner. This specimen geometry resembles the Greek letter Θ, and mitigates many of the gripping and alignment issues that are common with tensile test specimens.[Reference Lord, Roebuck, Morrell and Lube8] Previous works examined both intended[Reference Gaither, Gates, Kirkpatrick, Cook and DelRio9] and unintended[Reference Gaither, DelRio, Gates and Cook10] etching process effects on the surface structure, fracture strength, and reliability of “brittle” (single-crystal silicon) devices. In this work, we extend usage of the theta specimen to examine the mechanical properties of a “ductile” (electroplated gold) thin film, not only to demonstrate the specimen's potential for extracting both elastic and plastic material properties, but also to show its usefulness to QC in metal MEMS device fabrication.
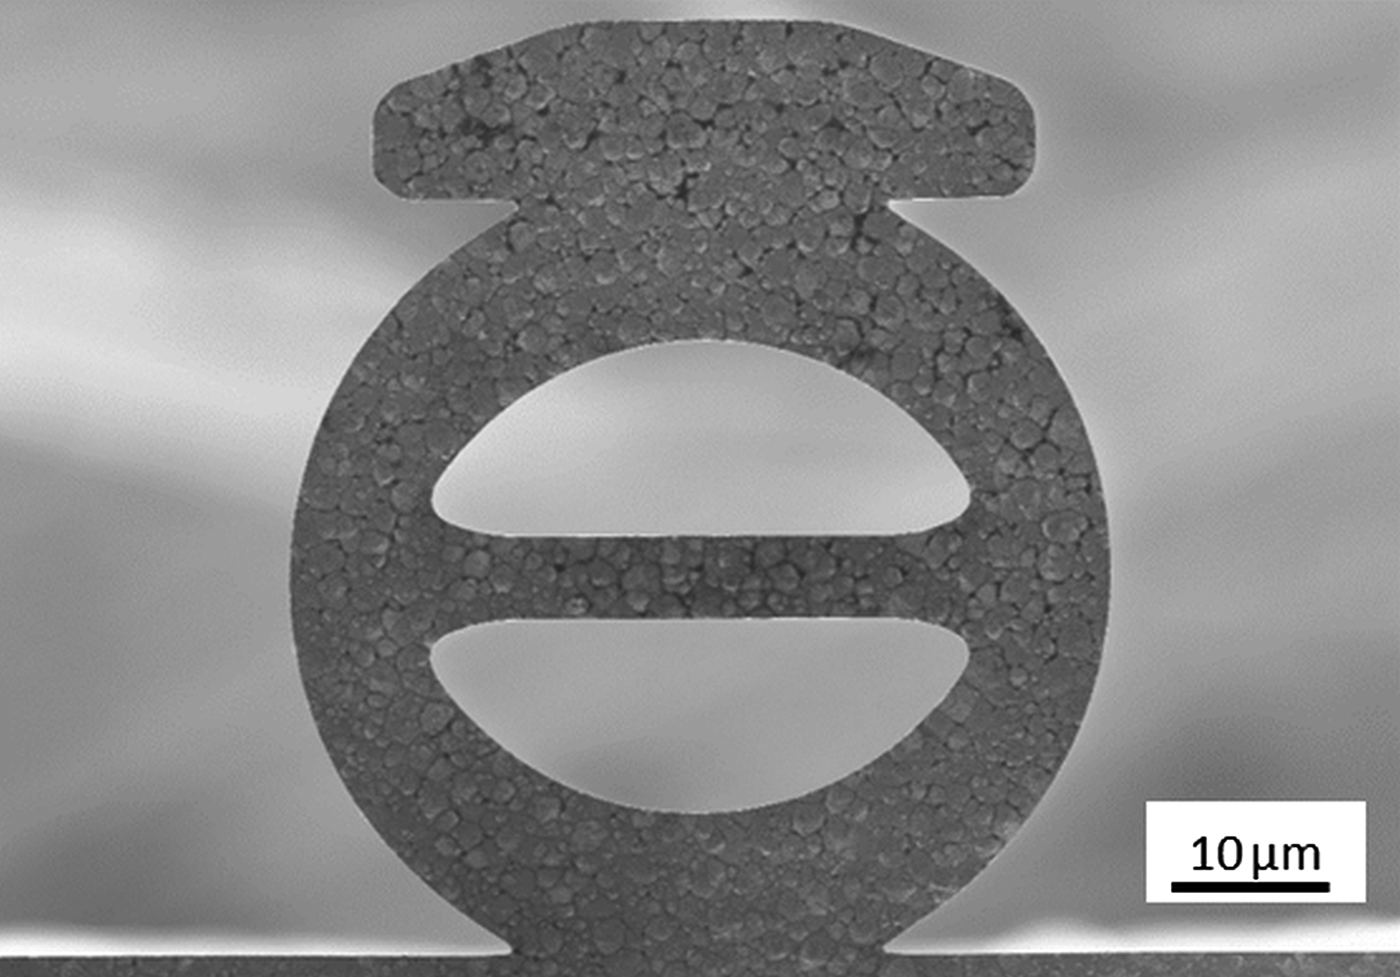
The process steps used to fabricate the Au theta specimens are shown in Fig. 1. First, a 2 µm thick thermal SiO2 layer was grown on a 525 µm thick (100) single-crystal Si wafer [Fig. 1(a)]. Next, a standard combination of photolithography and electroplating was used to pattern and deposit a 5.5 µm thick Au alloy film on the frontside of the wafer [Fig. 1(b)]. At this point, the thermal oxide was removed from the backside of the wafer, and a 250 nm thick SiO2 film was sputtered on top of the Au alloy film to act as a protective layer during subsequent processing steps (not shown). A thick photoresist was then spun onto the backside of the wafer and a back-to-front alignment was performed during its exposure. Once developed, this resist was used as a mask for deep reactive ion etching (DRIE) to etch through the wafer from the backside and stop on the frontside thermal oxide [Fig. 1(c)]. Finally, a hydrofluoric (HF) acid vapor etch was used to remove both frontside oxides (i.e., thermal and sputtered oxides), thereby creating freestanding test samples [Fig. 1(d)]. Test strips, containing between 8 and 12 theta specimens, were removed from the wafer using a diamond scribe on notched regions at each end of the strip. A scanning electron microscope (SEM) image of a finished sample is shown in Fig. 2. Samples were created with outer diameters D ranging from 50 to 100 µm and web widths w of 4.5 and 5.5 µm. It should be noted that it may be necessary to modify these process steps in order to test other materials. In particular, the HF vapor release etch is likely to cause significant damage to a number of other metals. If testing of incompatible metals is desired, a modified release process will need to be used, presumably similar to that used to release the actual MEMS devices made from those films.
Fabrication sequence for Au theta specimens. (a) A thermal SiO2 layer was grown on a Si wafer. (b) Photolithography and electroplating were used to pattern and deposit an Au film on the frontside of the Si wafer. (c) DRIE was used to etch the backside of the Si wafer. (d) HF vapor etch was used to remove the SiO2 films.

SEM image of a completed theta specimen with an outer diameter of 50 µm and a web width of 5.5 µm.
Testing was conducted in a similar fashion to that used previously.[Reference Gaither, DelRio, Gates, Fuller and Cook7] Briefly, the test strips were clamped into a fixture and mounted into an instrumented indentation testing (IIT) device. Each sample was diametrally compressed by IIT using a 250 µm radius spherical sapphire indenter tip. Each test consisted of a load ramp to 10 mN, a series of unload–load cycles between 5 and 10 mN, and finally a second load ramp until a maximum load was reached, at which point the test was halted to avoid buckling of the sample. Load P and displacement h were recorded throughout the cyclic loading and sample failure measurements with data acquisition rates of 1 and 100 Hz, respectively. Finite-element analysis (FEA) was then used to extract material properties from the experimental P–h response; the details regarding the FEA model can be found in the supplemental online material. In short, a Ramberg–Osgood constitutive law[Reference Ramberg and Osgood11] was used to define the material behavior, and the Young's modulus, E, yield strength, σ y, and strain hardening exponent, n, were varied iteratively until the P–h response from the FEA matched that of the experiments.
Figure 3 shows several experimental P–h curves from theta specimens with D of 50 µm and w of 5.5 µm (D50_W5.5). The initial non-linear region at small P was probably due to two factors: (1) contacting and seating of the sapphire indenter tip on the surface of the specimen and (2) limited plastic deformation in the specimen. The P–h traces for all the unloading–loading cycles between 5 and 10 mN were indistinguishable and linear, indicative of negligible hysteresis, and a completely elastic response. Further testing was conducted on specimens with D and w of 50 and 4.5 µm (D50_W4.5), respectively, and 90 and 4.5 µm (D90_W4.5), respectively. The P–h traces for the unloading–loading cycles between 5 and 10 mN were also indistinguishable and linear for these specimens, but with different slopes, indicating that the specimen compliance λ is sensitive to changes in geometry. More specifically, λ varied from 32.5 ± 0.417 nm/mN for the D50_W5.5 specimens to 46.7 ± 0.741 nm/mN for the D90_W4.5 specimens. The final loading sequence to failure was non-linear, this time solely due to plasticity in the specimen. It is important to note that Fig. 3 contains five individual P–h curves that are nearly indistinguishable from one another. This type of extremely repeatable result from nominally identical samples is an important requirement for use in QC applications.
Experimental P–h curves from theta specimens with D of 50 µm and w of 5.5 µm (D50_W5.5). After the initial non-linear region, the P–h curves for all unloading–loading cycles between 5 and 10 mN were indistinguishable and linear, indicative of negligible hysteresis, and an elastic response. More importantly, the five P–h curves are nearly indistinguishable from one another.
The experimental P–h responses from 5 mN to failure were fit to the FEA model as shown in Fig. 4(a), using E, σ y, and n as the fit parameters. The E was varied until the FEA λ values matched the experimental λ values, whereas σ y and n were varied until the error between the FEA and experimental curves, defined as the normalized sum of squared residuals (SSR), was minimized. For the D50_W5.5 specimens, the values of E, σ y, and n were 54 GPa, 365 MPa, and 0.28, respectively. Overall, the P–h response from FEA is in good agreement with the experimental results, as shown in Fig. 4(a) and there are a few things worth noting about the extracted values. For instance, although lower than the bulk, isotropic value of 78 GPa,[Reference Hertzberg12] an E value of 54 GPa is consistent with previously reported values for Au films[Reference Espinosa and Prorok13] and in agreement with both laser doppler vibrometry[Reference Gates and Pratt14] and reference cantilever atomic force microscopy[Reference Gates and Reitsma15] measurements performed on the same film (see supplemental online material). Furthermore, although a σ y value of 365 MPa would be too large for a pure Au film of this thickness,[Reference Chasiotis, Bateson, Timpano, McMarty, Barker and Stanec16] it is well known that the addition of alloying elements can have dramatic effects on the properties of electroplated Au films,[Reference Yang, Lichtenwalner, Morris, Krim and Kingon17] so an increased yield strength is expected. However, this value could not be verified by other techniques as was performed for E.
(a) Experimental and FEA P–h response from 5 mN to failure for a D50_W5.5 theta specimen. The values of E, σ y, and n used in the FEA model to generate the curve labeled “FEA Best Fit” were 54 GPa, 365 MPa, and 0.28, respectively. These values represent the actual material properties of the film. (b) FEA fitting residuals with independent variations of ±10% in E, σ y, and n. From the residuals, it is clear that the technique can detect small changes in material properties.
To predict the sensitivity of this technique to changes in material properties, FEA models were run with independent variations of ±10% in E, σ y, and n as shown in Fig. 4(b). As expected, λ scaled approximately linearly with E, suggesting that any variation greater than a few percent should be easily identifiable. The effect of varying σ y clearly shows a significant shift in the expected P–h curve from the expected behavior (labeled as “Best Fit”). An order of magnitude increase in the SSR error was calculated from these offset curves. Finally, the variations in n resulted in two- to threefold increases in the SSR error. Although these trends require experimental validation, it is anticipated that the theta technique will be sensitive enough to detect significant deviations from the expected material properties. Furthermore, the fit residuals exhibit a shape characteristic to each material property deviation that makes identifying the model parameter in need of adjustment easier.
In summary, this work represents the first known use of the theta specimen geometry to measure the material properties of thin metal films. This initial evaluation has shown the results were extremely repeatable and sensitive to variations in both specimen geometry and material properties. Similar to their single-crystal silicon counterparts, these attributes suggest that the theta specimen may have substantial value as a QC technique for metal MEMS device fabrication, capable of easily and quickly detecting when fabrication processes are out of tolerance. Furthermore, quantitative material property extraction is possible using FEA, although this process is quite slow and has only been independently validated for elastic properties at this point. Further investigation, most likely involving in situ testing and direct strain measurement, is needed to verify that plastic properties can also be accurately measured.
Supplementary materials
For supplementary material for this article, please visit http://dx.doi.org/10.1557/mrc.2015.48
Acknowledgements
The authors would like to acknowledge Drs Robert F. Cook, Richard S. Gates, and Brian G. Bush from the National Institute of Standards and Technology for their contributions to this work. Some research was performed at the NIST Center for Nanoscale Science and Technology (CNST).