I. INTRODUCTION
Relatively, low melting temperature (1373–1473 K) Reference Zallen1 and low glass transition temperature (643–771 K) of phosphate glasses in comparison with silicate glass make them attractive for various special applications. Reference Marino, Arrasmith, Gregg, Jacobs, Chen and Duc2 Phosphate glass with relatively high refractive indices (above 1.52) and less dispersion compared with silicate-based optical glass was developed for achromatic optical elements. Reference Zachariasen3,Reference Ohkawa, Min, Akiyama, Yamamoto and Sugimoto4 Alkali aluminophosphate compositions are useful for specialty hermetic seals, Reference Kreidl and Weyl5 biocompatible phosphate glasses have medical applications, Reference Brow, Kovacic and Loehman6 and amorphous lithium phosphate Reference Day, Wu, Ray and Hrma7 and phosphorous oxinitrided glasses Reference Karabulut, Marasinghe, Ray, Day, Ozturk and Waddill8 are useful for solid-state electrolytes. Nd-doped phosphate glasses have emerged as active materials in the large laser amplifiers. Reference Sales and Boatner9–Reference Fu11 However, phosphate glasses are sensitive to humidity and not chemically durable like silica glasses. Reference Bates, Dudeney, Gruzalski, Zuhr, Choudhury, Luck and Robertson12 Addition of alumina in phosphate network enhances chemical durability compromising low melting temperature. Further, doping of iron in the phosphate network improves its chemical durability, and iron phosphate glasses have promising application, such as nuclear waste immobilization Reference Campbell, Suratwala, Thorsness, Hayden, Thorne, Cimino, Marker, Takeuchi, Smolley and Ficini-Dorn13–Reference Campbell15 and heat absorbing components.
Conventionally, the glasses are being prepared in a resistance heating electrical furnace, which consumes significant power and requires long time to complete the melting cycle. Even the induction heating process that uses radio frequency demands considerable power for glass melting and requires costly equipment. Preparation of glasses by gas- and oil-fired furnaces has their limitation of operational difficulty as well as it is not considered an environmentally clean method. To overcome long melting time with consumption of high electric power by joule heating or induction heating and emission of greenhouse gases in oil- and gas-fired furnaces, dielectric heating of glass constituents, particularly using microwave (MW) radiation, may be adopted. MW heating provides very short processing time due to rapid, selective and volumetric heating and requires less power as compared with conventional heating. Improved melt uniformity can be obtained due to volumetric heating in MW heating. Hence, melting with MW radiation is considered to be very efficient. But, the major challenges of processing of glasses in MW heating are: (i) large number of materials are transparent to MW at room temperature especially, most of the raw materials being transparent to MW energy and it is difficult to achieve uniform heating throughout the melt, (ii) nonavailability of suitable MW equipment for melting glass.
Since commercial silicate glasses are transparent to MW radiation at room temperature, chemical batches for these glasses are heated conventionally up to 773–873 K to allow coupling with the electromagnetic field. Reference Knox and Copley16 Alternatively, an MW absorber may be mixed with the glass batch to allow the coupling with the electromagnetic radiation. An MW susceptor may also be placed around the crucible to speed up heating particularly from room temperature and after attaining higher temperature, the glass batch starts absorbing MW to continue further raising the temperature till melting. Feasibility experiment of glass melting by MW heating has already been reported in several glass systems, such as niobium phosphate, Reference Ghussn and Martinelli17 lithium phosphate, Reference Wang, Jeng and Ni18 molybdophosphate and tungstophosphate, Reference Chenu, Rocherullè, Lebullenger, Merdrignac, Chevire, Tessier and Oudadesse19 iron phosphate, Reference Almeida, Martinelli and Partiti20 and inorganic glasses, Reference Vaidhyanathan, Ganguli and Rao21 etc. But most of studies were carried out in a kitchen MW oven in which a proper control of process could not be made. Also, most of the reported glass-melting activities were investigated using only 15–20-g glass batch having maximum melting temperature <1473 K.
In this study, attempts have been made to look into the possibility of melting alumino-phosphate glass with iron as a dopant (useful for heat absorbing application) using MW radiation in the temperature range of 1673–1723 K.
II. EXPERIMENTS
The iron-doped alumino-phosphate glass having composition in wt% (P2O5, 77.6; Al2O3, 14; B2O3−, 1.65; MgO, 2.25; and ZnO, 4.50) with Fe, 2.67 as a dopant was prepared by a melt quenching technique in an MW furnace. The sources of P2O5, primary glass-forming oxide, in the glass batch are Al(PO3)3, BPO4, Mg(PO3)2 (Ferak Laborat, Berlin, Germany) and NH4H2PO4 (LOBA Chemie, Mumbai, India, 99.0%). Al(PO3)3, BPO4, Mg(PO3)2 are also the sources of constituents, such as Al2O3, B2O3, and MgO. All these raw materials as a source of P2O5 were selected based on less handling of raw material and also low forthing effect due to lack of evolution of gaseous component in it. ZnO (Merck 99.5%, Mumbai, India) and Fe metal powder (LOBA Chemie 99.5%) were added in the batch composition. At least one ingredient of glass batch should be a good MW absorber to couple with the MW radiation to generate heat. Reference Vaidhyanathan and Rao22 MW absorption of major glass constituent, i.e., Al(PO3)3, BPO4, and Mg(PO3)2, was studied separately. Known quantity (∼20 g) of each component was made into the shape of pellet at 4 T pressure and placed in an alumina crucible inside an MW transparent insulation box without surrounded by any MW absorber and following observations are noticed:
-
(i) Al(PO3)3 was found to be a poor MW absorber with slow increase of MW output power up to 0.9 kW.
-
(ii) B(PO)4 was found to be a good MW absorber at 0.7 kW MW output power and temperature above 1073 K was noticed at ∼1 kW MW power.
-
(iii) Absorption of MW was also found to be moderate for Mg(PO3)2 at 0.7 kW MW power.
-
(iv) Other constituent ZnO and Fe or Fe2O3 are considered to be a very good MW absorber as reported previously. Reference Vaidhyanathan and Rao22,Reference Rao, Vaidhyanathan, Ganguli and Ramakrishnan23
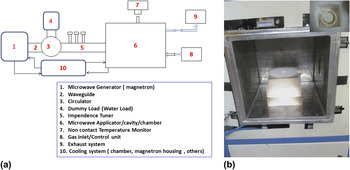
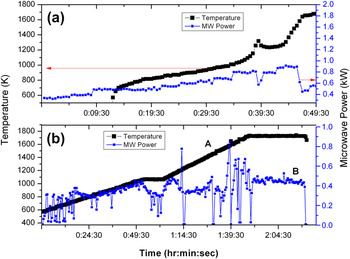
All the raw materials for chemical batches to yield 60-g glass were weighed in stoichiometric amounts and mixed using an agate mortar with pestle to have homogeneous mixture and placed in an alumina crucible inside an MW transparent insulation box. The insulation box having an opening (Ø20 mm) at the top cover is used to monitor temperature. The insulation with crucible was placed into MW cavity of a multimode MW furnace of 3 kW output powers, 2.45 GHz frequency (from M/S Enerzi Microwave Systems Pvt. Ltd., Bangalore, India) for melting in a closed air atmosphere. A schematic diagram of the multimode MW system with utilities is presented in Fig. 1(a) and insulation arrangement inside MW cavity with crucible is presented in the photograph, shown in Fig. 1(b). The heating was initiated at a rate of 15–25 K/min up to 1723 K and kept for 30 min at that temperature. Temperature of the sample was monitored by infrared noncontact pyrometer (range of operation: 260–1800 °C, accuracy and repeatability ±0.3% of the measured value + 1 K) fitted in the furnace along with proportional-integral-derivative (PID) controller (Make: Eurotherm, Model 2416) for controlling MW output power. MW power and temperature were recorded by DAQSOFT Software attached in a computer considering the emissivity of 0.45. SiC blocks were placed around the crucible to initiate faster heating of glass batch at room temperature in the MW furnace. Once raised to certain critical temperature, glass batch started coupling with MW energy due to structural relaxation. To understand the critical temperature at which MW couples strongly with the component of glass batch, 30 g thoroughly mixed glass batch was formed into pellet and placed inside alumina crucible and exposed with MW radiation without surrounded by any MW absorber (i.e., SiC, etc.). Temperature–time profile, shown in Fig. 2(a), was recorded with manual controlling of MW power. Figure 2(a) depicted the temperature recording (533 K onwards) after 14-min exposure of glass batch inside MW cavity with slow increase of MW power at 0.550 kW and faster heating of glass was observed at temperature ∼923–973 K at 0.700 kW MW power.
(a) A schematic diagram of the multimode MW system. (b) The photograph of insulation arrangement inside MW cavity (inset showing the picture of crucible inside insulation).

(a) Temperature–MW output power–time profile with manual controlling of MW output power. (b) Temperature (A) and MW output power (B) with time for glass melted in the MW furnace in program mode.

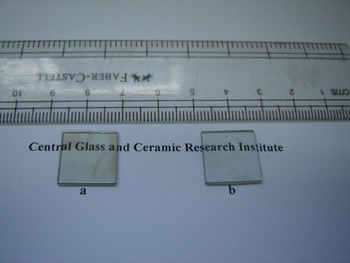
Molten glass without manual stirring was cast into a preheated steel mold (∼573 K) and subsequently annealing was carried out at 853 K for 2 h followed by controlled cooling (1 K/min) up to room temperature to eliminate thermal stresses. The annealed glass sample, prepared in the MW furnace, was labeled as GMW as shown in Fig. 3(a).
(a) Glass melted in the electric furnace (GRH). (b) Glass melted in the MW furnace (GMW).

The 60-g glass with the same composition was also melted in a conventional resistance heating furnace. A furnace heating rate was restricted to 5 K/min with holding for 2 h at 1723 K. The molten glass was manually stirred to have homogeneous glass. The molten glass was cast into a preheated steel mold and annealing was carried out as discussed earlier. The obtained glass sample is named as GRH (glass melted by resistance heating). The sample has been shown in the photograph, Fig. 3(b).
Densities of glasses were determined by the Archimedes’ principle using distilled water as buoyancy liquid. The measurement of density was carried out three times for each sample and the standard deviation of the three measurements was reported as error limit (±0.001). XRD analysis was performed on 94 X’Pert, PANalytical using Ni-filtered Cu Kα radiation with wave length of 1.5406 Å to confirm the amorphous nature of the sample. The scanning was carried out in the 2θ range of 5–90° with a step size of 0.05° per min. Chemical analysis of the glasses was performed through inductively coupled plasma atomic emission spectroscopy for MgO, ZnO, and Fe2O3 in a spectro analytical instrument, Germany, complexometry for Al2O3, and volumetric titrimetry for P2O5, B2O3. Glass transition temperature, T g, which is a characteristic feature of glass, was determined by differential thermal analysis (DTA) analysis (NETZSCH STA 409 C/CD) at a heating rate of 10 K/min under flowing air with an accuracy ±1 K. Refractive indices of glass samples have been measured at five wave lengths (473, 532, 633, 1064, and 1552 nm) on a prism coupler (Metricon Model-2010, Pennington, NJ) fitted with five different lasers as illuminating sources. For each sample, three measurements were recorded for each wave length and the standard deviation has been reported as error bar.
The optical transmission spectra were recorded on a UV–VIS-NIR spectrophotometer (Model: UV-3101PC of Shimadzu, Kyoto, Japan) in the wave length range of 200–2000 nm. Fourier transform infrared (FTIR) measurements were performed on FTIR spectrophotometer (Model: 1615, Perkin Elmer Corporation, Waltham, MA) with a spectral resolution of 4 cm−1 over a spectral range of 400–1500 cm−1.
III. RESULT AND DISCUSSION
Figure 3 represents the photograph of both glasses melted in the conventional resistance heating electric furnace (GRH), marked as (a) and in the MW furnace (GMW), marked as (b). Both the samples were observed to be visually transparent.
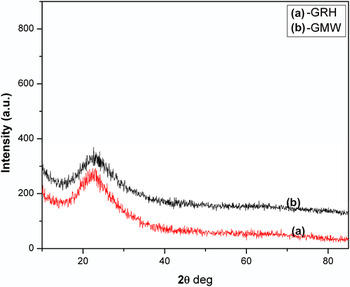
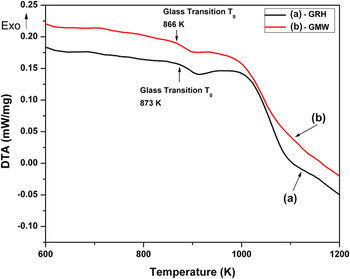
The amorphous nature of the prepared samples has been confirmed from the measured x-ray diffraction (XRD) patterns that are presented in Fig. 4. A broad hump has been observed in XRD curves for both the samples indicating glass formation. Figure 5 illustrates the DTA curve for GRH and GMW samples. From this figure, (T g) glass transition temperatures have been observed at 866 K and 873 K for GMW and GRH samples, respectively. The difference of glass transition temperatures appears to be due to the difference in a cooling rate for different melting methods and also due to the slight changes in chemical composition resulting from different evaporation behavior in the two methods. In the MW furnace, time taken to pour the molten glass into preheated mold is more in comparison with conventional melting due to stepwise shut down of the MW furnace and removal of crucible with molten glass from the insulation box, making the cooling rate lower. Hence, this lower cooling rate during glass formation in MW processing is making the T g lower than in the conventionally prepared sample. Also evaporation loss in conventional melting is more, whereas in MW processing, loss due to evaporation of glass constituent is less.
XRD profile (a) for GRH and (b) for GMW.

DTA curves (a) for GRH and (b) for GMW.

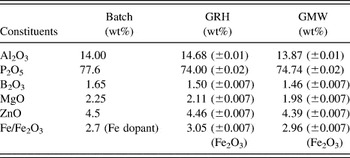
The complete chemical analysis was carried out for these two samples and is presented in Table I. An Al2O3 content was found to be higher in the GRH sample than in a precursor batch (>5%) as shown in Table I, indicating leaching of alumina from crucible wall in the conventional furnace. Leaching of Al2O3 is minimized in the sample prepared in the MW furnace because of less time required to melt glass in the MW furnace and also temperature of alumina crucible is less in the MW furnace because the precursors are directly heated by MW energy. The result shows that P2O5, being the more volatile constituent, is less in the GRH (74.00%) sample compared with the GMW (74.74%) sample signifying more evaporation of P2O5 in the conventional process. Due to the above reasons, the GMW sample is more close to the batch composition compared with the GRH sample. Hence, optimization of composition for new glass is easier in the MW furnace.
Chemical analysis results for GRH and GMW samples with batch composition.

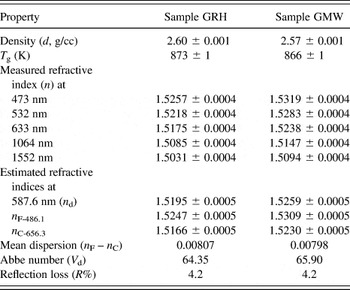
The measured densities and refractive indices of both samples have been given in Table II. The density of the GMW sample is found to be slightly less than that of the GRH sample due to less evaporation of more volatile component (i.e., P2O5) during melting in the MW furnace and also due to less leaching of Al2O3 from the wall. During the melting process, evaporation of all constituents is not equal and evaporation of P2O5 in conventional melting is found to be more. More evaporation loss of P2O5 having less density compared with other constituents, resulted higher density of glass melted in the conventional furnace. Moreover, densities of glasses prepared by both the methods were also checked theoretically by SCI glass software (method Priven 2000) using the glass composition obtained by chemical analysis and the results obtained supported the experimental value of less density for GMW than in GRH.
Optical properties for GRH and GMW samples were calculated from their measured refractive indices and are presented.

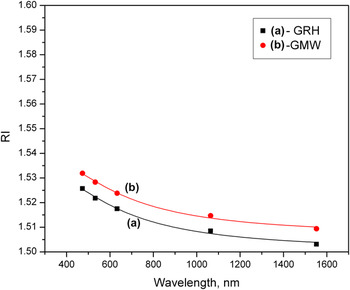
The refractive index values also exhibited noticeable change from GMW to GRH glass. The measured refractive indices of GRH and GMW at five wave lengths (473, 532, 633, 1064, and 1552 nm) were used to plot the dispersion curve as shown in Fig. 4 and curve fitting was obtained by fitting the measured refractive indices with the Cauchy Eq. (1).
 $$n{\rm{(\lambda )}} = A + {B \over {{{\rm{\lambda }}^2}}} + {C \over {{{\rm{\lambda }}^4}}} + \cdots \quad ,$$
where, n is the refractive index at wave length λ. The refractive indices at standard wave lengths n d (at 587.6 nm), n F (at 486.1 nm), and n C (at 656.3 nm) have been estimated from the dispersion curves (Fig. 6) to evaluate the Abbe number (νd) is defined as Eq. (2)
 $${\nu _{\rm d} = {{({n_{\rm{d}}} - 1)} \over {({n_{\rm{F}}} - {n_{\rm{C}}})}}\quad .$$
Refractive indices were plotted with the respective wave lengths (473, 532, 633, 1064, and 1552 nm), and the points were fitted by Cauchy curve fitting equation. Curve (a) for GRH and (b) for GMW.

Table II also lists the estimated values of mean dispersion (n F − n C), Abbe number (νd) and reflection losses (R%) for both these glasses. From this data, it is clear that Abbe number of GMW is slightly higher signifying low dispersion glass prepared under MW melting.
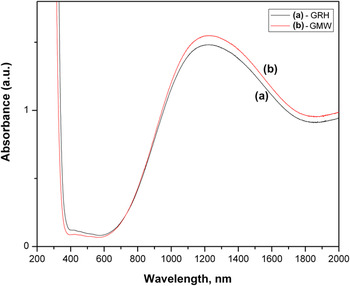
The optical absorption spectra of the studied glasses have been recorded on a UV–VIS-NIR spectrophotometer in the wave length range of 200–2000 nm and presented in Fig. 7. Typical spectral features due to the transitions originating from divalent and trivalent oxidation states of iron (Fe) are distinctly detected. The broad absorption at ∼1000–1200 nm can be attributed to the spin-allowed transitions corresponding to the 5T2(D) → 5E(D) transition of Fe2+ ions occupying octahedral sites and peaks at 400–450 nm are due to the presence of Fe3+. Fe3+ has a 3d 5 electronic configuration and all d–d absorptions are spin-forbidden, causing weak Fe3+ peak intensity. Reference Glebov and Boulos24,Reference Bingham, Parker, Searle and Smith25
UV–VIS-NIR absorption spectra (a) for GRH and (b) for GMW.

It is to mention here that oxygen-metal charge-transfer band at wave length <380 nm which is very much probable in Fe-doped materials could not be seen due to its overlap with the UV band edge of the phosphate host glass. Absorption peak intensity of Fe2+ ions for GMW [Fig. 7(b)] is more in comparision with the intensity of GRH [Fig. 7(a)], whereas absorption peak intensity of Fe3+ ions is less for GMW. This indicates that iron redox ratio, Fe2+/ΣFe, is found to be more in the GMW sample. Therefore, glasses produced in the MW furnace present higher Fe2+/(Fe3+ + Fe2+) ratios compared with the conventional furnace. This may be due to the effect of MW radiation on the 3d levels of Fe. Interaction of the MW radiation with incomplete 3d level electrons could disturb the energy distribution and therefore affect the redox equilibrium in these materials as discussed by Almeida et al. Reference Almeida, Martinelli and Partiti20 Another explanation may be the difference of local atmosphere for both processes affecting iron redox ratio. This difference in local atmosphere may be expected because in conventional melting, the furnace environment is open with ambient and considered to be more oxidizing than in the MW furnace where the system is in closed condition. Further, lesser heating time in MW melting may also affect the Fe2+/ΣFe.
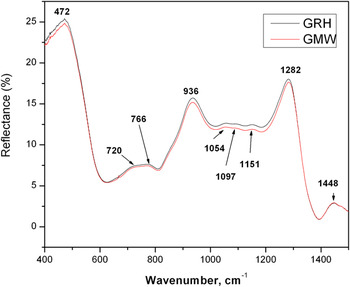
Figure 8 depicts the room temperature FTIR spectra for the studied glasses in the range of 400–1500 cm−1. These FTIR spectra for both the samples indicate identical nature and show the presence of broad bands typical for systems with short-range order. The spectra reveal bands centered around 1448, 1151, 1097, 1054, 766, 720, and 472 cm−1 characteristic of various vibrations of the phosphate tetrahedra, Al–O–Al, and B–O bond stretching in the glasses. The bands appearing in the region 860–1100 cm–1 are due to B–O bond stretching of tetrahedral BO4 units, which are overlapped with phosphate bands. These bands are assigned to the vibration of tetraborate groups of BO4 units. Reference Kamitsos, Karakassides and Chryssikos26,Reference Julien, Massot, Balkanski, Krol and Nazarewicz27 The bands appearing in the region 1150–1450 cm–1 are attributed to the B–O bond stretching of trigonal BO3 units. Reference Kamitsos, Patsis, Karakassides and Chryssikos28 The vibrational bands at around 1151 cm−1 and ∼1282 cm−1 are attributed to symmetric and P=O asymmetric stretching vibrations of (PO2)-(Q2) species, respectively. Reference Le Saoüt, Simon, Fayon, Blinn and Vaills29,Reference Shah, Goswami, Deo, Sarkar, Manikandan, Shrikhande and Kothiyal30 The weak band at ∼1097 cm−1 has been assigned to asymmetric stretching of PO3 groups in (PO4)3 – units, respectively, of metaphosphate chains. Reference Almieda and Mackenzie31 The bands at 720 and 766 cm−1 are due to the symmetric stretching of P–O–P bridges. Reference Dayanand, Bhikshamaiam, Tyagaraju, Salegram and Krishna Murthy32,Reference Ilieva, Jivov, Bogachev, Petkov, Penkov and Dimitriev33 The band appeared at ∼936 cm−1 can be attributed with asymmetric stretching modes of bridging oxygen of P–O–P bonds. Reference Kamitsos, Patsis, Karakassides and Chryssikos28 The band at ∼936 cm−1 can be associated with asymmetric vibrational transitions of (P–O–P) group. Reference Shih, Ding and Lee34 Further, within the range of 400–500 cm−1 and 700–800 cm−1, vibrations appear due to the contribution of the octahedral (AlO6) and tetrahedral (AlO4) coordinated aluminum atoms, Reference Belkébir, Rocha, Esculcas, Berthet, Gilbert, Gabelica, Llabres, Wijzen and Rulmont35 respectively, though their identification with respect to the vibrations assigned to the phosphate groups is not simple to distinguish.
FTIR spectra (a) for GRH and (b) for GMW samples.

The temperature and MW output power profile for the glass produced during its melting in the MW furnace are presented in Fig. 2(b). MW output power was controlled by a programmable controller to maintain the uniform heating rate. It may be noted from the curve B that the maximum MW output power consumption in the furnace is 0.85 kW with an average MW power of 0.50 kW, which is around 25–30% of the power consumed by the conventional resistance heating furnace.
In the present work, it has been observed that although the melting temperatures for both the methods have been kept the same, maximum power required for melting glass by MW heating is <1 kW for the preparation of 60-g studied glass. Further, in the MW furnace, the heating rate was restricted within 15–25 K/min to avoid cracking of crucible due to thermal shock, whereas the heating rate was much less (5 K/min) in an electrical heating furnace to protect heating element, insulating brick inside the furnace cavity, etc. Hence, the time needed to melt the glass in the MW furnace is around 2 h, whereas it is found to be 7–8 h for the glass melted in the resistance heating furnace. Thus, shorter processing time along with less electrical power will be determining to bring down overall economy of glass processing in the MW furnace.
IV. CONCLUSIONS
The alumino-phosphate glass has been successfully melted by MW heating at 1723 K and the physical, chemical, optical, and structural properties were compared with the glass melted in conventional melting using the resistance heating furnace. XRD analysis of the sample prepared in MW has confirmed glass formation. Density of MW melted glass was found to be slightly less due to less evaporation of volatile component, and chemical analysis results show that close stoichiochometry with batch can be prepared with MW. Abbe number of glass prepared in the MW furnace is found to be slightly higher. Optical absorption spectra reveal that glass produced in the MW furnace presents higher Fe2+/(Fe3+ + Fe2+) ratios compared with the conventional furnace. Also, the FTIR spectra for both the samples indicate identical nature. It has been observed that the maximum power required for melting glass by MW heating is <1 kW for the preparation of 60-g glass at 1723 K compared with the power requirement of about 5–6 kW in a similar capacity resistance heating furnace at the same temperature. Further, the time needed to melt the glass in the MW furnace is much less than that of glass prepared in the electric furnace. These may be advantageous for further study to develop glass melting technology in the MW furnace.
ACKNOWLEDGMENTS
Authors would like to thank the Director, CSIR-CGCRI for his kind support through Project No. OLP 0289. Authors sincerely acknowledge the contribution from staff members in GSTS, CSIR-CGCRI for their help when required. We also like to thank Analytical Chemistry Section, Material Characterization Division, CSIR-CGCRI for their help in characterization of glass samples. The authors are sincerely thankful to reviewers for their suggestions to improve the quality of the manuscript.