I. INTRODUCTION
BaTiO3-based ferroelectric glass ceramic systems have been attracting an increasingly fundamental and practical interest because of their low porosity, high dielectric constant, and high dielectric breakdown strengths (BDS). The applications cover the pulse power systems, high-power microwave systems, hybrid vehicles, electric ships, etc. Actually, to achieve high stored electric energy per unit volume is up to now still a challenging task in glass ceramic systems. Dielectric constant and BDS are two important parameters, wherein the BDS is playing an important role in determining the energy storage capability of materials. The BDS of glass ceramics was affected by several factors, such as degree of crystallinity, accumulation of bulk charge, and interfacial area.Reference Huang, Zhang, Ma, Li and Zhang1 In contrast to the conventional powder-processed ferroelectric ceramics, glass-ceramics possess a uniformity of microstructure and an almost zero porosity, which provide unique attributes for high-energy density capacitor applications.Reference Chen, Zhang, Deng, Dai and Li2
To date, within the BaTiO3-based ferroelectric glass ceramic systems available, barium strontium titanate glass ceramic is one of the most widely exploited and extensively studied materials, because of the well-controlled Curie point of BST glass-ceramics by adjusting Ba/Sr ratio, so that the materials with the paraelectric state can maintain good reproductivity at high electric fields.Reference Gorzkowski, Pan, Bender and Wu3 Now, various processing techniques have been utilized to modify the properties of BST glass ceramics, such as internal nucleation of glass monoliths,Reference Herczog4 sintering and crystallization of glass frits,Reference Shyu and Chen5,Reference Kageyama and Takahashi6 and sol–gel method.Reference Wu, Zhang and Yao7,Reference Zhang, Yao, Zhang and Zhai8 It has been reported that the controlled crystallization subjected to the heat treatment within the glass matrix is different from the densification and grain growth in the shaped glass powder compacts.Reference Zhang, Huang, Ma, Wang, Deng and Dai9
Microwave processes have been recently widely used and studied in material science for microwave-assisted organic synthesis, sintering of ceramics,Reference Yasuoka, Nishimura, Nagaoka and Watari10,Reference Vaidhyanathan, Agrawal and Roy11 and also for glass preparation.Reference Vaidhyanathan, Ganguli and Rao12–Reference Hémono, Chenu, Lebullenger, Rocherullé, Kéryvin and Wattiaux14 Contrary to the conventional electrical furnaces, the electromagnetic energy is directly transformed to heat in the material,Reference Chenu, Lebullenger and Rocherullé15 which generates particularly little residual stresses, as microwaves can transfer energy throughout the whole volume of the material.Reference Das, Mukhopadhyay, Datta and Basu16 During the sintering, the microwave processes can dramatically increase the mass transport and sintering rates.Reference Wroe and Rowley17 D’arrigo et al.Reference D'arrigo, Siligardi, Leonelli, So and Kim18 found that the effect of mass transport induced by electromagnetic field concentration at particle edges was the driving force to reduce porosity while crystallization (bulk mass transport) had not been activated.
In this study, a BaCO3–SrCO3–TiO2–Al2O3–SiO2 glass system was chosen and bulk crystallization with different routes was used to obtain the resulting glass-ceramics. Especially, the effects of the microwave processes on microstructure and energy-storage properties of BST-based glass ceramics were systematically investigated. Importantly, a new way to increase the BDS and the energy density of BST glass-ceramics was presented.
II. EXPERIMENTAL PROCEDURE
BST-based glass samples used in this study were prepared with the composition of 14.8BaCO3, 22.2SrCO3, 29TiO2, 12Al2O3, and 22SiO2 (mol%). A powder containing appropriate constituents was ball milled for 20 h in a high-density polyethylene bottle with ethanol as the milling media for homogenous mixing. After drying at 100 °C for 5 h, the powder was placed in an alumina crucible and heated to 1550 °C in an elevator furnace for 3.5 h and then quenched by pouring into a copper mold that was placed in an annealing oven at 700 °C. The casting glass was annealed for 4 h to remove residual stress. The as-annealed glass was cut into piece-shaped samples. Differential scanning calorimeter (DSC) was used to predict the crystallization temperature. Bulk samples were put in alumina crucibles and heated at 10 °C/min up to 1200 °C. The piece-shaped samples were heated by three kinds of crystallization routes to convert the glasses into glass-ceramics (samples C, MW, and C-MW). Samples C were crystallized conventionally at 950 °C for 2 h in a box-type resistance furnace. Samples MW were crystallized by microwave heating (HAMiLab-C1500, SYNOTHERM, 2.45 GHz) at 950 °C for 10 min. Samples C-MW were crystallized conventionally at 950 °C for 2 h and then microwave treated at 950 °C for 2 min. The temperature measurement during microwave treatment was made by an infrared thermometer, which detected the temperature of the samples' surface.
X-ray diffraction (XRD) (D/max2550V, Rigaku, Japan) with Cu Kα radiation was used to investigate the phase evolution. Quantitative phase analysis was carried out using the Rietveld analysis program GSAS.Reference Toby19,Reference Larson and Von Dreele20 Sample crystallinity was calculated using peak separation technique supported by software Jade.Reference Ming and Hua21 The polished and etched surfaces of the sintered samples were examined using field emission scanning electron microscopy (FE-SEM) (S-4700, HITACHI, Japan). The temperature dependence of dielectric constant was measured using a LCR meter (E4980A, Agilent, Santa Clara, CA) in the frequency of 10 kHz and in the temperature range of −150 to 120 °C. Complex impedance spectrum was carried out by a LCR meter (E4980A, Agilent, Santa Clara, CA) over frequencies from 150 Hz to 2 MHz in a temperature range of 420–490 °C with an AC electric field of 4 V/mm. The DC dielectric BDS measurement was performed using a voltage-withstand testing device (ET2671B, Entai, Nanjing, China) at room temperature. All samples were ground into about 0.15 mm thick and immersed in silicone oil to prevent surface flashover. Eight specimens were used for each group during BDS testing.
III. RESULTS AND DISCUSSION
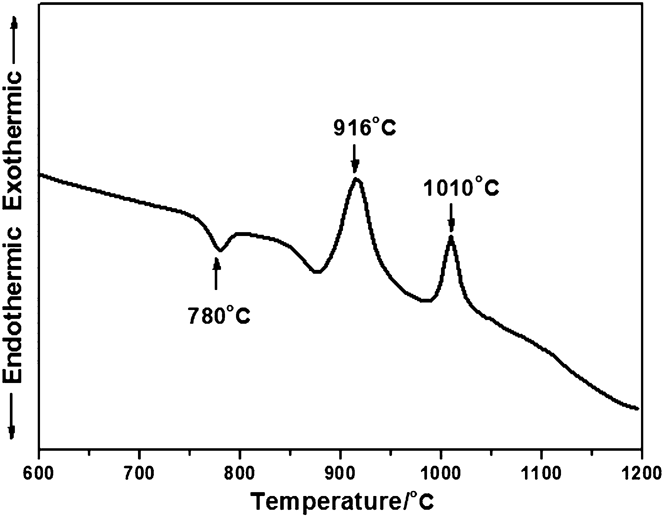
Figure 1 shows DSC traces for the BST glass. In the DSC curve, there is an endothermic peak at about 780 °C (corresponded to the glass softening) and two exothermic peaks at about 916 and 1010 °C. The first exothermic peak corresponded to the crystallization of the perovskite phase (BST),Reference Herczog4,Reference Takahashi, Nakano and Kageyama22 while the second peak corresponded to the crystallization of BaAl2Si2O8, SrAl4O7, and SiO2.Reference Chen, Zhang, Deng, Dai and Li2,Reference Gorzkowski, Pan, Bender and Wu3,Reference Capron and Douy23 To make the BST crystallize sufficiently, the temperature of 950 °C (slightly higher than 916 °C) was chosen to investigate the crystallization behavior of the glass-ceramics.
DSC curves of BST glass.

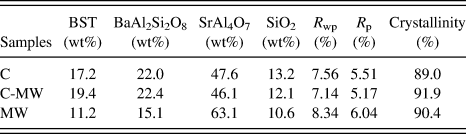
Figure 2 shows the typical XRD patterns of BST glass-ceramics prepared via C, C-MW, and MW routes, which indicated that the BST, BaAl2Si2O8, SrAl4O7, and SiO2 co-existed in the samples. It should be noted that the exothermic peaks would shift to the lower temperature as the heating rate decreased.Reference Gorzkowski, Pan, Bender and Wu3 In this study, the DSC measured at the heating rate of 10 °C/min, while the samples C and C-MW crystallized at 3 °C/min. We should also take into consideration that microwave heating can enhance the reaction kinetics compared to the conventional route.Reference Vaidhyanathan, Agrawal and Roy11 Therefore, the BaAl2Si2O8, SrAl4O7, and SiO2 can be crystallized at 950 °C under the current experimental condition. By applying the Rietveld refinement, we obtained the weight fraction of the four phases as well as the crystallinity of the samples (see Table I). During the Rietveld refinement, the amorphous phase was treated as the background. The parameters refined included the 2θ zero, scale factor, 18 polynomial background parameters in a shifted Chebyshev model, phase fractions, profile, lattice, thermal parameters, and cation site occupancies. By comparing the results of the nominal chemical composition of the glass and the phase composition determined from Rietveld refinement, it was shown that the two results coincided with each other well. Figure 3 shows the fit of measured XRD pattern of the samples by using the GSAS software. Table I shows that the crystallinity of the three samples was very similar being around 90 wt% for all the three adopted thermal treatments. From the results, it can be seen that the amount of the phase SrAl4O7 increased obviously for the sample MW when compared with the samples C and C-MW. The results indicated that the microwave process preferred the crystallization of SrAl4O7 [orthorhombic, Cmma, a = 8.085(5), b = 11.845(8), c = 4.407(3) Å]. As was reported,Reference Oghbaei and Mirzaee24 compared with the conventional route, microwave processing can decrease the reaction temperature. So, for the microwave process, the same temperature of 950 °C was high enough to crystallize SrAl4O7 (the crystallization peak was at 1010 °C, as seen in Fig. 1) more fully.
XRD patterns of the samples prepared via C, C-MW, and MW routes.
Refinement results of XRD data for the samples.
Rietveld refinement of the samples prepared via C, C-MW, and MW routes.
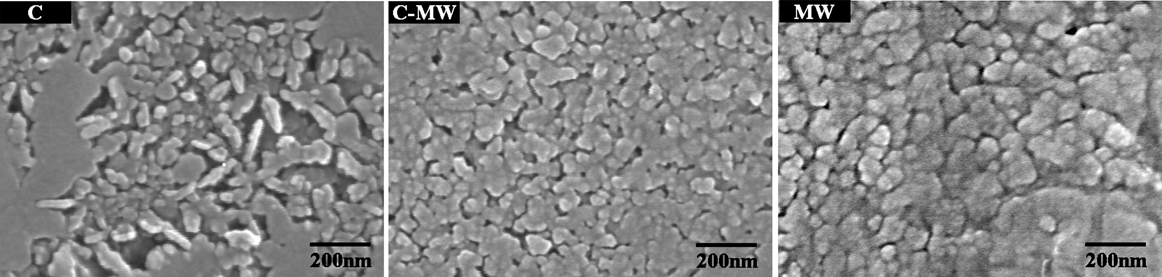
The FE-SEM micrographs are shown in Fig. 4. It can be seen that the various grains were surrounded by glass matrix. A mixture of various grain sizes was evident for the sample crystallized by microwave route (sample MW), which exhibited larger grain size than that crystallized by conventional route (sample C). Additional 2-min microwave treatment (sample C-MW) resulted in a slight increase of the grain size. This indicated that microwave processes can promote the growth of the grains. Furthermore, a typical dendritic structure was observed in sample C. However, the dendritic structure in sample C-MW was unobvious, and it did not exist at all in the sample MW. The results indicated that microwave processes can restrain the formation of the dendritic structure and provide a way to modify the microstructure of the resulting glass-ceramics.
FE-SEM micrographs of the samples (the samples were etched by hydrofluoric acid).
The dielectric-temperature characteristics of the glass-ceramics measured at 10 kHz are illustrated in Fig. 5. The temperature of ferroelectric–paraelectric phase transition for samples was lower than −150 °C. Obviously, the dielectric constant can maintain good stability within a wide range of temperatures, and the dielectric loss (tanδ) was lower than 0.02. It can be seen that the dielectric constant of the sample crystallized by microwave route (sample MW) was higher than other samples (sample C and C-MW), which was probably ascribed to the effect of interfacial polarization or space charge. As known,Reference Ran, Wen and Wen-zhong25,Reference Hu and Liu26 except BST, the dielectric constant of other phases was less than 10. From the analysis of the phase composition, the amount of the phase SrAl4O7 increased obviously for the sample MW, which would reduce the dielectric constant. So, the effect of interfacial polarization or space charge played a more important role than the increasing of SrAl4O7 amount on the dielectric constant of the sample MW.
Temperature dependence of dielectric constant and dielectric loss (tanδ) of the samples (measurement frequency was 10 kHz).
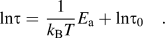
Impedance analysis was used to analyze the effect of microwave processes on the dielectric properties of the glass-ceramics. The samples were measured at different temperatures to get a series of Cole–Cole images and −Z″ spectroscopic plots. The characteristic impedance spectra for the sample MW are shown in Fig. 6 (sample C and sample C-MW are not presented). It can be seen that the impedance semicircles became smaller and the relaxation frequency at the extreme point of −Z″ spectroscopic plot increased with the increasing of measuring temperature. The observed dielectric relaxation of this sample at low frequency and high measuring temperature was correlated with the thermally activated motions of defect due to Maxwell–Wagner interfacial relaxation arising from the interfaces between the grains and the glass matrix.Reference Huang, Zhang, Ma, Li and Zhang1 Details of the impedance analysis and the activation energy (E a) can be found elsewhere.Reference Huang, Zhang, Ma, Li and Zhang1,Reference Wang, Zhang, Song, Yuan, Ma, Zhang, Deng and Liang27–Reference Barsoukov and Macdonald29 The lnτ − 1000/T curves can be obtained from Fig. 6, which obey Arrhenius relationship:
−Z″ spectroscopic plots at various temperatures for the sample MW. Inset: the complex impedance spectra measured at various temperatures.
 $${\rm{ln\tau }} = {\rm{}}{1 \over {k_{\rm{B}} T}}E_{\rm{a}} + {\rm{ln\tau }}_0 \quad .$$
The values of E a for the samples can be calculated from the slope of the function between relaxation time (the reciprocal value of the relaxation frequency) and measuring temperature, which is shown in Fig. 7. And a lower value of E a represented better charge spreading behavior.Reference Huang, Zhang, Ma, Li and Zhang1 In this study, the associated relaxation processes originated from space charge at grain boundaries. As seen from Fig. 7, the grain boundary activation energy of the glass ceramics was decreased to 1.48 and 1.95 eV by the microwave crystallization (sample MW) and additional 2-min microwave treatment (sample C-MW), which should be attributed to the microstructure improvement. For the sample C, the dendritic microstructures may create a high field concentration at the tips of the dendrites,Reference Gorzkowski, Pan, Bender and Wu30 which corresponded to the high activation energy. It was reported that the microwave can directly influence the ion transport during a high temperature sintering process, which concentrate the lattice defects and enhance ion mobility at the interface, then the ion transport can be greatly improved in a short time.Reference Whittaker31 So, the microwave treatment can modify the microstructure, which was consistent with the FE-SEM results (Fig. 4).
Relaxation time as a function of 1000/T for different samples. E a: the activation energy. The solid lines were linear fits through the data.
Figure 8 illustrates the Weibull distribution of the BDS for the BST glass-ceramics. The Weibull distribution has been found to be appropriate for the BDS analysis, both in theory and in practice, and was described in detail elsewhere.Reference Chen, Zhang, Deng, Dai and Li2,Reference Young, Hilmas, Zhang and Schwartz32 As reported before,Reference Gorzkowski, Pan, Bender and Wu30 dendrite formation was deleterious to the desired properties, especially the BDS. Clearly, the BDS of the sample crystallized by microwave route (sample MW) was much higher than that crystallized by conventional route (sample C). In addition, the BDS of sample C-MW by combining the conventional crystallization with microwave treatment can reach 900 kV/cm. For the sample MW, the improvement of the BDS was primarily ascribed to a trade-off between the growth of grain size and the inexistence of dendrites, which was consistent with the microstructure. Previous studies reported that the increase of grain size went against the improvement of the BDS.Reference Young, Hilmas, Zhang and Schwartz33,Reference Beauchamp34 For the sample C-MW, the improvement of the BDS was mainly due to the modified microstructure, whose dendrites were unobvious (shown in Fig. 4).
Weibull plots of dielectric BDS (E b) of the samples. X i = ln(E i), Y i = ln(−ln(1 − i/(n + 1))), E i is the specific BDS of each specimen, n is the sum of specimens of each sample, and I is the serial number of specimen.
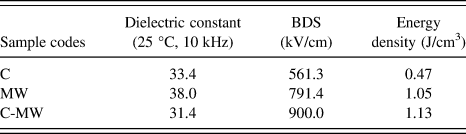
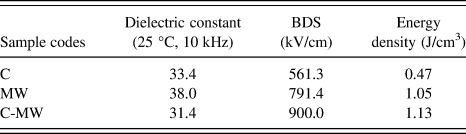
The calculated energy densities (D =  ${1 \over 2}$ε0εrE b2) of the glass-ceramics are compared in Table II. As derived from the discussion above, the energy density of the selected material can be improved significantly by controlling microwave treatment.
Comparison of relevant dielectric properties and energy densities of the samples.
IV. CONCLUSIONS
The microstructure and energy storage properties of BST-based glass ceramics were investigated as a function of the different crystallization routes by XRD, FE-SEM, and dielectric properties. Furthermore, the quantitative analysis was performed by applying the Rietveld refinement. The results revealed that the microwave heat treatment preferred the crystallization of SrAl4O7, which was unfavorable to the dielectric properties. Importantly, it can promote grain growth and modify the microstructure, which led to the reduction of the grain boundary activation energy and improvement in the BDS. The results suggested that microwave processes can effectively improve the storage energy density of the BST-based glass-ceramic.
ACKNOWLEDGMENT
The authors would like to acknowledge the support from National Key Fundamental Research Program (2009CB623302).