1 Introduction
A reverse mortgage is a loan available to seniors to convert home equity to cash or lifetime income. The elderly borrow money against the value of their home equity and retain full ownership of the home for the whole life of the loan. No repayments of interest or principal are required until the last survivor dies or leaves home (for example, to move to a long-term care facility) permanently. At that time, the mortgaged home is sold and the proceeds from the sale are used to repay the loan. Usually, a reverse mortgage includes an embedded guarantee which ensures that the borrower will not have to pay back any more than the value of the mortgaged home if it is less than the amount owing on the loan. This guarantee is called the No-Negative-Equity-Guarantee (NNEG) in the UK and the non-recourse provision (NRP) in the US. We will use the NNEG acronym here to refer to the guarantee whether in the UK or US context.
From the lender's viewpoint, the inclusion of the NNEG is the same as writing a put option on the mortgaged home with the strike price being the outstanding balance of the loan when the loan is terminated. Termination occurs when the property is vacated, or on earlier prepayment. The payoff from the guarantee is determined by the interest rate on the loan, the house price appreciation rate, and the termination date. In this paper, we specifically focus on the uncertainty associated with the termination date. This uncertainty is critically important, because the longer the loan continues, the more likely that the outstanding balance will exceed the net house value. From an option valuation perspective, the strike price is increasing at the interest rate on the loan, which is greater than the risk free rate. In this case, the value of the put option is an increasing function of the term. We therefore require a model for reverse mortgage terminations to value the contract, and to better understand the risks and impact of borrower behaviour.
Currently, multivariate regression models are used for reverse mortgage terminations in the US. The method was originally suggested by Chow et al. (Reference Chow, Szymanoski and DiVenti2000), and was adapted by the US Department of Housing and Urban Development (2003) and Rodda et al. (Reference Rodda, Lam and Youn2004). Regression models provide a good fit to the actual termination rates before age 90. However, because they are regression-based, they require substantial economic and non-economic information about the borrowers as input. Another problem of these models is that they assume the probability of loan termination remains level after age 90; this is counter-intuitive, and, because there is substantial longevity risk inherent in the guarantee, appears to be a significant weakness. Furthermore, these models do not make explicit allowance for moveouts, health or non-health related.
In this paper, we use a multiple state model to model reverse mortgage terminations. Multiple state models are extensively used in analyzing longitudinal failure times, particularly in the modelling of dependent failures. They have also been used by actuaries in a wide range of applications; see Dickson et al. (Reference Dickson, Hardy and Waters2009) for examples. Pertinent to this work, Rickayzen & Walsh (Reference Rickayzen and Walsh2002) use a multiple state model to project the number of people with disabilities in the UK over a period of 35 years. In this paper we utilize and extend the semi-Markov model of Ji et al. (Reference Ji, Hardy and Li2011), which describes the dependence between the lifetimes of a husband and wife.
The model proposed in this paper explicitly incorporates three different modes of termination: death, entrance into a long-term care facility, and voluntary prepayment. In addition, the event-triggered dependency between the lifetimes of a husband and wife is modelled. This feature is of practical importance, because a significant proportion of reverse mortgages are issued to couples (around 40% in the US, according to the US Department of Housing and Urban Development, 2008). The model would also offer a more sophisticated approach to reverse mortgages purchased by widows/widowers.
The rest of this paper is organized as follows: in Section 2 we provide some background information regarding reverse mortgages in the UK and US, and describe the guarantees embedded in the reverse mortgages sold in these two countries. In Section 3 we first discuss different modes of reverse mortgage termination, and then describe the semi-Markov multiple state model which we use for modelling these modes of termination. Section 4 applies the model to roll-up mortgages sold in the UK, and examines the importance of each mode of termination to the value of the embedded guarantee. Section 5 applies the proposed model to HECMs sold in the US, and analyzes the adequacy of the guarantee premiums that are currently charged. Finally, Section 6 concludes the paper.
2 Reverse Mortgages in the UK and US
2.1 Contract Design
Reverse mortgages are available in many countries, including the UK, the US, India, Australia, and Japan. In this paper, we consider specifically roll-up mortgages in the UK, and Home Equity Conversion Mortgages (HECMs) in the US for illustrative purposes. Below we provide some background information about these two types of reverse mortgage.
In the UK, there are different ways for older home owners to release the equity that has been built up in their home. One approach is to use a home reversion, which is not a mortgage but a sale with conditions. Under a home reversion contract, the homeowner sells all or part of his/her property to the provider for an agreed amount, but retains the right to live in the property rent-free until death. Another method is the lifetime or reverse mortgage, which permits homeowners to borrow money against the value of their home equity and retain full ownership of the home for the whole life of the loan. Depending on how the loan is taken and repaid, lifetime mortgages are divided into finer classifications. In this paper, we consider roll-up mortgages, also called fixed interest lifetime mortgages, which may be regarded as the most straightforward type of lifetime mortgages. Other types include interest-only, and drawdown mortgages. We refer interested readers to the Institute of Actuaries (2005a) for further details.
In a typical roll-up mortgage, the homeowners are advanced a lump sum of money at the outset, and interest on the amount advanced is compounded at a fixed rate. The principal and interest are repaid from the property sale proceeds when the last survivor dies, sells the house, or moves into a long-term care facility permanently. The loan may also be prepaid without a house sale.
Given that the value of the property when the loan is repaid is uncertain, a shortfall in the proceeds from the sale of the home relative to the outstanding mortgage is possible. However, most roll-up mortgages in the UK are sold with the NNEG, which protects the borrower by capping the redemption amount of the mortgage at the lesser of the face amount of the loan and the sale proceeds of the home. Because the interest rate is fixed, borrowers have a financial incentive to repay the loan and refinance when interest rates decline.
In the US, HECMs are the most popular reverse mortgage product, accounting for about 90% of the market share. HECMs are sold to US homeowners who are no younger than 62 years old. In contrast to roll-up mortgages in the UK, HECMs can be originated with either a fixed or an adjustable interest rate. Fixed-rate HECM borrowers will receive a closed-end loan and will not be able to prepay the loan or draw any additional funds, while variable-rate HECM borrowers can choose to receive payments in the form of a line of credit. Variable-rate HECMs are usually linked to the rate on one-year Constant Maturity Treasury (CMT) bills or the one-year London Interbank Offered Rate (LIBOR).
Recently, HECMs went through many changes, some of which were driven by Fannie Mae's policy on purchasing HECM loans. Fannie Mae discontinued offering commitments to purchase CMT-indexed HECMs in September 2009. Since then, this largest investor in the US reverse mortgage market has offered commitments to purchase monthly adjustable-rate LIBOR-based HECMs and fixed-rate HECMs instead. As a result, we have seen a shift of new adjustable-rate HECM loans from CMT-indexed to LIBOR-indexed, and an increased popularity of fixed-rate HECMs. Another major change to the HECM program was the introduction of two contract types, the HECM Standard and the HECM Saver, in October 2010.
All HECMs are insured by the Federal Housing Administration of the US Department of Housing and Urban Development. The purposes of this insurance are twofold. The first is to ensure that borrowers will receive cash advances in a timely manner even if their lender becomes bankrupt. The second is to protect lenders from losses if the price of the mortgaged home falls below the loan balance. In this connection, such insurance may be viewed as an embedded guarantee that is similar to the NNEG in the UK.
Each HECM borrower is required to pay a mortgage insurance premium, which covers the NNEG and the protection against the lender's default. The premium for the HECM Standard is a front-end charge of 2% of the maximum claim amount,Footnote 1 plus a monthly charge of 1/2 of 1.25% of the outstanding loan balance. The monthly premium for the HECM Saver is the same as that for the HECM Standard, but the front-end charge for the HECM Saver is only 0.01% of the maximum claim amount. The front-end charge is lower, because the maximum amount that can be borrowed via the HECM Saver is lower.
2.2 The Embedded Guarantee
We let Lt and Ht be the time-t values of the loan and the mortgaged home, respectively. Suppose that the loan is due at time t. If Ht ≥ Lt, then the lender will obtain the entire value of the loan, Lt, and the balance of the property price passes to the borrowers or their estate. If Ht < Lt, then the lender will obtain only Ht through the NNEG. Mathematically, the repayment to the lender is given by

which is the loan value less the payoff from the guarantee. Note that  is precisely the payoff function for a European put option with a strike price Lt.
The embedded guarantee prevents the borrower from owing more than the value of the mortgaged home when the loan is repaid. The risk that the loan exceeds the home value is borne by the lender (for roll-up mortgages in the UK) or the Federal Housing Administration (for HECMs in the US). This risk is sometimes referred to as the crossover risk.
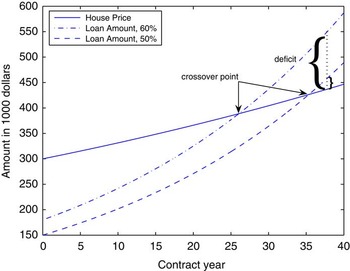
Let us use a simple roll-up mortgage to illustrate the crossover risk. Assume that the initial value of the mortgaged home is $300,000 and that the loan-to-value ratio is 50%. Given the hypothetical trajectory shown in Figure 1 (lower dashed line), the crossover occurs in about 35 years from now. If the loan is repaid after the crossover, the lender is subject to a loss. If a higher loan-to-value ratio, say 60%, is assumed, the crossover will occur sooner (upper dashed line).
Demonstration of the crossover risk.

From Figure 1 we observe that the crossover risk is affected by the loan-to-value ratio and the interest rate at which the loan is accumulated. The risk is also affected by stochastic factors including the appreciation of house prices and the timing of repayment. Some research on the appropriate model for house prices exists (see, for example, Li et al., Reference Li, Hardy and Tan2010). The focus of this work, though, is the timing of the repayment date, basing the modelling on the semi-Markov model we describe in the following section.
The embedded guarantee can be valued by either market consistent methods or real world methods. When a market consistent method is used, we first calculate the expected payout from the guarantee on the basis of a house price process under a risk-neutral probability measure, and then discount the expected payout to time 0 at the risk-free interest rate. By contrast, when a real world method is used, the distribution of discounted payouts is calculated from a process in the real world probability measure, and the value is determined from the distribution, using an appropriate statistic to allow for non-diversifiable risk. A drawback of real world methods is that the choice of statistic is subjective. In this study, we use a market consistent method, which is more objective, and follows Li et al. (Reference Li, Hardy and Tan2010) and Chen et al. (Reference Chen, Cox and Wang2010).
3 A Semi-Markov Multiple State Model
3.1 Modes of Termination
A reverse mortgage may terminate for various reasons.
• Mortality
Death is a major mode of termination. It is the main termination mode at oldest ages.
• Entrance to a long-term care (LTC) facility
Similar to mortality, health-related moveouts play a predominant role when the homeowner becomes old.
• Moveout for non-health reasons
A homeowner may move out of his/her mortgaged home permanently for a non-health reason, for example, downsizing.
• Refinancing
A reverse mortgage may be repaid because of a change in the borrower's financial circumstances. For UK fixed interest mortgages, voluntary prepayments may come from refinancing, when the market interest rate is lower than the fixed interest rate at which the loan is accumulated. In the US, refinancing may arise if the younger spouse dies, as the maximum loan to property ratio is determined as a function of the age of the younger surviving spouse, and may rise on their death.
3.2 Model Specification
We propose a semi-Markov multiple state model for the terminations. By semi-Markov we mean the transition probability depends not only on the current time and state, but also on the time since the previous transition.
Our model is built upon the work of Ji et al. (Reference Ji, Hardy and Li2011), who proposed a semi-Markov multiple state model to capture the effect of bereavement.Footnote 2 In that paper, the force of mortality after bereavement is specified by the following parametric functions:
• widows, age x, t years since bereavement:

• widowers, age y, t years since bereavement:

where λ represents the force of mortality from “common shock” events (events that would cause simultaneous mortality of both lives), and  and
 represent the force of mortality for married women and men, respectively, from all causes other than common shock; a m, a f, k m, and k f are the semi-Markov parameters.
The model assumes that the force of mortality for an individual after bereavement is proportional to the corresponding force of mortality if his/her spouse is still alive. Initially, bereavement increases the force of mortality by 100a f% for females and 100a m% for males. The multiplicative factors F f(t) and F m(t) decrease exponentially as t increases and finally approach 1. Parameters K f and K m govern the speed at which the selection effect diminishes. Further details about this model are given in Ji et al. (Reference Ji, Hardy and Li2011).
As in Frees et al. (Reference Frees, Carriere and Valdez1996), we graduate  and
 by two Gompertz curves. However, the dependence between lifetimes is captured by a semi-Markov structure, which differs from the parametric copula approach of Frees et al. (Reference Frees, Carriere and Valdez1996).
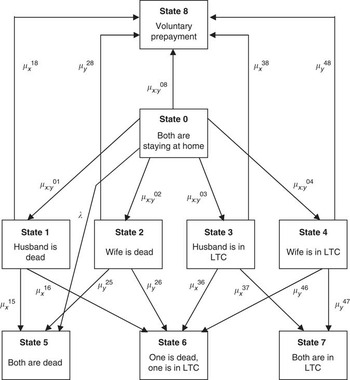
In this paper, the semi-Markov model is extended to incorporate additional modes of decrement. The complete specification of our proposed model is shown diagrammatically in Figure 2. The boxes represent the state process during the lifetime of a reverse mortgage. All joint life mortgages start in State 0. If the process is still in State 0 at time-t, that means that both husband and wife are alive at t. In States 1 to 4, only one of the joint borrowers is still living at the mortgaged home. In States 5 to 8, the last survivor has either died or permanently left the mortgaged home, and the reverse mortgage is terminated on the transition to any of those states.
A multiple state model for joint-life reverse mortgages.

The arrows between the states represent the possible transitions, indicating how a reverse mortgage may be terminated. Our model permits transitions from State 0 to 5. This feature captures the simultaneous dependence between joint lifetimes due to common shocks. Transitions from State 0 to 7 are not permitted; this means we do not capture simultaneous move into long-term care of the joint mortgagors, although we could easily relax this assumption. For convenience we allocate the two non-health related terminations, moveout for non-health reasons and refinancing, to one single state, State 8, labelled as voluntary prepayment.
We assume that once a borrower moves into a LTC facility, the lender will no longer follow the borrower's status. This assumption means that, for example, the label ‘Husband is in LTC’ for State 3 also includes the case where the husband moved to LTC and then died, and the wife is still living in the home. We assume implicitly that death after moving to LTC does not impact the mortality or moveout probability of the survivor who remains in the home. This, too, is an assumption that could be easily relaxed, particularly if there were data available to support a different assumption.
Following Ji et al. (Reference Ji, Hardy and Li2011), a semi-Markov approach is used to model the effect of bereavement on mortality. Specifically,  and
 are obtained by multiplying F f(t) and F m(t), respectively, with the corresponding pre-bereavement force of mortality.
Let x and y denote the age of a wife and husband, respectively. The forces of transition from State 0, in which both borrowers are living in the mortgaged home, are denoted by  , for i = 0,1,2,3,4,8. A slightly different notation is used when there is only one person living in the mortgaged home, as we assume the age of each partner is only relevant while that person is still in the home. For example, we use
 to denote the transition intensity for a widow of age x from State 1 to 5. The age of her husband is not included in the notation as it is irrelevant to the calculations.
We denote the probability of transition from State 0 to State i at time t by  . Since all transitions are unidirectional, it is straightforward to calculate the transition probabilities using Kolmogorov's forward equations. For example, we have

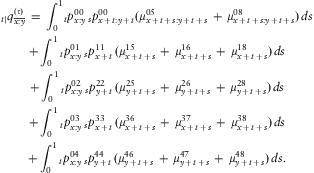
We let  be the probability at time 0 that a reverse mortgage issued to a wife aged x and a husband aged y at time 0, is terminated between time t and time t + 1. This deferred aggregate one-year termination probability is of particular interest, because the simulation studies in later sections are conducted in annual time steps. We can calculate
 by the following sum:
For simplicity, we do not make any allowance for mortality improvements. In practice, one may incorporate mortality improvements by modelling the evolution of  over time by, for example, the Lee-Carter model (Lee & Carter, Reference Lee and Carter1992). See Li et al. (Reference Li, Hardy and Tan2010) for the impact of longevity risk in the single life, single termination mode case.
4 Valuing NNEGs in the UK
4.1 The Pricing Formula
Let us define the following notation:
• r: the continuously compounded risk-free interest rate;
• g: the continuously compounded rental yield;
• u: the continuously compounded roll-up interest rate on the loan;
• Lt: the value of the reverse mortgage loan at time t, excluding NNEG;
 ;
• Ht: the value of the mortgaged property at time t;
• δ: the average delay in time from the point of home exit until the actual sale of the property.
• c: the cost (as a percentage of the property value) associated with the sale of the property;
• ω: the highest attained age;
•
: the time-zero value of a put option on an asset with initial value S 0, volatility σ and dividend yield g; the option matures at time t and has a strike price K.
 ;
 : the time-zero value of a put option on an asset with initial value S 0, volatility σ and dividend yield g; the option matures at time t and has a strike price K.
We use annual time steps and assume that all decrements occur at mid-year. Then the value of a NNEG written to a wife age x and a husband age y can be expressed as

where  is the probability that the loan is terminated between year t to year t + 1. This probability is calculated on the basis of the semi-Markov multiple state model.
In our illustrations we assume that property prices follow a geometric Brownian motion (GBM). This is the same assumption used in Institute of Actuaries (2005b). This simple model does not incorporate features such as autocorrelation, which has been found to be significant in UK house price returns (see, e.g., Hosty et al., Reference Hosty, Groves, Murray and Shah2007). A more realistic econometric model may be used, but we do not explore this aspect of the problem. We refer readers to Li et al. (Reference Li, Hardy and Tan2010) for more discussion of house price modelling.
With the GBM assumption,  can be calculated by the Black-Scholes formula:

where 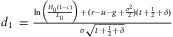 , and
 .
In practice, the roll-up rate u is greater than the risk-free interest rate r. When u>r, the value of  will be a strictly increasing function of t. Therefore, decrement assumptions play a critical role in valuing the guarantee.
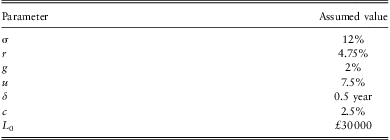
The assumed parameter values are summarized in Table 1. They are the same as those used in the analysis by the Institute of Actuaries (2005b). The estimate of σ is the sum of two components: an annualized volatility of 9% per annum, derived from the Nationwide Building Society all-UK House Price Index from January 1984 to December 2003; a provision of 3% per annum for the fact that regional variations in volatility are greater than those for the UK as a whole, and the fact that individual house price movements will display greater volatility.
Assumed values of the parameters in the NNEG pricing formula.
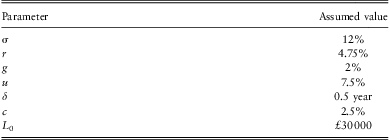
The initial house value H 0 is the minimum assumed starting property value required for a loan of L 0 = £30 000 (see Table 2). Note that the value of H 0 is negatively related to the age of the younger spouse at inception – older lives may borrow more, because of the reduced crossover risk.

4.2 The Impact of Mortality
Here we examine the impact of mortality assumptions on the value of a NNEG. For now we assume that death is the only mode of decrement.
Our analysis is based on the joint-life mortality data considered by Frees et al. (Reference Frees, Carriere and Valdez1996), Youn & Shemyakin (Reference Youn and Shemyakin1999), and Ji et al. (Reference Ji, Hardy and Li2011). The data comprise 14,947 records of joint and last-survivor annuity contracts written by a large insurance company in Canada. It seems reasonable to assume that annuitants and people who participate in reverse mortgages will have similar mortality profiles.
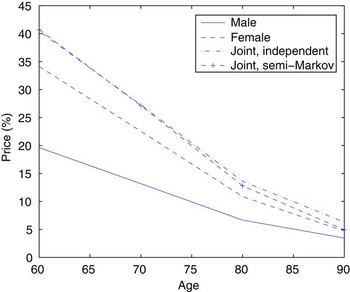
First we price guarantees written to single lives. Using the joint-life mortality data, we estimate the marginal survival distribution for each gender. Termination probabilities for all durations are calculated accordingly and are substituted into equation (2) to obtain the guarantee value. The relationship between the value of the guarantee and the age at inception is depicted in Figure 3. The guarantee values for females are higher than the corresponding values for males, because female mortality is generally lighter than male mortality.
Simulated NNEG prices (as a percentage of cash advanced), single lives and joint lives with a 2-year age gap.

Next we price guarantees written to joint lives. To examine how the value of a NNEG may be affected by the dependence between two lifetimes, we use two different assumptions. First, we assume independence between the lifetimes of the husband and wife, and use the marginal distributions. Secondly, we use the semi-Markov multiple state model (with States 0, 1, 2, and 5), which is fitted to the same data set. We use simulation (with 100,000 projections) to estimate aggregate termination probabilities, which are then applied to equation (2) to obtain the guarantee value.
In Figure 3 we show the guarantee values calculated with both assumptions. For joint lives, the x-axis in the diagram corresponds to the age of the wife, who is assumed to be two years younger than the husband. From the diagram we observe that the assumption of independence generally leads to an overestimation of NNEG prices. The overestimation is more significant at high ages. This may be explained by the semi-Markov property, which allows widows and widowers to recover from bereavement. In particular, as younger widowed borrowers have time to recover, the impact of bereavement on the guarantee value is relatively low. The opposite is true for older widowed borrowers.
4.3 The Impact of Long-Term Care Incidence
We now study the impact of long-term care incidence on the value of a NNEG. The model used here is comprised of States 0 to 7 from Figure 2, assuming that mortality and entrance to a long-term care facility are the only two modes of termination.
Generally speaking, people living in long-term care facilities are less healthy than those remaining in their own homes. This means that the introduction of long-term care incidence to the model impacts the at-home mortality. Therefore, besides estimating the additional forces of transition, the forces of transition that are included in the model considered in Section 4.2 must also be re-estimated or at least adjusted.
We derive the required forces of transition by a proportional adjustment. Let  be the forces of mortality (from all causes other than common shock) for a wife of age x and a husband of age y, respectively (see Section 3.2). We model the forces of transition to a long-term care facility for males and females by
 , respectively. Males and females at-home mortality are obtained by multiplying their forces of mortality (from all causes other than common shock) with proportional factors
 , respectively.
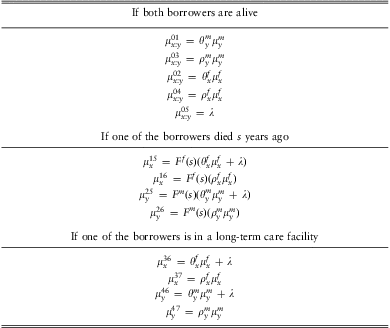
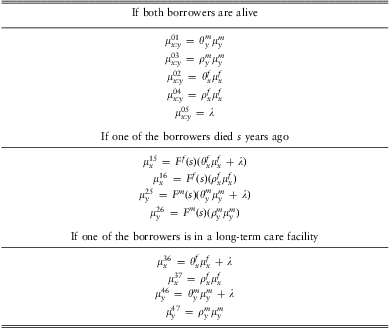
We assume that bereavement has an effect on the forces of transition from States 1 and 2. The forces of transition from these states are obtained on the basis of the semi-Markov functions F f(t) and F m(t) defined in Section 3.2. For instance, the force of transition from State 1 to 5 for a widow of age x, whose husband died s years ago, is given by  . The expressions for all forces of transition in the model are provided in Table 3.
Transition intensities for the model in Section 4.3.
To estimate the proportional factors for the move from an aggregate model to the at-home/in LTC split model, we make use of the findings in the Equity Release Report of the Institute of Actuaries (2005b). In the report, the following ratios are provided:
•
: long-term care incidence rate to population mortality rate (males, age y);•
: long-term care incidence rate to population mortality rate (females, age x);•
: at-home mortality to population mortality rate (males, age y);•
: at-home mortality to population mortality rate (females, age x).
 : long-term care incidence rate to population mortality rate (males, age y);
 : long-term care incidence rate to population mortality rate (females, age x);
 : at-home mortality to population mortality rate (males, age y);
 : at-home mortality to population mortality rate (females, age x).
Given these ratios, the proportional factors are calculated by solving the following equations numerically:




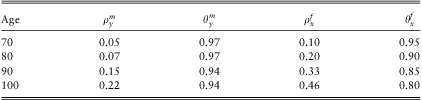
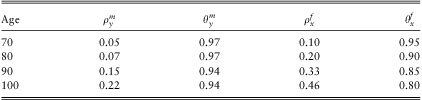
Note that in the equations above, it is assumed that the husband and wife are of the same age. In Table 4 we show the estimated proportional factors for ages 70, 80, 90, and 100. The proportional factors for ages 71–79, 81–89 and 91–99 are obtained by linear interpolation, while the proportional factors for ages below 70 and ages above 100 are set to the proportional factors for age 70 and age 100, respectively.
Estimated values of  .
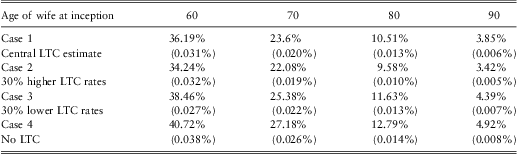
We then use the eight-state model to simulate prices of NNEGs written to joint-borrowers. To examine the impact of long-term care incidence on the NNEG prices, we consider the following four cases:
• Case 1: Central estimate of ρ.
• Case 2: ρ is increased by 30%, other things equal.
• Case 3: ρ is decreased by 30%, other things equal.
• Case 4: No long-term care incidence.
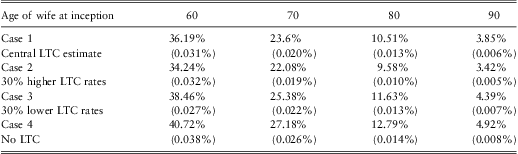
Table 5 shows the NNEG prices under the four assumptions about long-term care incidence. It is assumed in the calculations that the husband is two years older than the wife. When long-term care incidence is introduced to the model, the resulting guarantee value, expressed as a percentage of cash advanced, will decrease in absolute value by 1% to 4.5%, depending on the borrowers’ ages at inception. This indicates that entrance to a long-term care facility is a significant mode of termination, and that it requires adequate modelling.
Simulated NNEG prices as a percentage of cash advanced under different assumptions about long-term care incidence (standard errors in parentheses).
In expressing long-term care incidence rates as a fraction of the corresponding base mortality rates, we have implicitly assumed that the desire to move to a long-term care facility is determined by age-related health conditions only. However, other factors, for example, the quality of long-term care facilities, may also affect one's desire to move. If data permits, such factors may be incorporated into the model by modifying the expressions for the forces of transition accordingly.
4.4 The Impact of Voluntary Prepayment
We now consider the full nine-state model, which incorporates three modes of termination including voluntary prepayment. A roll-up mortgage may be prepaid voluntarily due to a non-health related moveout or refinancing.
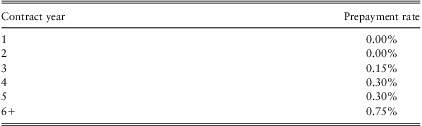
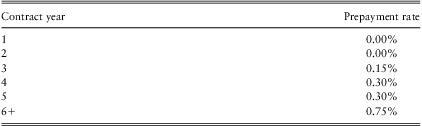
There is little information about non-health related moveouts available in the public domain. In our calculations, we use the assumptions made by the Institute of Actuaries (2005b), which are summarized in Table 6. The prepayment rates are rather low, because most equity release mortgages sold in the UK are transportable on moving home, subject to the loan-to-value ratio being no more than the maximum allowed. The initial selection effect is modelled by using lower rates for early contract years. We assume further that, after the fifth contract year, the rate of non-health related moveouts is reduced by 0.25% if both lives are still staying in the mortgaged property. This assumes that a borrower may have a greater desire to move out after his/her spouse has died.
Allowances for prepayments arising from changes in personal circumstances expressed as a percentage of in force contracts. Source: Institute of Actuaries (2005b).
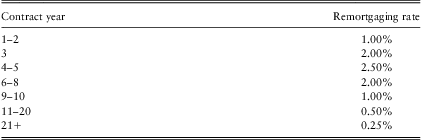
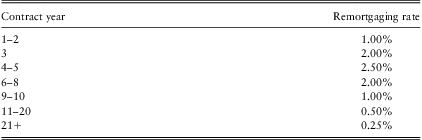
As the roll-up interest rate is usually fixed, borrowers may have a financial incentive to refinance when there is a fall in market interest rates. Here we use the remortgaging rates assumed by Hosty et al. (Reference Hosty, Groves, Murray and Shah2007), which they claim to be suitable for reverse mortgages sold at a time when interest rates are relatively low but not at the bottom of the marketFootnote 3. The assumed remortgaging rates are displayed in Table 7.
Assumed remortgaging rates. Source: Hosty et al. (Reference Hosty, Groves, Murray and Shah2007).
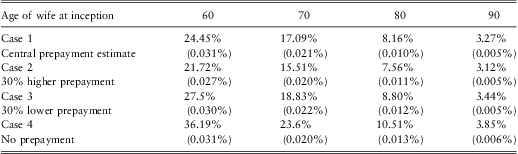
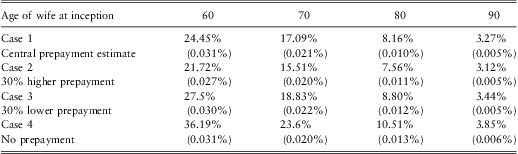
We incorporate these voluntary prepayment rates into the full nine-state model to price a NNEG. To examine the impact of the assumption, we consider four cases:
• Case 1: Central rates of voluntary prepayment based on the values in Tables 6 and 7.
• Case 2: The rates of voluntary prepayment are increased by 30%, other things equal.
• Case 3: The rates of voluntary prepayment are reduced by 30%, other things equal.
• Case 4: No voluntary prepayment.
The simulated NNEG prices for all four cases are shown in Table 8. It is assumed in the calculations that the husband is two years older than the wife. Note that the prices for Case 4 are taken from Section 4.3. From Table 8 we observe that the NNEG prices drop significantly when voluntary prepayment is taken into account. The effect of voluntary prepayment is even more significant than the effect of long-term care incidence.
Simulated NNEG prices as a percentage of cash advanced under different assumptions about voluntary prepayments (standard errors in parentheses).
The analysis shows that, using reasonable assumptions for the termination model, the impact of health and non-health related move-outs is very significant, and that the semi-Markov model offers a transparent and flexible approach to the modelling of terminations.
5 Valuing HECM Insurance Premiums in the US
5.1 The Pricing Formula
In this section, we use the model and parameters developed above to analyze the premium that US HECM borrowers pay for the NNEG. All HECMs sold in the US are insured by the Federal Housing Administration, with premiums paid by the borrowers. For a loan written to a wife of age x and a husband of age y, the time-0 value of the mortgage insurance can be expressed as follows:

where L 0 is the amount borrowed, including the origination costs and front-end mortgage insurance premium; H 0 is the adjusted property value when the loan is originated. We assume that H 0 is always smaller than the HECM maximum loan limit for the area in which the property is located. Other symbols in the above expression carry the same meaning as they do in Section 4.1. It is assumed in our calculations that all loans terminate at mid-year.
At present, there are two types of HECM loans, the HECM Standard and the HECM Saver, both of which require borrowers to pay mortgage insurance premiums monthly and up-front. The monthly premium for both contract types is 1/12 of 1.25% of the outstanding loan balance. The upfront premiums for the HECM Standard and the HECM Saver are 2% and 0.01% of the maximum claim amount, respectively. The HECM Saver requires less premium, because the maximum amount that can be borrowed via the HECM Saver is lower.
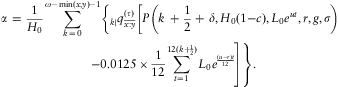
In what follows, we investigate whether the current front-end charges are appropriate. Let α be the fair front-end charge, expressed as the a percentage of the home value. The time-0 value of the total mortgage insurance premium can be expressed as

By actuarial equivalence, we have the following formula for calculating α:
Here we assume again that house prices follow a geometric Brownian motion.
When H 0 is smaller than the HECM maximum loan limit, the maximum amount that a borrower can borrow is the product of H 0 and the applicable principal limit factor, f, which depends on the expected interest rate and the borrower's age at inception. For example, if the applicable principal limit factor is 0.551 and the value of the mortgaged property is $100,000 at inception, then the maximum amount that can be borrowed would be $55,100, including the origination costs paid on the borrower's behalf.
Table 9 displays the principal limit factors for fixed-rate HECMs and variable-rate HECMs that are linked to the one-year LIBOR. These factors are obtained from the online reverse mortgage calculator provided on Wells Fargo Bank's websiteFootnote 4 on 22 April 2011. The calculations were based on zip code 90803 Los Angeles, which has the highest number of HECM loans. Our calculations will be based on these principal limit factors.
Principal limit factors for HECM loans in 90803 Los Angeles.

Fixed-rate HECM borrowers will receive a closed-end loan of 100% of initial principal limit. They will not be able to prepay the loan or draw any additional funds. However, most variable-rate HECM borrowers do not use the full principal limit. According to the HECM Actuarial Review Report provided by IBM Global Business Services (2010), the line of credit option accounted for 91% of the 2009 book-of-business and 93% of the 2010 book-of-business. Although most variable-rate HECM borrowers use a sizeable amount of their lines of credit at the inception of the contract, they usually do not exhaust the line of credit during the term of the loan.
If the borrower withdraws 100φ% of the maximum amount that he/she can borrow, then L 0 in equation (6) can be expressed as φ f H 0. Furthermore, by substituting equation (3) into equation (6) and replacing L 0 with φ f H 0, we can show easily that α does not depend on H 0, if we assume house prices follow a geometric Brownian motion.
In our calculations, the following three values for the borrowing percentage are considered: φ = 100%, φ = 90%, and φ = 80%. The assumed values for other model parameters are described below.
• The house price volatility, σ, is 12%. This is the historical volatility of the Quarterly Purchase-only House Price Index from 1991 to 2008 provided by Office of Federal Housing Enterprise Oversight.
• The continuously compounded risk-free interest rate, r, is 3.43%. This is the rate on 10-year US Treasury Bills on 22 April 2011, obtained from the website of the US Department of TreasuryFootnote 5.
• For fixed-rate HECMs, the continuously compounded roll-up rate, u, is 4.94%. This is the roll-up rate for fixed-rate HECM loans written by Wells Fargos Bank in April 2011.
• For variable-rate HECMs, we set u = 4.97%. This is based on the sum of the average 1-year LIBOR over the period of May 2001 to April 2011Footnote 6 and the lender's margin charged by Wells Fargos Bank as of this writing.
As in pricing the UK NNEGs, we assume that g = 2%, c = 2.5%, and δ = 0.5.
5.2 Decrement Assumptions
When we apply the semi-Markov multiple state model to HECM insurance premiums, the following assumptions are used:
• Mortality and long-term care incidence
Central assumptions about mortality and long-term care incidence are the same as those used in Section 4.
• Refinancing
In contrast to roll-up mortgages sold in the UK, fixed-rate HECM loans do not permit refinancing. Variable-rate HECMs borrowers have rather low incentive to refinance, because rates on their loans are linked to the market interest rate. The current market practice uses the age of the younger spouse to determine the principal limit of the loan. Therefore, a variable-rate HECM borrower may remortgage when his/her spouse dies, as that may lead to an increase in the principal limit. However, such a refinancing arrangement would not affect the existing mortgage insurance. In this connection, refinancing is not considered when we compute HECM insurance premiums.
• Non-health-related moveouts
In a US-specific study on mobility, Zhai (Reference Zhai2000) argued that mobility is a combined result of increasing health-related and declining non-health-related moveouts, plus a static rate. Zhai went on to derive an U-shaped curve of mobility rates, which says that the rate of mobility (for both health and non-health related reasons) declines from 4.8% at age 60 to 3.2% at age 80, and then rises slowly to about 4.2% at age 105.
We set our assumptions about non-health related moveouts on the basis of the U-shaped curve provided by Zhai (Reference Zhai2000). In particular, since mobility at younger ages is mostly non-health related, we assume that the rate of non-health related moveout is 4% from age 60 to 65. This rate is linearly reduced to 1% for age 90 and above, when mobility is mostly health-related. Following Zhai (Reference Zhai2000), we discount the mobility rate by 50% when both borrowers are living in the mortgaged property.
We further model the effect of selection by applying an 80% discount to the mobility rate during the first contract year. The discount is reduced linearly to zero during the tenth contract year.
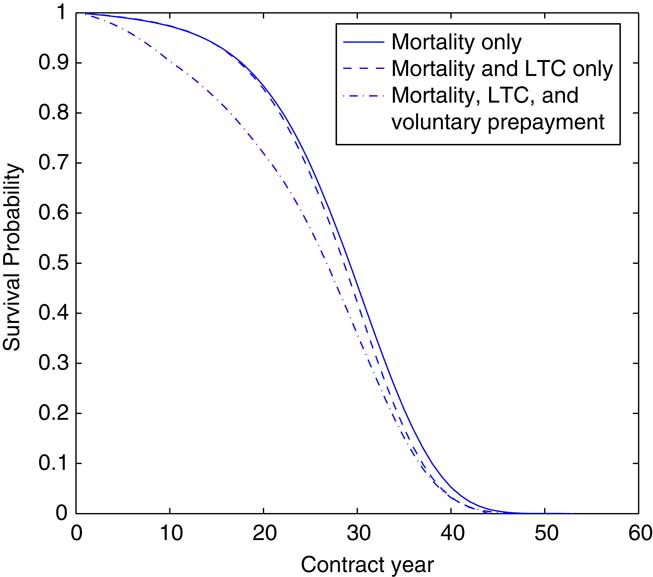
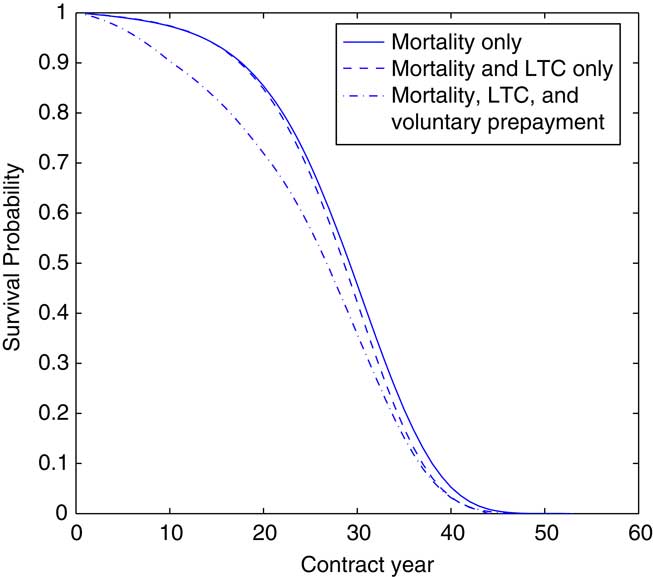
Having established the decrement assumptions, we can simulate the survival curve for a HECM contract. From the survival curve we can tell the probability that the HECM contract is still in force at a certain time after inception.
In Figure 4 we show the survival curves for a HECM contract written for a 62-year-old wife and a 64-year-old husband, when different modes of termination are incorporated into the model. We observe from the diagram that long-term care incidence and voluntary prepayments (non-health related moveouts) would significantly reduce the survival probabilities, thereby shortening the expected duration of the HECM contract.
Estimated survival curves for a HECM contract written to a 62-year-old wife and a 64-year old husband.
5.3 The Estimated Premiums
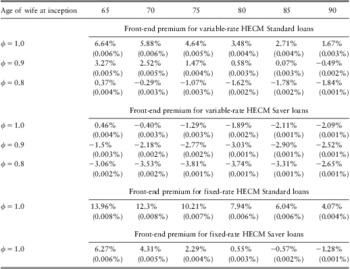
In Table 10 we display the estimated values of α, the front-end charge as a percentage of house value, for fixed-rate HECMs and for variable-rate HECMs under different levels of utilization. The calculations are based on 100,000 simulations from the multiple state model and the assumption that the husband is two years older than the wife.
Simulated front-end premiums (standard errors in parentheses) for fixed-rate HECMs and for variable-rate HECMs under different degrees of utilization.

We observe that the estimated fair front-end charge for a variable-rate HECM loan will drop significantly if the joint borrowers do not exhaust the available line of credit when the loan is originated. When 80% of the principal limit is advanced, the required front-end charges are negative in almost all cases we consider. This means that the monthly premium itself is more than enough to cover the cost of the embedded guarantee. Because the average drawdown rate is below 60% (IBM Global Business Services, 2010), variable-rate HECM loans are generally sustainable.
However, fixed-rate HECMs are a lot riskier, since borrowers must draw 100% of the principal limit. Our results indicate that the current front-end premium (2% for the HECM Standard and 0.01% for the HECM Saver) is insufficient to cover the cost of the NNEG. The problem of under-charging deserves attention, as fixed-rate HECMs are increasingly popular. According to IBM Global Business Services (2010), the market share of fixed-rate HECMs increased from 11% in 2009 to 69% in 2010. If the same premiums are charged, the principal limit factors must be lowered to reduce the underlying risk.
The simulation results point to two other important conclusions. First, since the estimated front-end charge decreases with the borrowers’ ages, older couples are subsidizing younger couples under the current premium structure. The problem could be ameliorated by using an age-dependent front-end charge, or an age-dependent principal limit factor, as this, according to our results, does not seem to undermine the long-term financial soundness of the HECM insurance fund.
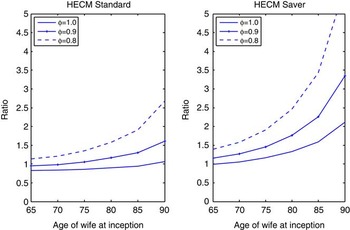
Secondly, the estimated front-end charge decreases dramatically when the utilization of the available line of credit is reduced. This implies that, under the current premium structure, borrowers who utilize a smaller portion of the available line of credit are subsidizing those who utilize more. This problem can be understood more easily from Figure 5, in which we plot, for three different degrees of utilization, the ratio of the total mortgage insurance premium to the time-0 value of the NNEG. A fairer premium structure would use a multiple of the loan utilised rather than the house value as the basis for the front-end charge.
Ratios of the total mortgage insurance premium to the time-0 value of the NNEG for variable-rate HECMs when different portions of the available line of credit are utilised.

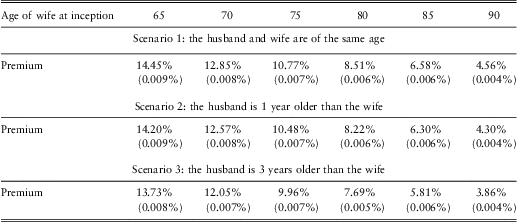
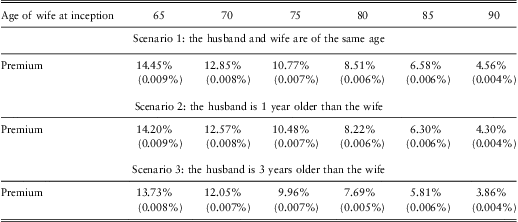
Finally, we calculate the front-end charge for fixed-rate HECM Standard loans for three typical age combinations: (1) the husband and wife are the same age; (2) the husband is 1 year older than his wife; (3) the husband is 3 years older than his wife. The calculations are based on 100,000 simulations from the termination model. The results, which are displayed in Table 11, indicate that the front-end charge is quite dependent on the age gap. This effect arises from the dependence among joint-lives, suggesting the advantage of using a joint-life termination model when valuing joint-life reverse mortgages.
Simulated front-end premiums (standard errors in parentheses) for fixed-rate HECM Standard loans for different age combinations.
The mortgage insurance premium should also cover the protection against the lender's default. As we do not incorporate this risk, the values derived from equation (4) can be regarded as lower bounds for the mortgage insurance premium. However, we believe that the cost of the credit risk is small relative to the cost of the NNEG. We note that there is no record of an HECM lender discontinuing its commitment to borrowers.
6 Concluding Remarks
In this paper, we have proposed a semi-Markov multiple state model for reverse mortgage terminations. The model incorporates not only multiple modes of decrement, but also the statistical dependence between the lifetimes of a husband and wife. This feature is particularly important for valuing joint-life reverse mortgages, which have become increasingly popular in recent years. Although the model is used in this paper only for estimating NNEG costs, it can be developed further for many of our purposes, for example, determining penalty charges (for UK fixed rate mortgages) and capital requirements.
Because most data on reverse mortgage terminations are proprietary, some proxy data and assumptions are used in our illustrations. Nevertheless, this does not affect our objectives, to demonstrate how the model can be used to determine a fair price for the NNEG, and to demonstrate the relative importance of different modes of termination. Reverse mortgage providers, who have access to their own decrement data, can easily adapt the multiple state model we propose to suit their own experience.
Readers should keep in mind that our conclusions on HECM mortgage insurance premiums are based on the interest rate and the principal limit factors as of this writing. When interest rates change, the principal limit factors, and hence the estimated mortgage insurance premiums, will change accordingly. It is important to take the change in interest rates, possibly through a stochastic interest rate model, into account when deciding a new premium structure. The use of a model such as ours to determine principal limit factors could improve the product design.
We repeat two caveats around the specific numerical results presented here. The geometric Brownian motion assumption for house prices, used here for tractability and to illustrate the application of the model, is probably too thin tailed. In practice, one may consider a house price model that permits autocorrelation and stochastic volatility. For example, Li et al. (Reference Li, Hardy and Tan2010) fit an ARMA-EGARCH model for house prices in the UK; Chen et al. (Reference Chen, Cox and Wang2010) use an ARMA-GARCH model for house prices in the US. Miles (Reference Miles2010) found that house price returns in the majority of UK regions exhibit GARCH effects. The use of such models will imply market incompleteness, which adds an extra challenge in the pricing process.
The loan interest rate is another variable that we have not explored extensively. It will, of course, affect how fast a floating rate loan is accumulated. It will also affect the guarantee values through the correlation with house prices, as we have observed painfully through the recent financial crisis. Furthermore, there will be dependence between these economic factors and the termination transition probabilities, especially for the non-health related terminations. For example, it is more likely that a borrower will move and repay his/her reverse mortgage in a booming economy. In a recession, homeowners may be less likely to choose the expensive option of long-term care. In future research, it would be interesting to integrate a stochastic interest rate model into the multiple state termination model, possibly through a regime-switching framework.