Introduction
Alzheimer's disease (AD) and dementia with Lewy bodies (DLB) are the most common forms of dementia affecting older adults. Patients with AD typically present with progressive episodic memory impairment, followed by global cognitive decline (Hodges, Reference Hodges2006). In contrast, DLB is characterized by fluctuating cognition, motor Parkinsonism, visual hallucinations, and prominent attentional and visuo-perceptual dysfunction (McKeith et al., Reference McKeith2005; Lippa et al., Reference Lippa2007). However, the conditions share similar features, making clinical diagnosis difficult. An accurate diagnosis of dementia is important in order to optimize patient care. This includes timely and appropriate provision of information and treatment. Structural imaging can potentially help improve diagnostic accuracy, and guidelines currently suggest that all patients should have neuroimaging as part of their diagnostic work up for dementia (Hort et al., Reference Hort2010).
In AD, the pattern of gray matter atrophy has been found to be predominantly temporo-parietal and, importantly, medial temporal lobe atrophy (MTA) has been included as one of the biomarker criteria in recently proposed revised diagnostic criteria for AD (Dubois et al., Reference Dubois2007; McKhann et al., Reference McKhann2011). DLB has been associated with generally less gray matter volume loss than in AD with relative preservation of the medial temporal lobe (MTL) structures, a feature which has been incorporated as a supportive feature in the revised consensus criteria for DLB (McKeith et al., Reference McKeith2005). Visual assessment of MTA using the Scheltens scale has consistently emerged as a robust, quick, and clinically applicable method of discriminating AD from both normal aging and other causes of dementia (Scheltens et al., Reference Scheltens1992; Burton et al., Reference Burton2009). It is a well-established scale that correlates with volumetric measurements and AD pathological burden (Burton et al., Reference Burton2009). However, normal MTA scores do not exclude the diagnosis of AD and MTA can occur in other dementias (Barber et al., Reference Barber, Gholkar, Scheltens, Ballard, McKeith and O'Brien1999; Bastos-Leite et al., Reference Bastos-Leite, Van Der Flier, Van Straaten, Staekenborg, Scheltens and Barkhof2007).
Another feature of AD is thought to be global cortical atrophy. Visually rating global cortical atrophy has been reported as being difficult due to poor levels of inter-rater reliability (Scheltens et al., Reference Scheltens, Pasquier, Weerts, Barkhof and Leys1997). AD has also been associated with changes in the posterior parietal area, particularly the precuneus and posterior cingulate (Galton et al., Reference Galton, Patterson, Xuereb and Hodges2000; Frisoni et al., Reference Frisoni, Testa, Sabattoli, Beltramello, Soininen and Laakso2005; Barnes et al., Reference Barnes2007; Karas et al., Reference Karas2007), and is an important feature of patients with early onset AD (Koedam et al., Reference Koedam2011). Although the presence of posterior atrophy (PA) has been recognized, the clinical relevance has not been fully investigated and it has been relatively neglected as a potential biomarker for diagnosis. Recently, a visual rating scale was developed and validated for the assessment of PA (Koedam et al., Reference Koedam2011). One study found that PA was a good measure to distinguish between AD subjects and controls and subjects with “other dementias” and controls (Koedam et al., Reference Koedam2011). However, the majority of patients in this study had early onset dementia rather than the more common late-onset dementia (mean age of AD subjects was 78.3 years). The potential utility of PA for late-onset AD is not known.
In DLB, significant hypometabolism and hypoperfusion in the posterior cingulate, precuneus, and occipital areas has been reported which has been of great research interest given the characteristic visuo-perceptual problems of the condition (Ishii et al., Reference Ishii, Yamaji, Kitagaki, Imamura, Hirono and Mori1999; Lobotesis et al., Reference Lobotesis2001; Colloby et al., Reference Colloby2002). Some structural imaging studies have found parietal and occipital atrophy (Beyer et al., Reference Beyer, Larsen and Aarsland2007; Whitwell et al., Reference Whitwell2007; Watson et al., Reference Watson, O'Brien, Barber and Blamire2012); however, the clinical relevance of PA is currently limited.
We investigated the potential diagnostic relevance of visual ratings of PA in older AD subjects compared with DLB and similarly aged controls. We also undertook ratings of MTA, a well-established diagnostic marker for AD, and a visual rating of ventricular enlargement (VEn), as has been used in other studies as a marker of generalized atrophy (Scheltens et al., Reference Scheltens1992). Visual rating scales were used in this study as they are a quick, simple, and reliable method of assessing brain atrophy, and thus easily applied in a clinical setting.
Methods
Recruitment and assessment
Methods for subject recruitment and assessment have been described previously (Watson et al., Reference Watson, O'Brien, Barber and Blamire2012). In brief, 71 people with dementia (36 AD and 35 DLB) over the age of 60 were recruited from a community dwelling population of patients referred to local Old Age Psychiatry, Geriatric Medicine or Neurology Services. Informed consent was obtained from all subjects and, where appropriate, their nearest relative provided written informed consent.
The diagnosis of AD was in accordance with the NINCDS/ADRDA criteria (McKhann et al., Reference McKhann, Drachman, Folstein, Katzman, Price and Stadlan1984), and DLB in line with consensus criteria (McKeith et al., Reference McKeith2005), and by agreement between three experienced raters (RW, JOB, and RB) who made the diagnosis blinded to all information from the research MRI scans.
We recruited 35 control subjects of similar age and gender from among relatives and friends of subjects or volunteered via advertisements in local community newsletters. We excluded those with evidence of dementia from history or CAMCOG score < 80, depression (history and assessment) or a history of any other significant neurologic, physical or psychiatric disorder including drug and alcohol abuse (Watson et al., Reference Watson, O'Brien, Barber and Blamire2012). Assessment of global cognitive measures included the Cambridge Cognitive Examination (CAMCOG) which incorporates the Mini-Mental State Examination (MMSE; Folstein et al., Reference Folstein, Folstein and McHugh1975). Depressive symptoms were measured using the 15-item Geriatric Depression Scale (Sheikh and Yesavage, Reference Sheikh and Yesavage1986). Motor Parkinsonism was assessed with the Unified Parkinson's Disease Rating Scale, Part III (UPDRS III; Fahn and Elton, Reference Fahn, Elton, Fahn, Marsden, Goldstein and Calne1987). For subjects with dementia, neuropsychiatric features were assessed using the Neuropsychiatric Inventory (NPI; Cummings et al., Reference Cummings, Mega, Gray, Rosenberg-Thompson, Carusi and Gornbein1994), and functional activity was assessed using the Bristol Activities of Daily Living (BADL) scale (Bucks et al., Reference Bucks, Ashworth, Wilcock and Siegfried1996).
MRI acquisition and processing
Subjects underwent T1-weighted MR scanning on a 3T MRI system (Intera Achieva scanner, Philips Medical Systems, Eindhoven, the Netherlands) with an eight-channel receiver head coil within two months of the neuropsychological assessment. The sequence was a T1-weighted volumetric sequence covering the whole brain (3D MPRAGE, sagittal acquisition, 1-mm isotropic resolution and matrix size of 240 (anterior–posterior) × 216 (superior–inferior) × 180 (right–left); repetition time (TR) = 8.3 ms; echo time (TE) = 4.6 ms; SENSE factor = 2, flip angle = 8°). The acquired volume was angulated such that the axial slice orientation was standardized to align with the AC–PC line.
Visual rating scales
All scans were assessed by one rater (JOD) blinded to diagnoses and all clinical information. The rater underwent a period of training, using 23 test images from a separate group which had already been scored by two experienced raters (EJB and MJF). After completing this, visual ratings of PA, MTA, and VEn were performed for the whole cohort. In addition, 25 scans, selected by picking every fourth scan, were rated again by JOD and EJB to assess intra- and inter-rater agreement.
Posterior atrophy scale
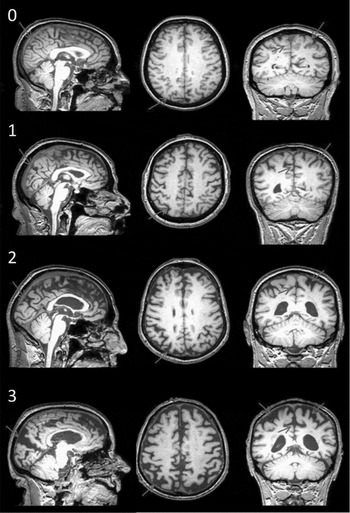
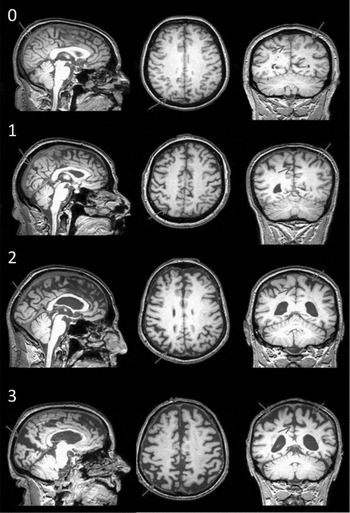
PA was scored on T1-weighted images viewed in the sagittal, axial, and coronal planes using a previously published method in which separate scores (0–4) for the left and right hemispheres are obtained (Koedam et al., Reference Koedam2011; see Figure 1).
Visual rating scale for PA. Each grade presents coronal, sagittal, and axial views (left to right, superior to inferior). This rating scale rates 0 = no atrophy, 1 = minimal atrophy, 2 = moderate atrophy, and 3 = severe atrophy. Overall PA grades were assigned after considering ratings from all three views. In coronal and axial orientations, widening of the posterior cingulate sulcus and sulcal dilatation in the parietal lobes was considered. In sagittal orientation, widening of the posterior cingulate and parieto-occipital sulcus was used along with atrophy of the precuneus. When the scores assigned to the different orientations varied, the higher score was considered. For example, if the image scored 0 in the axial orientation, but 1 in the coronal and sagittal orientation, a score of 1 was assigned as the overall PA rating for that subject.
MTA scale
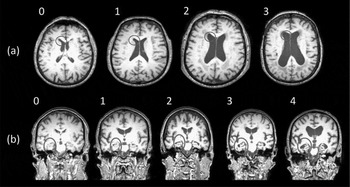
MTA was assessed using a standardized scale (Scheltens et al., Reference Scheltens1992). T1-weighted images were viewed in the coronal plane and scores for the left and right hemispheres were recorded. The scale rates atrophy on a five-point scale (0 = absent, 1 = minimal, 2 = mild, 3 = moderate, and 4 = severe) based on the height of the hippocampal formation and the width of the choroid fissure and the temporal horn (Figure 2b).
(a) Visual rating scale for VEn. Scores were assigned after visually assessing the enlargement of the lateral ventricles in the axial orientation in terms of height and width and the size of the lateral horn. This rating scale rates 0 = no VEn, 1 = mild VEn, 2 = moderate VEn, and 3 = severe VEn. (b) Visual rating scale for MTA. Scores were assigned after assessing T1-weighted images viewed in the coronal plane. The scale rates atrophy on a five-point scale, 0 = absent, 1 = minimal, 2 = mild, 3 = moderate, and 4 = severe, based on the height of the hippocampal formation and the width of the choroid fissure and the temporal horn. From grades 0 to 4, the height of the parahippocampal gyrus decreases and there is progressive widening of choroid fissures and temporal horns.

Development of a ventricular enlargement scale
VEn was scored on T1-weighted images by viewing the images in the axial plane, superior to inferior (Figure 2a). Separate scores were obtained for the left and right hemispheres. The scale rates enlargement on a four-point scale (0 = no VEn; 1 = mild VEn; 2 = moderate VEn, and 3 = severe VEn) based on the enlargement of the lateral ventricles.
Statistical analysis
Statistical analysis was performed using Statistical Package for Social Sciences (SPSS) version 19 (www.ibm.com/software/analytics/spss/products/statistics). Where appropriate, demographical and imaging variables were examined using parametric (ANOVA, two sample t-test) and non-parametric (χ2, Kruskall–Wallis, Mann–Whitney U) methods. MTA, PA, and VEn measures were derived from the original rater 1 (JOD) scores. The relationship between visual rating scores and age, MMSE and CAMCOG were investigated using Spearman's correlation coefficient. Diagnostic accuracy of the three visual rating scales in distinguishing AD from DLB, as well as AD and DLB from controls was assessed using receiver operator characteristic (ROC) curve analysis. For each visual rating scale, scores assigned for the two hemispheres were summed. For example, on the MTA scale, a score of 3 for the left hemisphere and a score of 2 for the right hemisphere would give an overall score of 5. To quantify intra- and inter-rater agreement, a two-way mixed intra-class correlation coefficient was computed, with a 95% confidence interval. Statistical significance was set at p < 0.05.
Results
Patient characteristics
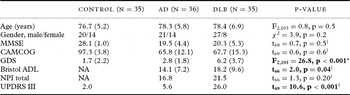
Thirty-six subjects met the NINCDS/ADRDA criteria for probable AD. Thirty-four subjects met the original consensus criteria for probable DLB and one for possible DLB (McKeith et al., Reference McKeith1996). However, all 35 subjects fulfilled the revised consensus criteria for probable DLB (McKeith et al., Reference McKeith2005). Demographic data of the study population are summarized in Table 1. Groups were well matched for age and gender. As expected, MMSE and CAMCOG were significantly lower in the dementia groups compared with controls, though MMSE and CAMCOG scores were comparable between AD and DLB, suggesting a similar level of dementia severity (p > 0.5). Also as expected, the DLB group had more depressive symptoms than both AD and controls (p < 0.001), as well as greater functional impairment (Bristol ADL, p = 0.04) and significantly higher UPDRS III scores (p < 0.001) than AD subjects.
Subject demographics

Values expressed as mean (1 SD).
Bold text denotes significant group differences.
† Student's t-test (AD vs. DLB).
* Post-hoc tests: AD > NC (p = 0.2), DLB > AD, NC (p < 0.001).
DLB = dementia with Lewy bodies; AD = Alzheimer's disease; NC = Normal Control; MMSE = Mini-Mental State Examination; CAMCOG = Cambridge Cognitive Examination; GDS = Geriatric Depression Scale; Bristol ADL = Bristol Activities of Daily Living; NPI = Neuropsychiatric Inventory; UPDRS III = Unified Parkinson's Disease Rating Scale, Part III; NA = not applicable.
Visual ratings
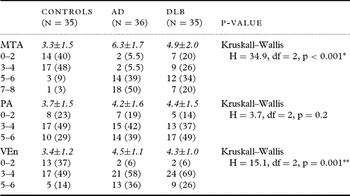
The occurrence of MTA, PA, and VEn visual rating scores in controls, AD, and DLB subjects is presented in Table 2. Significant differences between groups were observed in MTA and VEn measures (p ≤ 0.001), but not for PA (p = 0.2). Higher MTA ratings were seen in AD and DLB compared to controls (p < 0.001), while MTA was also greater in AD relative to DLB (U = 384.5, p = 0.004). VEn ratings were significantly higher in AD and DLB compared to controls (p < 0.003), but similar between AD and DLB (U = 384.5, p = 0.4). Although PA measures did not differ between groups, we did note that three of the four AD subjects (all male, with late-onset AD) with relatively low MTA scores of 0–4 had relatively high PA scores of 6.
Frequency of MTA, PA, and VEn visual rating scores in controls, AD, and DLB

MTA = medial temporal lobe atrophy; PA = posterior atrophy; VEn = ventricular enlargement.
Values in parentheses show occurrence expressed as percentage. Italics denote visual scores (mean ±1 SD).
Post-hoc Mann–Whitney U tests:
* AD > DLB (p = 0.004), AD > Con (p < 0.001), DLB > Con (p = 0.001).
** AD > DLB (p = 0.4), AD > Con (p = 0.001), DLB > Con (p = 0.003).
Clinical correlations
The relationship between visual rating scores (MTA, PA, VEn) and age, CAMCOG, and MMSE was investigated where appropriate in controls, AD, and DLB. Age effects were observed in controls (MTA, ρ = 0.30, p = 0.04) and DLB (MTA, ρ = 0.24, p = 0.08; VEn, ρ = 0.46, p = 0.003), but not in AD (ρ ≤ 0.11, p ≥ 0.11). Subsequently, the association between visual scores and cognitive variables was assessed using age-corrected Spearman's correlation coefficient (ρ′). In AD, a significant negative correlation was found between CAMCOG and MTA (ρ′ = −0.27, p = 0.05) and VEn (ρ′ = −0.47, p = 0.002), while MMSE also correlated with VEn scores (ρ′ = −0.40, p = 0.008). In DLB, an association was observed between MMSE and PA scores (ρ′ = −0.35, p = 0.02), but not for any other variables (ρ′ ≤ 0.25, p ≥ 0.08).
Rating scales: diagnostic utility
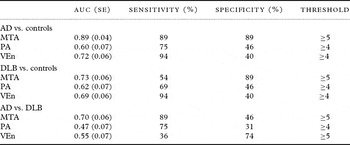
Using clinical diagnosis as the ‘‘gold standard,’’ ROC analysis was used to assess the diagnostic utility of the summed MRI visual ratings in distinguishing AD and DLB from controls as well as AD from DLB. Table 3 summarizes the diagnostic performance for PA, MTA, and VEn ratings depicting ROC area (standard error), optimal sensitivity, and specificity (minimum false positive and false negatives) with corresponding thresholds. Discriminating AD from controls, MTA was the most accurate measure (ROC curve area 0.89, sensitivity 89%, specificity 89%, threshold ≥5), while VEn (ROC curve area 0.72, sensitivity 94%, specificity 40%, threshold ≥4) and PA ratings (ROC curve area 0.60, sensitivity 75%, specificity 46%, threshold ≥4) were diagnostically ‘‘poor’’ with low specificities of detecting controls. A similar profile was observed in discriminating DLB from controls, although MTA ratings were less sensitive, though still had high specificity, in these groups (ROC curve area 0.73, sensitivity 54%, specificity 89%, threshold ≥5). In differentiating AD from DLB, diagnostic performance was ‘‘fair’’ using MTA scores (ROC curve area 0.70, sensitivity 89%, specificity 46%, threshold ≥5) but ‘‘very poor’’ for measures of VEn (ROC curve area 0.55, sensitivity 36%, specificity 74%, threshold ≥5) and PA (ROC curve area 0.47, sensitivity 75%, specificity 31%, threshold ≥4).
Diagnostic performance of summed MRI visual ratings

AUC = area under ROC curve; SE = standard error.
Optimized threshold corresponding to minimum type 1 and type 2 errors.
Rater agreement
Intra-rater agreement was excellent with an inter-class correlation coefficient of 0.95 for MTA, 0.91 for PA, and 0.92 for VEn. Inter-rater agreement (determined in 25 images for two rater pairings) was also very good with values of 0.91 for MTA, 0.85 for PA, and 0.90 for VEn.
Discussion
Using a visual rating scale to assess PA in AD, DLB, and age-matched controls, we found that there was no significant difference in PA scores across groups. This suggests that PA cannot be used as a marker to reliably distinguish between AD, DLB, and controls. This was in contrast to results reported in a recent study by Koedam et al. (Reference Koedam2011), who found that AD patients had higher mean PA scores than both the control and ‘‘other dementias’’ groups. Several studies have shown changes in the posterior regions of the cortex in groups of younger AD patients (Barnes et al., Reference Barnes2007; Frisoni et al., Reference Frisoni2007; Karas et al., Reference Karas2007). However, there is a lack of studies focusing on PA in older populations. Subjects in the study by Koedam et al. (Reference Koedam2011) were significantly younger (mean age 66.8 years) than those included in our study (mean age 78.3 years), which may have influenced the differing results. It is also possible that visually rating PA is not a specific marker of dementia. DLB is characterized by impaired visual processing which manifests as recurrent visual hallucinations and visuo-perceptual dysfunction, highlighting the potential importance of posterior structures in the pathogenesis of disease (McKeith et al., Reference McKeith2004). Although PA did not distinguish between AD and DLB, interestingly, we identified a correlation between PA and MMSE in DLB but not in AD. It is therefore possible that PA is a marker of disease severity in DLB but not in AD.
One of the key structures of the MTL is the hippocampus, which is involved in the consolidation of information from short-term memory to long-term memory and spatial navigation. MTA is an important early feature of AD and correlates with episodic memory performance and AD pathology (Lehmann et al., Reference Lehmann2011). We observed significant differences in MTA, with the AD group showing a greater degree of atrophy than control subjects or those with DLB, which is consistent with findings from previous studies (Burton et al., Reference Burton2009). MTA also correlated with CAMCOG in AD but not in DLB, suggesting that MTA may be a marker of dementia severity in AD but not in DLB. Alternatively, this may be due to the ceiling effect in the AD group because most subjects had moderate to severe MTA. Our very preliminary observation, albeit based on only three cases, that there may be some AD subjects with relatively little MTA but pronounced PA suggests possible different phenotypes of late-onset AD and warrants further study. The importance of relative preservation of MTL structures in DLB compared to AD was highlighted in the 2005 revision of the consensus criteria for DLB, when it was included as a supportive feature. Our findings in a new cohort also provide support for its inclusion (McKeith et al., Reference McKeith2005).
We used a VEn scale as a marker of global cortical atrophy. VEn was greater in AD and DLB compared to controls; although it was similar in AD and DLB. This suggests that dementia subjects have greater cortical atrophy than controls, a finding that is consistent with other imaging studies using voxel-wise analysis methods (Watson et al., Reference Watson, Blamire and O'Brien2009). In contrast to this, Scheltens et al. (Reference Scheltens1992) found that there were no significant differences in generalized brain atrophy between AD and age-matched controls using a VEn scale (Scheltens et al., Reference Scheltens1992). This may be due to a combination of smaller sample size (n = 21) and a lower image resolution (due to scanning at lower 0.5 Tesla field strength). Another factor is that the VEn scale only assesses the VEn and does not consider sulci widening, an important consideration when assessing global atrophy. The VEn scale also correlated with CAMCOG in AD but not DLB, suggesting that this measure may reflect global cognitive impairment in AD and not in DLB. This is consistent with neuropathological data that cognitive impairment in AD is associated with neurodegeneration and particularly synaptic loss (Terry et al., Reference Terry1991), whereas in DLB, dementia severity may be more associated with neuronal synaptic dysfunction rather than cell loss.
Strengths of this study include a well-characterized group of AD and DLB subjects matched for age, level of education, and dementia severity. Whilst the control subjects did not have features consistent with cognitive impairment or dementia, given that the average age was 77 years, a proportion may have pre-clinical disease, as has been shown in studies of healthy older adults (Goldman et al., Reference Goldman2001; Sperling et al., Reference Sperling2011; Rodrigue et al., Reference Rodrigue2012). The reliance on clinical diagnosis is also a potential limitation, as it is with all ante-mortem imaging studies. Visual rating scales are an operator-dependent method of analysis with the inherent possibility of inconsistency, although we achieved excellent intra- and inter-rater reliability. Raters need to be well trained and familiar with the scales so that the ratings are consistent. Additionally, the PA scale used in this study encompasses many areas and perhaps lacks regional sensitivity. It rates a number of parietal structures (precuneus, posterior cingulate, inferior parietal) together which may not all atrophy at the same rate. In contrast, a major benefit of the visual rating scale system is the ease of application in the clinical setting if MRI images of the patient are available and the interpreter is familiar with the rating scales.
Conclusions
Unlike findings reported in younger subjects, visual ratings for PA are not a reliable marker for distinguishing late-onset AD from control subjects, or for distinguishing DLB from AD. However, our findings suggest that visual ratings of MTA and VEn may be useful in distinguishing both AD and DLB from non-demented older subjects. Further studies are needed to assess the utility of visual rating scales in other dementias such as fronto-temporal dementia, where atrophy patterns may differ.
Conflict of interest
None.
Description of authors’ roles
J. O'Donovan completed the visual rating, interpreted the results, and wrote the manuscript. R. Watson co-supervised the project, interpreted results, assisted with writing of the manuscript, assessed study subjects, and provided diagnostic ratings. S. Colloby assisted with study design, writing of the manuscript, and completed the statistical analysis. M. Firbank supervised the training for the use of visual rating scales and assisted with writing of the manuscript. E. Burton assisted with training, undertook inter-rater reliability, and reviewed the manuscript. B. Barber assisted with diagnostic rating and reviewed the manuscript. A. Blamire reviewed the manuscript and secured funding for the project. J. O'Brien co-supervised the project, designed the study, took part in diagnostic rating, reviewed the manuscript, and secured funding of the project.
Acknowledgments
We thank Josh Wood, Assistant Psychologist, and members of NE-DeNDRoN for their assistance with recruitment and assessment of study participants. This study was supported by the Sir Jules Thorn Charitable Trust (grant number 05/JTA) and the UK NIHR Biomedical Research Centre for Ageing and Age Related Diseases award to the Newcastle upon Tyne Hospitals NHS Foundation Trust. The Wellcome Trust provided funding for a six-week vacation studentship.