


1. Introduction
How does environmental regulation affect corporate innovation? In theory, perspectives are split. Traditional neoclassical economic theory argues that environmental regulations (i.e., technological standards, environmental taxes, or tradable emissions) compel firms to allocate input (i.e., labor and capital) to pollution reduction, which can be unproductive from a business perspective, despite the environmental and health benefits that such regulation provides to society (Ambec et al., Reference Ambec, Cohen, Elgie and Lanoie2013). This is because regulations require firms to eliminate or internalize externalities (e.g., pollution) and constrain production options or input, which shifts capital away from productive investments. Consequently, if environmental regulation could increase profitable opportunities to reduce pollution, firms seeking profit maximization should obtain benefits (Barbera and McConnell, Reference Barbera and McConnell1990; Hamamoto, Reference Hamamoto2006). However, environmental regulation crowds out firms’ productive investment in research and development (R&D) input and can negatively affect innovation.Footnote 1
By contrast, the Porter hypothesis argues that stricter but well-designed environmental regulation can stimulate innovation, as a consequence of partially or more than fully compensating for the compliance costs (Porter and van der Linde, Reference Porter and van der Linde1995). Considering that pollution leads to the waste of scarce resources, decreasing pollution through innovation may improve resource efficiency and, ultimately, facilitate increased firm productivity. Furthermore, under the premise of the pressure exertion ascribed to environmental regulation, firms seeking profit maximization will develop a cost-effective method to comply with the regulations, thereby promoting technological innovation, improving market competitiveness, and achieving “win-win” outcomes (Jaffe and Palmer, Reference Jaffe and Palmer1997; Ambec et al., Reference Ambec, Cohen, Elgie and Lanoie2013; Chakraborty and Chatterjee, Reference Chakraborty and Chatterjee2017).Footnote 2
In January 2013, Beijing, located in the Beijing-Tianjin-Hebei region, suffered severe haze associated with an unprecedently high concentration of hourly fine particulate matter with a diameter of 2.5 micrometers ($\mu {\rm m}$ ) or less (PM$_{2.5}$
 ). The episode attracted global attention; since then, Beijing has become a heavily polluted region in China that experiences continuous haze episodes with high concentrations of PM$_{2.5}$
 , particularly in winter. Considering the significant negative impact of PM$_{2.5}$
 on public health (Garrett and Casimiro, Reference Garrett and Casimiro2011; Guaita et al., Reference Guaita, Pichiule, Maté, Linares and Díaz2011; Pascal et al., Reference Pascal, Falq, Wagner, Chatignoux, Corso, Blanchard, Host, Pascal and Larrieu2014; Li et al., Reference Li, Ma, Zheng and Shang2015), Beijing's air quality management authority has initiated long-term environmental protection policies (i.e., the closure of polluting factories and the imposition of a limit on vehicle licenses). Despite this, the total airborne pollutant emissions in Beijing have continued to exhibit high levels, resulting in frequent severe pollution episodes (Guo et al., Reference Guo, Hu, Guo, Zhang, Zheng, Zheng, Chang, James and Zhang2012).
To address this problem and better manage air quality, in addition to traditional environmental policies, in 2013 the Beijing municipal government announced the Heavy Air Pollution Contingency Plan, which was revised in 2015. However, the PM$_{2.5}$ concentration in Beijing remained at high levels, even as the peak concentration fell by 20 per cent owing to contingent emission-reduction measures (Cheng et al., Reference Cheng, Zhang, Li, Xie, Chen, Meng, Gao and He2017). Apart from local emissions, regional transport of airborne pollutants between two neighboring cities has contributed to Beijing's high PM$_{2.5}$
 concentration (Chen et al., Reference Chen, Xu, Cai and Gao2016). Consequently, regional integration has become a key solution to further reduce the PM$_{2.5}$
 concentration in Beijing.
To promote this integration, China's Ministry of Ecology and Environment released the 2017 Air Pollution Prevention and Management Plan for the Beijing-Tianjin-Hebei Region and Its Surrounding Areas, according to which Beijing, Tianjin, eight cites in Hebei Province, four cities in Shanxi Province, seven cities in Shandong Province, and seven cities in Henan Province ($2+26$ cities in total) form a regional network that is associated with the long-distance transport of airborne pollutants around Beijing;Footnote 3 thus, unified emission-reduction measures should be simultaneously implemented in these cities to address Beijing's high PM$_{2.5}$
 concentration. To improve regional environmental air quality by focusing on reducing heavy polluting weather, this policy entails multiple measures to strengthen winter air pollution prevention and control and comprehensively reduce the regional pollution discharge load. The policy is “stricter” in seven aspects. First, it represents substantial progress in adjusting the industrial structure. Second, it comprehensively promotes clean heating in winter. Third, it strengthens the comprehensive control of industrial air pollution. Fourth, it implements staggered seasonal heating production for industrial enterprises. Fifth, it strictly controls motor vehicle emissions. Sixth, it intensifies urban administration. Seventh, it strengthens the response to heavy-pollution weather.
This study investigated how the $2+26$ regional air pollution treatment plan affects R&D investment. Existing research conclusions regarding the association between environmental regulation and R&D investment are contradictory regarding different industries and countries. Brunnermeier and Cohen (Reference Brunnermeier and Cohen2003), Gray and Shadbegian (Reference Gray and Shadbegian2003), and Jaffe and Palmer (Reference Jaffe and Palmer1997) found a positive effect of environmental regulation on R&D investment in US manufacturing. Hamamoto (Reference Hamamoto2006) showed a positive relationship between environmental regulation and R&D expenditure in Japanese manufacturing. Yang et al. (Reference Yang, Tseng and Chen2012) concluded that environmental regulation positively influences Taiwan's industrial R&D investment. Chakraborty and Chatterjee (Reference Chakraborty and Chatterjee2017) asserted a positive association of environmental regulation with innovation expenditure in India's leather and textile industries. Shen et al. (Reference Shen, Wang and Luo2021) assessed a low-carbon city pilot policy and found that such regulation urges firms to emphasize greater R&D expenditure to generate a rise in productivity, consistent with the weak Porter hypothesis.Footnote 4
Conversely, Kneller and Manderson (Reference Kneller and Manderson2012) argued that environmental regulation would not cause an increase in R&D expenditure in UK manufacturing. Rubashkina et al. (Reference Rubashkina, Galeotti and Verdolini2015) demonstrated that environmental regulation can trigger a rise in patent applications but not in R&D investment. In line with their research, Yuan and Xiang (Reference Yuan and Xiang2018) indicated that in the long term, environmental regulation has a crowding-out effect on R&D investment, as innovation initiatives in the manufacturing industry are postponed by the regulation compliance cost; that is, firms have to curtail R&D input to address continuously enhanced regulations. Therefore, prior studies that have examined the link between environmental regulation and R&D investment have not provided consistent evidence. Moreover, empirical studies have generated predominantly mixed conclusions, rather than a promising theoretical model.
Hence, this study constructed a theoretical model to analyze the relationship between environmental regulation and firms’ R&D investment, an association that is dependent on environmental regulation intensity. This study yielded several novel results. Environmental regulation intensity affects R&D input through the output effect and pollution control effect. When environmental regulation intensity is relatively low, the output effect of R&D investment is greater than the pollution control effect, thus increasing the total marginal cost. Therefore, R&D investment decreases with increased environmental regulation intensity. When environmental regulation intensity is relatively high, the output effect of R&D investment is smaller than the pollution control effect, and the total marginal cost decreases. Therefore, R&D investment increases with increased environmental regulation intensity.
We focused on panel data covering China's listed companies located in the Beijing-Tianjin-Hebei region and its surrounding areas over the 2010–2019 period. This study treated the $2+26$ regional air pollution treatment policy as a quasi-natural experiment and adopted a difference-in-differences (DID) approach to explore the $2+26$
 strategy's effect on firms’ R&D input intensity. Our analysis applied the proposed theory and split the sample into major and non-major polluting industries to document two main findings. First, our results indicate a significantly higher increase in the R&D investment of firms belonging to major polluting industries in cities exposed to the $2+26$
 strategy compared to cities not subject to this policy. On average, the ratio of R&D expenditure to sales rose by 0.52 in the $2+26$
 cities compared with other cities in Beijing and Tianjin, as well as in the provinces of Hebei, Shanxi, Shandong, and Henan. The positive relationship held when alternative dependent variables were employed and when alternative specifications were used. Second, the increase in R&D intensity was greater for smaller firms, those classified as non-state-owned enterprises, those belonging to the manufacturing industry, and those located in cities with higher intellectual property rights (IPR) protection, as well as firms in cities with regional innovation and/or serious pollution.
This paper makes three crucial contributions to the current literature. First, most prior literature on the relationship between environmental regulation and innovation primarily focuses on empirical analysis. Limited attention has been paid to theoretical model development. We propose a theory to fill this gap. Our paper articulates the tradeoff (marginal cost versus marginal benefit) between regulation stringency and firm innovation investment, particularly considering the threshold effect in the model. Second, we discuss the air pollution treatment policy's extensive and intensive marginal effects, considering that the policy changed the spatial distribution of firms between the treatment and control groups. After policy implementation, firms may migrate to a city with similar economic conditions but weaker regulations (perhaps migrating from the treatment group to the control group). We provide evidence and related discussion of this migration and its potential “policy effect.” Third, our results conform to the weak Porter hypothesis and indicate that IPR protection is one of the hypothesis’ prerequisites, thus providing novel insights into achieving a win-win solution between air pollution treatment and high-quality development. Furthermore, this finding provides insights for cities in other developing countries seeking to balance environmental protection and economic development.
The remainder of this paper is organized into four sections. Section 2 introduces the theoretical model. Section 3 describes the data and methodology. Section 4 presents the estimation results. Section 5 concludes.
2. The model
We start with a simple model, based on Zhang et al. (Reference Zhang, Lu, Guo and Yu2011), to interpret the threshold effect of environmental regulation on firms’ R&D input. In a perfectly competitive market, considering the prices of goods and input factors are fixed, firms allocate input factors to maximize their profit. Firms’ production function is

where $K_{A}$ captures the capital of R&D input related to production technology, with a price of $r_{A}$
 , $\frac {\partial F}{\partial K_{A}}>0$
 , $\frac {\partial ^{2}F}{\partial K_{A}^{2}}<0$
 ; $K$
 represents the capital input, with a price of $r$
 ; and $L$
 is the labor input, with a price of $w$
 . We examine firms’ optimal selection in three scenarios: without pollution, with pollution, and with environmental regulations.
2.1 Without pollution
Without pollution, a firm's optimal decision problem can be expressed as

where P is the price of the product. The first-order condition with respect to $K_{A}$ is

Equation (1) indicates that the optimal selection of R&D input makes the marginal product of R&D input equal to the marginal cost. The R&D input $K_{A}$ satisfying formula (1) is denoted as $K_{A}^{\ast }$
 .
2.2 With pollution
We suppose that firms generate pollutants during manufacturing. Total pollutant emissions are denoted by $W=W(F,\,K_{A})$ . On the one hand, the total pollution emissions increase with production, $\frac {\partial W}{\partial F}>0$
 . On the other hand, technological progress can improve production efficiency and pollution control technology, allowing for the manufacture of more products under the same factor input and reducing the pollutants emitted per unit product, $\frac {\partial W}{\partial K_{A}}<0$
 . Assuming that the cost of treating each unit of pollution emission is $c$
 , the firm's profit maximization problem is

The first-order condition with respect to $K_{A}$ is

That is,

In equation (2), $c\frac {\partial W}{\partial F}\frac {\partial F}{\partial K_{A}}>0$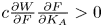 represents the marginal cost of increased pollution caused by increased production owing to R&D investment; we call this the “output effect” of R&D investment. $c \frac {\partial W}{\partial K_{A}}<0$
 represents the marginal cost of pollution reduction caused by increased production efficiency and pollution control technology brought about by R&D investment, which is the “pollution control effect” of R&D investment. Therefore, in the presence of pollution emissions, the total marginal cost of R&D input ${MC}_{K_{A}}$
 can be divided into three parts: the factor price $r_{A}$
 , output effect $c \frac {\partial W}{\partial F}\frac {\partial F}{\partial K_{A}}$
 , and pollution control effect $c\frac {\partial W}{\partial K_{A}}$
 .
When the output effect is greater than the pollution control effect, which means $\lvert c\frac {\partial W}{\partial F}\frac {\partial F}{\partial K_A} \rvert >\lvert c\frac {\partial W}{\partial K_A} \rvert$ , we have $c\frac {\partial W}{\partial F}\frac {\partial F}{\partial K_A}+c\frac {\partial W}{\partial K_A}>0$
 , and hence, ${MC}_{K_A}>r_A$
 and $P \frac {\partial F}{\partial K_A} > P\frac {\partial F}{\partial K_A}\big |_{K_A = K_A ^*}$
 . As $\frac {\partial ^{2} F}{\partial K_A^{2}}<0$
 , we can obtain $K_A< K_A ^*$
 . Accordingly, when the output effect is smaller than the pollution control effect, which means $\lvert c\frac {\partial W}{\partial F}\frac {\partial F}{\partial K_A} \rvert <\lvert c\frac {\partial W}{\partial K_A} \rvert$
 , we have $c\frac {\partial W}{\partial F}\frac {\partial F}{\partial K_A}+c\frac { \partial W}{\partial K_A}<0$
 , ${MC}_{K_A}< r_A$
 , and we can obtain $K_A>K_A ^*$
 .
The above model analysis shows that pollution emission affects R&D input through the output and pollution control effects. When the output effect is greater than the pollution control effect, the increased marginal cost caused by the increased output is more significant than the decrease in the marginal cost caused by improved production efficiency and pollution control technology. Therefore, the total marginal cost of R&D investment increases, and firms tend to reduce R&D investment. On the contrary, when the output effect is less than the pollution control effect, the total marginal cost of R&D input decreases, and firms increase R&D input.
2.3 With environmental regulations
Next, we address the case wherein firms face environmental regulation. We assume that environmental regulations set a total pollution emissions limit for firms, expressed by $R(\tau )$ . The amount of pollution firms emit shall not exceed the upper limit; that is, $W\leq R(\tau )$
 , where $\tau$
 is the environmental regulation intensity. The greater $\tau$
 is, the higher the environmental regulation intensity is, and the less pollution firms can emit; that is, $\frac {\partial W}{\partial \tau }<0$
 . Environmental regulations are introduced in this manner predominantly because the $2+26$
 policy regulates firms by setting regional emissions limits. In the face of environmental regulations and pollution emissions limits, firms must devote some of their production efforts to pollution control in the form of pollution control expenditure, $E=E(F,\,K_{A})=\alpha F$
 , where $\alpha$
 ($0<\alpha <1$
 ) is the proportion of a firm's output that is expended to control pollution. The magnitude of $\alpha$
 reflects the level of a firm's response to environmental regulation, which changes with regulation intensity. This is because environmental regulations constrain the standard for firms’ pollution treatment. Manufacturers’ total pollution emission can be written as a function of output and pollution control expenditure; that is, $W=W(F,\,E)$
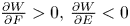
 . Total pollution emission increases with increased output and decreases with increased pollution control expenditure; that is, $\frac {\partial W}{\partial F}>0,\,\frac {\partial W}{\partial E}<0$
 . In this case, the firm's profit maximization problem isFootnote 5

Subsequently, we develop a Lagrangian function and obtain (with the first-order condition with respect to $K_{A}$ and $\alpha$
 ) the following:


Equation (4) yields

Substitution into equation (3) yields

Equation (6) shows that when faced with environmental regulations, a firm's optimal choice is to equalize the marginal pollution increase caused by production with the marginal pollution reduction caused by the pollution control expenditure. We suppose that a manufacturer's total technical level is $T=T(A,\,E)$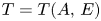 , where $A$
 represents the level of sophistication of their production technology, and $E$
 represents the level of sophistication of their pollution control technology; then, we have

According to equation (7), the sign of $\frac {\partial T}{\partial W}$ depends on the sign of $\big(\frac {\partial W}{\partial F}\frac {\partial F}{ \partial K_{A}}+2\alpha \frac {\partial W}{\partial E}\frac {\partial F}{ \partial K_{A}}\big)$
 ; like in the second case, $\big(\frac {\partial W}{\partial F} \frac {\partial F}{\partial K_{A}}+2\alpha \frac {\partial W}{\partial E}\frac {\partial F}{\partial K_{A}}\big)$
 can be seen as two parts, wherein $\big(\frac {\partial W}{\partial F}\frac {\partial F}{\partial K_{A}}\big)$
 refers to the output effect, indicating the cost of increased production owing to R&D investment, and $\big(2\alpha \frac {\partial W}{\partial E}\frac {\partial F}{\partial K_{A}}\big)$
 refers to the pollution control effect, indicating the cost of pollution reduction precipitated by R&D investment. The sign of the final total effect depends on the two effects’ relative size. Substituting equation (6) into equation (7), we have

Now, from equation (8), we can see that when $0<\alpha <0.5$ , $1-2\alpha >0$
 , $\frac {\partial T}{\partial W}=\frac {\partial T}{\partial K_{A}}\frac {\partial K_{A}}{\partial W}>0$
 ,
 $\frac {\partial K_{A}}{\partial W}>0$. Because of $\frac {\partial W}{\partial \tau } <0$
 , we can obtain $\frac {\partial K_{A}}{\partial \tau }<0$
 . This means that a firm's R&D input falls with environmental regulation intensity, consistent with the traditional neoclassical economic theory.
When $0.5<\alpha <1$ , $1-2\alpha <0$
 , $\frac {\partial T}{\partial W}=\frac {\partial T}{\partial K_{A}}\frac {\partial K_{A}}{\partial W}<0$
 ,
 $\frac {\partial K_{A}}{\partial W}<0$. We can obtain $\frac {\partial K_{A}}{\partial \tau }>0$
 . This means that a firm's R&D input increases with environmental regulation intensity, consistent with the Porter hypothesis.
The economic implication of this finding is that environmental regulation exerts a threshold effect on R&D input. In the presence of weak environmental regulation, firms’ attitude toward pollution control is more moderate, and the proportion of pollution control activities in the total production activities is small; in this case, the output effect of R&D investment is greater than the pollution control effect, thus increasing the total marginal cost. Therefore, R&D investment decreases with increased environmental regulation intensity. Conversely, in the presence of strong environmental regulation, firms have to pay greater attention to pollution control, and pollution control activities account for a larger proportion of total production activities. Additionally, the output effect of R&D investment is smaller than the pollution control effect, and the total marginal cost decreases. Therefore, R&D investment increases with increased environmental regulation intensity.
3. Data and methodology
This study employed a firm-level panel dataset covering the 2010–2019 period to examine how environmental regulation affects firms’ R&D investment in China. We compiled a dataset using data obtained from three different sources. First, data on listed firms’ R&D investment, patent applications, and financial circumstances were obtained from the China Stock Market and Accounting Research database. Second, data on city-level air pollution were extracted from the Chinese Research Data Services Platform. We used daily air quality data to calculate the city-level average amount of PM$_{2.5}$ for 2016. Third, we scraped the IPR-related trials data available from China Judgment Online,Footnote 6 initiated by the Supreme People's Court in 2013, and then extended the scope to gather all judgment documents published by China's four-level courts in 2014. As all valid judgment documents in China are uploaded to this website, we constructed a web spider using Python to collect the number of IPR-related trials for the 2010–2019 period according to the cause of action and treating the location of the relevant court's jurisdiction as the trials’ geographic distribution. As the region where trials are held is based on the plaintiff's or defendant's location, we used the number of IPR-related trials to measure IPR protection intensity. Table 1 presents the summary statistics for all the variables.
Descriptive statistics

Notes: The table presents the variable's descriptive statistics.
This study used the 2017 Air Pollution Prevention and Management Plan for the Beijing-Tianjin-Hebei Region and Its Surrounding Areas, released by China's Ministry of Ecology and Environment, as a quasi-natural experiment to analyze the effect of environmental regulation on firms’ innovation. According to the policy arising from the aforementioned plan, Beijing, Tianjin, eight cities in Hebei Province, four cities in Shanxi Province, seven cities in Shandong Province, and seven cities in Henan Province ($2+26$ cities in total) have been designated for the collaborative management of air pollution prevention and control. The selection of these 28 cities was based on geographic location – specifically, the Beijing-Tianjin-Hebei region's air pollution transmission channel – rather than other economic factors. Therefore, these cities were selected to comprise the treatment group to better satisfy the randomization principle, and we used cities other than these 28 cities in Beijing and Tianjin and the provinces of Hebei, Shanxi, Shandong, and Henan as the control group. Considering that the between-city economic differences within a province are relatively small, the control group in this study was a satisfactory reference for the treatment group, indicating, to some extent, the exogeneity of the policy that we examined. Moreover, we used propensity score matching in the regression analysis to address the effect of the imbalance between the treatment and control groups.
Additionally, the level of firm innovation is affected by time-varying firm characteristics; therefore, based on the extant literature, we used several firm-level control variables in the regression analysis to control time-varying firm characteristics and address the possible bias owing to the problem of omitted variables (He and Tian, Reference He and Tian2013). The control variables were Size (measured by the natural logarithm of total assets), Leverage (asset-liability ratio), ROA (return on assets), Capital expenditure (ratio of capital expenditure to total assets), and Cash flow (ratio of cash and cash equivalents to total assets). In sum, the central model is

where $i$ represents each firm, $t$
 represents each time period, and $u_{i,t}$
 is the error term. The variable on the left side, R&D intensity, is a measure of R&D investment at firm $i$
 in year $t$
 . $Treat_{i}$
 is a dummy variable that was assigned a value of one if firm $i$
 was located in one of the 28 cities outlined in the 2017 Air Pollution Prevention and Management Plan for the Beijing-Tianjin-Hebei Region and Its Surrounding Areas and zero otherwise. $Post_{t}$
 is a dummy variable that was assigned a value of one if time $t$
 was after the 2017 implementation of the relevant environmental regulation and zero otherwise. $Treat_{i}\times Post_{t}$
 is the interaction term of $Treat_{i}$
 and $Post_{t}$
 , and the coefficient $\beta _{1}$
 captures the average treatment effect. Control variables (i.e., Size, Leverage, ROA, Capital expenditure, and Cash flow) were included in the vector $\mathbf {x}_{i,t}$
 . Moreover, we included year-specific dummy variables, $\eta _{t}$
 , to control for shocks and trends that shape R&D investment over time, and firm-specific dummy variables, $\alpha _{i}$
 , to control for time-invariant, unobserved firm characteristics that shape R&D investment across firms. Standard errors were clustered at the city level owing to the potential correlation of the error term, $u$
 , within a city.
The methodology described above quantified the environmental regulation's average treatment effect but could not capture trends after the policy's implementation. Consequently, we used the following identification strategy to assess the dynamic effects:

where $k$ represents the time interval of the relevant environmental regulation's implementation, and $\tau _{k}$
 is a dummy variable that was assigned a value of one if the time interval equaled $k$
 and zero otherwise. Detrending and centering the estimates one period before the policy implementation allowed us to capture the results for dynamic effects; thus, the key coefficient $\beta _{k}$
 represents the average treatment effects in different periods.
4. Empirical results
We tested whether and how R&D investment across different firms has systematically changed with the implementation of the $2+26$ regional air pollution treatment. Generally, under certain geographical conditions, we can trace the path of air mass according to its transmission frequency. This trajectory is called the transmission channel. During the cross-regional transmission of air mass, air pollutants – such as nitrogen dioxide, sulfur dioxide, and PM$_{2.5}$
 – also spread along the transmission channel. According to Kebin He, an academician affiliated with the Chinese Academy of Engineering, the 28 cities in the Beijing-Tianjin-Hebei region's air pollutant transmission channel were analyzed and summarized based on the historical data of highly polluted weather, and the effect of treatment on the cities located in the air pollutant transmission channel has proven to be far superior to the collective treatment of all cities in the Beijing-Tianjin-Hebei region. As previously mentioned, in this study, treatment group cities located in the air pollutant transmission channel were selected according to their geographic location; therefore, a considerable endogeneity problem should not be present.
In table 2, columns 1 and 2 show simple specifications, with only an environmental regulation dummy measure in the presence of fixed firm and year effects, using an annual data ordinary least squares (OLS) regression, with robust standard errors clustered by city. These two columns split the observations into major and non-major polluting industries. Columns 3 and 4 further extend columns 1 and 2 to include a full set of control variables on the right side. The environmental regulation policy demonstrated a positive and significant effect on the R&D investment of firms in major polluting industries, consistent with the weak Porter hypothesis, whereas the policy's impact on firms in non-major polluting industries was insignificant. In particular, the results using full controls indicate that environmental regulation significantly increased the R&D intensity of firms in major polluting industries by 0.52. By contrast, based on the proposed theory, owing to a relatively small pollution abatement cost in non-major polluting industries, increased regulation intensity led to a fall in firms’ R&D input, and the significance levels declined. The following analysis examined the $2+26$ strategy's effect on innovation among firms in major polluting industries using a robustness check and heterogeneity analysis.
Basic estimation results

Notes: In the table, the dependent variable is the ratio of R&D expenses to sales, R&D intensity. Estimations used panel regression with firm fixed effects and robust standard errors clustered by city in parentheses. Year dummies were included in all regressions. Columns (1) and (2) show results obtained under simple specifications, with an environmental regulation dummy measure, using annual data OLS regression, and the sample split into major and non-major polluting industries. Columns (3) and (4) show results that extend those in columns (1) and (2) by including a full set of control variables.
One key criterion for the DID approach is that the treatment and control groups must conform to the assumption of a common trend. As long as this assumption is satisfied, the control group can be treated as a fair reference for the treatment group to ensure a consistent estimation of the average treatment effect. We tested this and described the dynamic effects of environmental regulation on firms’ innovative activities visually in figure 1. As can be observed, the R&D intensity between the treatment and control groups did not show a significant difference before policy implementation, indicating that the DID model satisfied the common trend assumption. Following policy implementation, environmental regulation significantly increased the R&D intensity of major polluting firms, showing a linear trend indicating a sustainable effect of the $2+26$ strategy on polluting firms’ R&D input.
Dynamic effects of the “$2+26$ ” regional air pollution treatment.

Table 3 presents the results of the robustness tests. Column 1 shows the results of using the natural logarithm of (one plus) the number of patents, ln($patent$ +1), as an alternative dependent variable to explore the effect of environmental regulation on firms’ innovation outcomes. We found that the policy resulted in a 25.2 per cent rise in the number of patent applications submitted by firms in major polluting industries, implying that the $2+26$
 strategy has stimulated polluting firms’ innovation activities and generated a significantly increased number of patents. Column 2 shows the results of using an alternative control group. The control group used to obtain the results in table 2 comprised other cities in the provinces subject to the $2+26$
 strategy. Considering that the $2+26$
 cities geographically refer to the Beijing-Tianjin-Hebei region's air pollution transport channel, the control group's demarcation was primarily based on geographic factors, with characteristics of randomness. Cities within a province are relatively consistent in terms of their level of economic development and can, thereby, play a vital reference role. Column 2 shows the results of using only the $2+26$
 regional air pollution treatment cities’ neighboring cities to comprise the control group. Theoretically, these new control and treatment groups were closer to one another in terms of economic characteristics. The results using this stricter control group confirmed the previous findings.
Robustness check

Notes: Column (1) shows the results of using the natural logarithm of (one plus) the number of patents, ln($patent$ +1), as an alternative dependent variable. Column (2) shows the results of using the $2+26$
 regional air pollution treatment cities’ neighboring cities as the control group. Column (3) shows the results of including an interaction term of industry and year dummies. Column (4) shows the results of including an interaction term of city and year dummies. Column (5) shows the results of including an interaction terms of industry, city, and year dummies simultaneously. Column (6) shows the results of applying the propensity score matching method. Estimations used panel regression with firm fixed effects and robust standard errors clustered by city in parentheses. Full control variables and year dummies were included in all regressions.
Apart from environmental regulation, China's industrial policy, as outlined in the Five-Year Plans, can shape R&D decisions across industries; therefore, column 3 of table 3 shows results that extend those presented in column 3 of table 2 by incorporating an interaction term of industry and year dummies to control for industrial policy shocks. Additionally, because China has attempted to improve innovation, concurrent city-level events that can affect innovation should be noted, such as tax advantages and government subsidies. Hence, column 4 of table 3 shows results that extend those presented in column 3 of table 2 by incorporating an interaction term of city and year dummies to control for concurrent city-level events. Considering that policies can be at both the industry and city level, the interaction term of industry, city, and year dummies was included simultaneously in the calculations performed to produce the results shown in column 5. Lastly, to avoid the effect of the imbalance between the treatment and control groups, column 6 reports the results of DID estimation using propensity score matching (PSM-DID).Footnote 7 As illustrated in figure 2, the imbalance between the treatment and control groups significantly declined in the presence of different control variables, with a degree of deviation within 5 per cent. These significant findings reconfirmed our argument.
Results of propensity score matching.

Table 4 presents the results of heterogeneity analysis using the same specifications applied to column 3 of table 2. The analysis examined the relationship of interest across firms’ environmental characteristics. First, IPR protection directly determines firms’ innovation earnings. According to the Porter hypothesis, when firms face environmental regulation, they can improve revenue through innovation activities to counterbalance pollution abatement costs. Therefore, in regions with higher levels of IPR protection, the expected return for firms conducting innovative activities is higher, and their incentives to innovate are stronger. Thus, we used the number of IPR-related trials in the city where each firm was located to measure IPR protection intensity. Cities with more IPR trials were considered to have more powerful protection. The results in columns 1 and 2 indicate that in regions with stronger IPR protection, environmental regulation increased firms’ R&D input, suggesting that IPR protection significantly affects the realization of the Porter hypothesis.
Heterogeneity analysis based on city-level characteristics

Notes: The regression specifications follow those applied to column (3) of table 2. Columns (1) and (2) show the results of splitting the subsample according to the IPR protection level. Columns (3) and (4) show the results of splitting the subsample according to the regional innovation level. Columns (5) and (6) show the results of splitting the subsample according to the pollution level.
Columns 3 and 4 of table 4 show results focused on the research environment. In particular, the degree of regional innovation offers crucial research support for China's technological development. According to the spillover effect, the agglomeration of innovative industries has been an attempt to contribute to tracing frontier science and technology and attracting more innovation-minded graduates. Therefore, if the city in which a firm is located has a higher level of innovation, the firm can easily access various kinds of research resources, which provides the firm with more options when conducting innovative activities – a circumstance that is beneficial for innovation. By dividing the sample according to the number of patent applications, our results show that environmental regulation had a greater increasing effect on the R&D input of firms located in cities with higher innovation levels relative to their counterparts in cities with lower innovation levels.
Pollution intensity commonly reflects the local energy and industrial structure. If pollution intensity is higher, the green production capacity is insufficient, or the awareness of green production is weaker. Firms need to initiate considerable change when exposed to stricter environmental regulations. Firms located in a region with heavy pollution before policy implementation must pay higher pollution treatment costs to realize regulation targets, such as emissions reduction and green production. Therefore, those firms are more strongly motivated to improve competitiveness and profit via innovation. Columns 5 and 6 of table 4 show the results of exploring this from the perspective of historical pollution intensity. We split the sample according to the level of PM$_{2.5}$ in 2016 and found that firms located in a place with heavy pollution before policy implementation significantly increased R&D input following regulation implementation – a finding that further supported our argument.
Table 5 shows the results of exploring the heterogeneous effects of firm characteristics. First, the industry to which a firm belongs determines its response to environmental regulation. Generally, manufacturing firms face stricter environmental regulation and can easily improve their competitiveness through technological innovation and cost reduction, whereas firms in service and other traditional industries can hardly leverage technological innovation to offset the cost of regulation compliance. This leads to a difference in innovative activities in response to environmental regulation. The results shown in columns 1 and 2 confirm that environmental regulation significantly improves manufacturing firms’ R&D intensity, but its effect on non-manufacturing firms was insignificant. The second part of table 5 presents the results for firms classified as state-owned versus non-state-owned enterprises. When the sample was split, it became clear that the positive association between environmental regulation and R&D intensity held solely in the subsample of non-state-owned enterprises. This is because state-owned enterprises enjoy government backing and are relatively well looked after during policy implementation. Moreover, state-owned enterprises do not seek profit maximization; thus, even if costs rise, incentives to address the situation are not apparent. Conversely, private companies are more strongly motivated to innovate to offset the regulation compliance expenditure, considering the stricter regulation with which they are confronted. We tested whether the results would change based on firm size. The last two columns split the sample by firm size, which was determined based on a firm's total assets. The R&D-regulation relationship was observed to be somewhat looser in larger firms that realize economies of scale to reduce production cost and, thus, have more funds to manage pollution abatement costs from regulation. In contrast, smaller firms showed financial constraint and thus higher sensitivity to environmental regulation, which led to stronger innovation effects.
Heterogeneity analysis based on firm-level characteristics

Notes: The regression specifications followed those applied to column (3) of table 2. Columns (1) and (2) show the results of splitting the subsample according to whether the firm belonged to the manufacturing industry. Columns (3) and (4) show the results of splitting the subsample according to whether the firm was classified as a state-owned enterprise (SOE). Columns (5) and (6) show the results of splitting the subsample according to firm size.
The results shown in table 6 further elucidate the policy's extensive and intensive marginal effects. As argued above, the selection of these 28 cities was based on geographic location, but that led to another problem, which is that policy can change the spatial distribution of firms between the treatment and control groups. After policy implementation, firms may migrate to a city with similar economic conditions but weaker regulations (perhaps migrating from the treatment group to the control group). If some R&D-related firm characteristics can increase migration probability (e.g., enterprises with a low R&D capacity or a small size may be more likely to migrate), this migration increases the treatment group's average R&D intensity and decreases that of the control group. We would then observe a positive “policy effect,” even if the policy exerts no effect on enterprises’ R&D. Therefore, to eliminate interference from the competitive explanation of enterprise migration, we took cities adjacent to the $2+26$ cities as the treatment group, and non-adjacent cities in the province where the $2+26$
 cities are located as the control group to empirically test the validity of environmental regulation's regional migration effect. Owing to the distance advantage of the $2+26$
 cities’ neighboring cities, when facing environmental regulation, transferring to neighboring cities becomes an important cost-saving measure for enterprises that want to evade regulation. The results in table 6 indicate that environmental regulation has not brought significant changes in innovation levels to listed companies in neighboring regions, which suggests that the possible reason for low innovation and high pollution enterprises’ industrial migration did not interfere with this study's estimated results.
Further discussion

Notes: Estimations used panel regression with firm fixed effects and robust standard errors clustered by city in parentheses. Full control variables and year dummies were included in all regressions.
5. Conclusion
This study investigated the effect of the $2+26$ regional air pollution treatment policy on firms’ R&D investment in China, to test the Porter hypothesis. A DID approach was suitable for focusing on the $2+26$
 regional strategy for air quality improvement to examine the casual impact of environmental regulation on R&D input.
The Porter hypothesis has three versions. First, the narrow Porter hypothesis emphasizes that more flexible environmental policy tools (i.e., pollution charges and emissions trading) can stimulate corporate innovation more favorably than mandatory management. Second, the weak Porter hypothesis states that stricter environmental regulation promotes innovation, but their combined effects are uncertain. Third, the strong Porter hypothesis asserts that the innovation offset effect caused by well-designed regulation can be sufficient to compensate for compliance costs, thereby improving enterprise productivity to a certain extent. Our results conform to the weak version of the Porter hypothesis.
This research has three notable findings. First, from a theoretical perspective, when environmental regulation intensity is relatively high, firms’ R&D investment increases with regulation intensity and declines otherwise. Second, we determined that the rise to be expected in the R&D investment of firms in major polluting industries should be significantly larger in cities exposed to the $2+26$ strategy than in cities not subject to this policy, which is consistent with the weak Porter hypothesis. This positive relationship holds across various econometric specifications. Third, the positive relationship between the $2+26$
 strategy and R&D is stronger for smaller firms, those classified as non-state-owned enterprises, those belonging to the manufacturing industry, and those located in cities with higher levels of IPR protection, innovation, and/or pollution.
Our results contribute to the literature in three ways. First, we constructed a theoretical model to analyze the relationship between firms’ R&D input and environmental regulation intensity and articulate the tradeoff (marginal cost versus marginal benefit) between regulation stringency and firm innovation investment. Second, we elucidated environmental regulation policy's extensive and intensive marginal effects. Third, the insights obtained herein (i.e., that IPR protection is a prerequisite of the Porter hypothesis) are valuable for developing countries aiming to implement win-win solutions that balance air pollution treatment and high-quality development.
One limitation of this study is that it did not analyze environmental regulation's effect on R&D expenditure focused on green innovation, owing to data unavailability. Our second limitation is that the impacts on long-term innovation output (i.e., the number of patents) remain unexplored, as the specific policy that we analyzed was implemented in 2017. Third, the DID setup is a weak causal identification research design in the sense that firms in the $2+26$ are probably more polluting, whereas firms in the control group are cleaner. This might have biased the estimates upward (although the PSM-DID in table 3 compensated to some extent). Thus, we suggest several further research directions, such as investigating the $2+26$
 strategy's effect on firms’ green innovation and ascertaining the effect of pollution treatment on both firm innovation output and total factor productivity.
Acknowledgements
We would like to thank the two anonymous referees, the associate editor, and Prof. E. Somanathan (Co-Editor), for their helpful comments and suggestions. This research was supported by the National Natural Science Foundation of China (grant 72304022), and the youth academic talent program of the Beijing International Studies University (grant QNYC23A007).



