INTRODUCTION
The ecological consequences of land-use change vary considerably for different taxa, as particular species traits interact differently with the disturbed environment (Daily Reference DAILY2001, Koh et al. Reference KOH, SODHI and BROOK2004). A clear understanding of these consequences is currently lacking for both secondary (Brook et al. Reference BROOK, BRADSHAW, KOH and SODHI2006, Gardner et al. Reference GARDNER, BARLOW, PARRY and PERES2007) and plantation forests (Hartley Reference HARTLEY2002, Lindenmayer & Hobbs Reference LINDENMAYER and HOBBS2004), which are both increasing in importance within tropical forest landscapes (Evans & Turnbull Reference EVANS and TURNBULL2004, Neeff et al. Reference NEEFF, LUCAS, SANTOS, BRONDIZIO and FREITAS2006).
While most studies to date have focused on charismatic indicator or flagship groups such as birds and mammals, attention is now expanding to a wider range of taxa (Barlow et al. Reference BARLOW, GARDNER, ARUJO, BONALDO, COSTA, ESPOSITO, FERREIRA, HAWES, HERNANDEZ, LEITE, LO-MAN-HUNG, MALCOLM, MARTINS, MESTRE, NUNES-GUTJAHR, OVERAL, PARRY, PETERS, RIBEIRO-JUNIOR, DA SILVA MOTTA, DA SILVA and PERES2007, Gardner et al. Reference GARDNER, BARLOW, ARUJO, AVILA-PIRES, BONALDO, COSTA, ESPOSITO, FERREIRA, HAWES, HERNANDEZ, HOOGMOED, LEITE, LO-MAN-HUNG, MALCOLM, MARTINS, MESTRE, MIRANDA-SANTOS, NUNES-GUTJAHR, OVERAL, PARRY, PETERS, RIBEIRO-JUNIOR, DA SILVA, DA SILVA MOTTA and PERES2008). Insects make an enormous contribution to both tropical diversity (Lewinsohn et al. Reference LEWINSOHN, FREITAS and PRADO2005) and ecosystem functioning (Wilson Reference WILSON1987), and moths are one of the groups playing a central role in numerous ecosystem processes as prey, herbivores and pollinators (Barlow & Woiwod Reference BARLOW and WOIWOD1989, Janzen Reference JANZEN1987).
Relatively few studies of tropical moth faunas have been conducted in the neotropics (Brehm et al. Reference BREHM, SUSSENBACH and FIEDLER2003, Hilt et al. Reference HILT, BREHM and FIEDLER2006, Ricketts et al. Reference RICKETTS, DAILY, EHRLICH and FAY2001) despite higher species richness in this region than elsewhere in the tropics (Hilt & Fiedler Reference HILT and FIEDLER2005). There is also a current lack of understanding regarding the relative importance of local forest type versus landscape features of the wider countryside in determining patterns of diversity (but see Ricketts et al. Reference RICKETTS, DAILY, EHRLICH and FAY2001). This study is one of the first to examine the diversity patterns of lowland Amazonian moth assemblages in a human-dominated landscape including primary, secondary and plantation forests.
We sampled three families differing in their ecology and life-histories (Hilt & Fiedler Reference HILT and FIEDLER2006, Janzen Reference JANZEN1984): the large-bodied emperor moths (Saturniidae) and hawk moths (Sphingidae), as well as the smaller-bodied tiger moths (Arctiidae). By assessing changes in abundance, species richness and community composition, this study examined the various effects of landscape-level disturbance on moth assemblages. We tested the a priori hypotheses that (1) disturbed forest types (secondary forests and Eucalyptus plantations) support distinct and less species-rich moth communities than primary forest, and (2) that responses to disturbance vary between moth families as a result of differences in life-history strategies e.g. mobile, long-lived taxa are predicted to persist better in disturbed forest types.
METHODS
Study sites
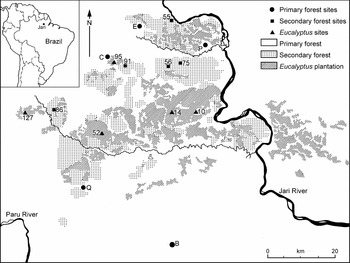
Sampling was conducted in the 1.7-Mha landholding of Jarí Celulose S.A., located on the border between the states of Amapá and Pará in northern Brazilian Amazonia (0°53ʹS, 52°36ʹW; Figure 1). The area was purchased in 1967, and about 10% of the land converted to exotic tree plantations. Current stands consist of Eucalyptus urograndis, while earlier plantations of Gmelina arborea and Pinus caribaea have mostly been cleared and abandoned. This process has resulted in a complex landscape mosaic of Eucalyptus plantations, with large tracts of regenerating secondary forest and relatively undisturbed primary forest. We sampled the moth community at 15 sites (Figure 1; Table 1), comprising five of each of the three forest types: (1) undisturbed primary forest; (2) even-aged native secondary forest (14–20 y since abandonment); and (3) 4–5-y-old Eucalyptus plantation stands. Sites were selected to minimize age differences within each forest type, and to maximize their area (mean size of Eucalyptus and secondary forest blocks was 1687 ha (range = 574–3910 ha) and 2682 ha (range = 1079–3508 ha), respectively) and spatial independence (mean distance between primary, secondary and Eucalyptus sites was 30 km (range = 14–67 km), 9 km (range = 4–44 km) and 11 km (7–50 km), respectively). Sampling was conducted between 1 April and 18 May 2005, during the wet season (January–June). Average annual rainfall at Jari is 2115 mm, and the mean daily air temperature is 26 °C (Coutinho & Pires Reference COUTINHO and PIRES1996).
Map of the Jari landholding in the northern Brazilian Amazon and locations of the 15 sites within areas of primary forest, secondary forest and Eucalyptus urograndis plantations where moth sampling was carried out between April and May 2005. Labels refer to the individual sites listed in Table 1.

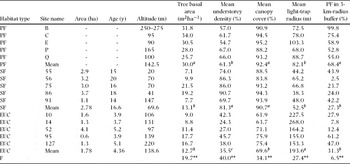
Selected details of the 15 light-trapping sites within primary (PF) and secondary forests (SF), and Eucalyptus plantations (EUC) in the Jari landscape. PF sites are part of large contiguous tracts of relatively undisturbed forest. Site names: B = Bituba, C = Castanhal, E = Estaçao, P = Pacanari, Q = Quaruba. Light-trap radius = distance at which light-trap is visible to the human eye, PF in 3-km-radius buffer = proportion of a 3-km-radius area around each sampling site that contains PF. Significance was calculated with one-way ANOVAs; F = F-ratio, ** = P < 0.01, superscript letters denote Tukey's HSD subsets.

Moth sampling
To sample moths we used a 2 × 2-m sheet trap design (Chey et al. Reference CHEY, HOLLOWAY and SPEIGHT1997), which has the advantages over more standard light-traps (Intachat & Woiwod Reference INTACHAT and WOIWOD1999) of a selective catch, reduced damage to trapped individuals, and portability (Axmacher & Fiedler Reference AXMACHER and FIEDLER2004). We placed a standardized set of three light-traps at 200-m intervals along the line transects of each site. A 12-W UV blacklight tube was used at the central light-trap and a 160-W mercury-vapour light bulb at the two outermost traps. For an overview of light-trapping feasibility see Beck & Linsenmair (Reference BECK and LINSENMAIR2006).
The effective ‘radius of attraction’ of light-traps (Beck & Linsenmair Reference BECK and LINSENMAIR2006), is dependent upon sex and species identity (Baker & Sadovy Reference BAKER and SADOVY1978) as well as light intensity and wavelength (Muirhead-Thomson Reference MUIRHEAD-THOMSON1991). While most evidence suggests an attraction radius of 50–200 m (Ricketts et al. Reference RICKETTS, DAILY, EHRLICH and FAY2001), Baker & Sadovy (Reference BAKER and SADOVY1978) report distances up to 500 m. To minimize the capture of vagrants from surrounding forest types, all three light-traps were located in the centre of each forest patch and at least 500 m from any edge with neighbouring forest types. The radial extent of light diffusion through each stand was also estimated for each trap by measuring the maximum distance in two diametrically opposite directions for which any light could be detected by eye.
Traps were operated from 18h30 to 06h30, and checked simultaneously every hour by JEH and two trained assistants. Arctiidae, Saturniidae and Sphingidae moths were collected manually from both sides of the sheets and the immediately surrounding areas, using a killing bottle charged with ethyl acetate. The 15 sites were sampled twice each, with one repeat in each of two rotations (mean interval between consecutive samples at the same site ± SD = 27.6 ± 9.9 d, N = 15 sites), resulting in a total sampling effort of 30 trap-nights (two trap-nights or 24 trap-hours per site). The sampling order of sites within each rotation was controlled to account for the fraction of the moon illuminated (http://aa.usno.navy.mil/data/docs/MoonPhase.html) and to avoid any systematic bias from the well-documented influences of weather on light-trap captures (Fry & Waring Reference FRY and WARING2001, Spalding & Parsons Reference SPALDING and PARSONS2004, Yela & Holyoak Reference YELA and HOLYOAK1997). Catches were also restricted to periods without strong moonlight by avoiding nine nights around the full moon (Yela & Holyoak Reference YELA and HOLYOAK1997), and weather conditions were recorded every hour during sampling. Bulbs were protected from above but any broken by rain were immediately replaced.
Collected moths were oven-dried and identified at the Entomology Department of the Instituto Nacional de Pesquisas da Amazônia (INPA) in Manaus using the INPA reference collection and available guides (d'Abrera Reference D'ABRERA1995, Reference D'ABRERA1998; Kitching & Cadiou Reference KITCHING and CADIOU2000, Lemaire Reference LEMAIRE1988, Piñas-Rubio & Pesántez Reference PIÑAS-RUBIO and PESÁNTEZ2000, Piñas-Rubio et al. Reference PIÑAS RUBIO, RAB-GREEN, ONORE and PESÁNTEZ2000, http://www.inra.fr/Internet/Produits/PAPILLON/arct_guy/arct_guy.htm). Morphospecies were identified by INPA staff using anatomical features and wing patterns, with care taken to minimize over-splitting as a result of sexual dimorphism or natural variation. Specimens of all species and morphospecies were subsequently deposited at INPA.
Vegetation sampling
Trees and woody lianas were sampled along the same transect lines in each of the 15 sites. We measured all standing trees ≥ 10 cm in diameter at breast height (dbh) and lianas ≥ 5 cm in a 10 × 1000-m plot established at each of the 10 primary and secondary forest sites. Basal area in plantations was estimated from 23 10-m radial plots per site (7226 m2) and converted to basal area per hectare. Density of saplings (taller than 1 m and < 10 cm dbh), and lianas (< 5 cm dbh) were determined by recording all stems within three 2.5 × 2.5-m (6.25 m2) subplots placed at 23 locations every 50 m along each transect (total of 69 subplots per site).
Canopy cover and understorey density were measured at each light trap location following the methodology of Barlow et al. (Reference BARLOW, HAUGAASEN and PERES2002). A reading with a spherical densiometer (Lemmon Reference LEMMON1957) was taken in each of the four compass directions and averaged before converting to a percentage canopy cover. Similarly, a 2.5-m graded pole was used to estimate understorey density. In each of the four compass directions, the number of 10-cm sections visible from a distance of 15 m, were recorded and converted to a percentage density.
Land-cover analysis
A geographic information system (GIS) was employed to measure the relative extent of different forest types in the immediate surroundings of any given site. A land-cover classification was developed from a combination of land-use data provided by Jari Celulose S.A and a semi-supervised classification of a 2003 Landsat 7 (30-m pixel) image. Buffer rings were created around the central point of each moth sampling site before performing an intersect overlay with layers containing data on land-cover types. Three kilometres was selected as the buffer radius as this exceeds the expected attraction of light-traps (Baker & Sadovy Reference BAKER and SADOVY1978), yet falls within the flight capacity range of large-bodied moths (I. Kitching pers. comm.).
Statistical analyses
Total moth abundances per trap-night were compared between each forest type using one-way ANOVAs with Tukey's post-hoc test. To highlight the variable effectiveness of light-traps in different vegetation types (e.g. the greater light penetration distance in Eucalyptus plantations compared with the dense undergrowth of secondary forests) we repeated these analyses with abundance per trap-night divided by the area effectively surveyed by each light-trap (calculated from our trap-radius measurements).
There is currently no general consensus on an optimal method to deal with the difficult problem of variable attraction radii for light-traps in different forest types (Beck & Linsenmair Reference BECK and LINSENMAIR2006). Human perception of trap-attraction differs from moths so ideally UV light penetration would be measured, Mark-Release-Recapture experiments would be performed and standardization would also account for the three-dimensional catchment of each trap. However, we feel that the simple standardization we performed indicates the possible impacts of variable vegetation density and emphasizes that crude abundances should be interpreted with caution.
For assessing species richness and alpha diversity, the raw catch data were pooled from the three individual traps from both nights at a given site, as sample sizes were insufficient to compare the relative attractions of lamps with different spectral emissions. The observed number of species per site gives a poor and often misleading indication of total richness because of the virtual impossibility of obtaining a complete inventory of species-rich tropical invertebrate communities (Price et al. Reference PRICE, DINIZ, MORAIS and MARQUES1995). More suitable estimates are given by the extrapolation of species accumulation curves or the shape of the species-abundance distribution (Magurran Reference MAGURRAN2004). Rarefaction and non-parametric estimators also provide powerful approaches to estimate species richness (Gotelli & Colwell Reference GOTELLI and COLWELL2001). Sample-based rarefaction curves were therefore produced for the three forest types, and an average of three abundance based estimators (Chao1, Jack1 and ACE) was calculated for each site using EstimateS 7.5 (R. K. Colwell, http://purl.oclc.org/estimates). Species-abundance relationships were examined using standardized Whittaker plots. To assess alpha diversity we calculated Fisher's alpha of the logarithmic series distribution (Fisher et al. Reference FISHER, CORBET and WILLIAMS1943), which has been widely used in tropical moth diversity studies and is relatively independent of sample size (Magurran Reference MAGURRAN2004).
Patterns of community structure and composition among different sites and between forest types were visualized using non-metric multidimensional scaling (NMDS) of a similarity matrix based on the Bray–Curtis index (standardized and square root-transformed). The analyses were performed on both abundance (quantitative) and presence/absence (qualitative) data. Abundance data reveal patterns based primarily on the common species (i.e. community structure), whereas presence/absence data give more weight to the distribution of rare species (i.e. community composition). Differences between forest types were assessed using an analysis of similarities (ANOSIM), and the identity of species contributing most to any differences was determined using an analysis of percentage similarities (SIMPER) (Clarke & Warwick Reference CLARKE and WARWICK2001).
The influence of the forest type surrounding study sites was investigated using a Spearman's correlation of the amount of primary forest within a 3-km buffer against rarefied species richness. The effects of surrounding primary forest plus other environmental parameters (lunar phase, weather conditions and forest structure), as well as the geographic distance between sites on community structure were assessed using the BIOENV and RELATE (analogous to a Mantel test) functions respectively. Community analyses were conducted using Primer 5 (PRIMER-E Ltd., Plymouth, UK).
RESULTS
Moth abundance and species richness
A total of 1848 moth individuals were collected during the 30 trap-nights at 15 sites. These comprised 974 Arctiidae individuals of 231 species, 772 Saturniidae individuals of 65 species, and 102 Sphingidae individuals of 39 species. Of these, 452 Arctiidae and 11 Saturniidae were identified to 160 and six morphospecies respectively. Sample sizes in this short-term study were therefore relatively small, particularly for the Sphingidae. For a full species list see Appendix 1 (supplementary material).
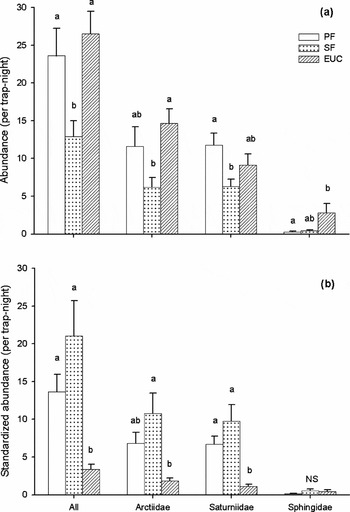
Total abundance of the three moth families ranged from 42 to 264 individuals per site. The abundance patterns for each family closely resemble the pattern for the three families combined where mean abundance per trap-night differed significantly among forest types (Figure 2; ANOVA: F 2,87 = 5.8, P = 0.004), with fewer moths captured in secondary forests than in either primary forests or Eucalyptus plantations. With the overall abundance of trap-night samples standardized in relation to the light-trap areas there were still significant differences among forest types (Figure 2; F 2,87 = 8.6, P < 0.001) but this standardized catch was lower in Eucalyptus plantations than in either primary and secondary forests. Again, this pattern was similar for each family separately, although differences among forest types were not as clear for the Sphingidae.
Abundance (mean ± SE) of Arctiidae, Saturniidae, Sphingidae and all families combined, captured in primary (PF) and secondary forests (SF), and Eucalyptus plantations (EUC) per trap-night (a) and standardized by trap-area surveyed per trap-night (b). Letters above bars denote Tukey's HSD subsets.

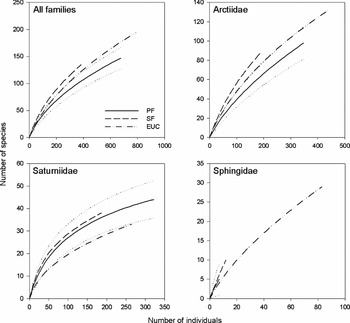
Rarefaction curves for all three families combined showed slightly higher levels of species richness in secondary forest and Eucalyptus plantations than in primary forest, although the differences between all three forest types were only marginally significant (Figure 3). This pattern was driven mainly by the pattern within Arctiidae, while Saturniidae showed a lower species richness in Eucalyptus plantations than primary and secondary forest. There were no differences between forest types for Sphingidae, where the sample sizes were smallest.
Sample-based rarefaction curves for Arctiidae, Saturniidae, Sphingidae and all families combined, sampled in primary (PF) and secondary forests (SF), and Eucalyptus plantations (EUC). X-axis rescaled to show mean number of individuals per sample. Dotted lines show 95% confidence intervals.

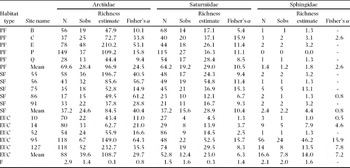
Comparing observed species richness with the average richness estimate shows that a complete inventory was not achieved for any family in any of the three forest types (Table 2). Values for Fisher's alpha did not differ significantly between forest types for the three families combined or within each family (Table 2). No difference between forest types was evident in the proportions of local singletons captured at a site for the three families combined (F 2,12 = 2.2, P = 0.152).
Detailed results of the sampling for Arctiidae, Saturniidae and Sphingidae at the 15 light-trapping sites within primary (PF) and secondary forests (SF), and Eucalyptus plantations (EUC). Site names: B = Bituba, C = Castanhal, E = Estaçao, P = Pacanari, Q = Quaruba. N = number of individuals captured, Sobs = observed species richness, Richness estimate = average of three abundance-based richness estimators (Chao 1, Jack 1 and ACE). Significance was calculated with one-way ANOVAs, F = F-ratio.

Community structure and composition
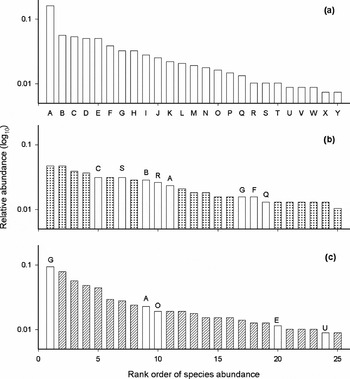
Levels of dominance were similar in the three forest types with long tails of rare species in each case. When examining only the 25 most abundant species in each forest type (Figure 4), secondary forests appear to exhibit the lowest levels of dominance, with most of the dominance in primary forest accounted for by just one species, Evius albicoxae (108 individuals from 677 primary forest captures). However, few of the 25 most abundant species in primary forest were also the most abundant species in secondary forests or Eucalyptus plantations, indicating a high level of community turnover.
Whittaker plots for moth species sampled in primary forest (a), secondary forest (b) and Eucalyptus plantation (c). Steeper plots indicate higher dominance. Open bars in (b) and (c) represent species shared with primary forest, which are labelled with letter codes corresponding to those in (a) and the species list in Appendix 1.

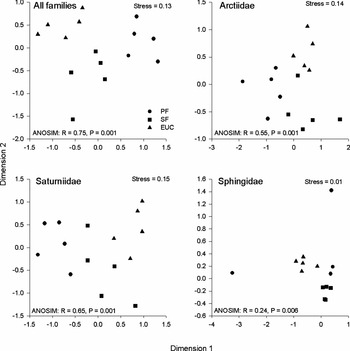
This is supported by the two-dimensional NMDS ordination plot based on abundance data for the three families combined, which shows a distinct grouping of sites into the three forest types (Figure 5; Global ANOSIM: R = 0.75, P = 0.001) and significant differences between each pair of forest types (Pairwise ANOSIM between primary (PF), secondary forest (SF) and Eucalyptus plantation (EUC): PF-SF (i.e. between primary and secondary forests): R = 0.64, P = 0.008; PF-EUC: R = 0.96, P = 0.008; SF-EUC: R = 0.58, P = 0.008). An NMDS plot based on presence/absence data (i.e. examining community composition) shows the same grouping into forest types (Global ANOSIM: R = 0.64, P = 0.001; Pairwise ANOSIM: PF-SF: R = 0.60, P = 0.008; PF-EUC: R = 0.84, P = 0.008; SF-EUC: R = 0.44, P = 0.008). Examining community structure for the three families separately (Figure 5) shows significant differences between all forest types for both Arctiidae (PF-SF: R = 0.32, P = 0.032; PF-EUC: R = 0.82, P = 0.008; SF-EUC: R = 0.51, P = 0.008) and Saturniidae (PF-SF: R = 0.51, P = 0.016; PF-EUC: R = 0.88, P = 0.008; SF-EUC: R = 0.51, P = 0.016), but for Sphingidae only primary forest and Eucalyptus plantation held distinct communities (PF-SF: R = 0.10, P = 0.206; PF-EUC: R = 0.54, P = 0.008; SF-EUC: R = 0.13, P = 0.206).
Biotic NMDS ordination from species abundances of Arctiidae, Saturniidae, Sphingidae and all families combined, from 15 sites in primary (PF) and secondary forest (SF), and Eucalyptus plantation (EUC).

The sampling session had a significant influence on the overall pattern of community structure (ANOSIM: R = 0.24, P = 0.004) but significant differences among forest types remained consistent when analysing the data for each session independently. This was also confirmed by a two-way crossed analysis of similarities that shows a difference in community structure between forest types whilst averaging across sampling rounds (ANOSIM: R = 0.49, P = 0.001).
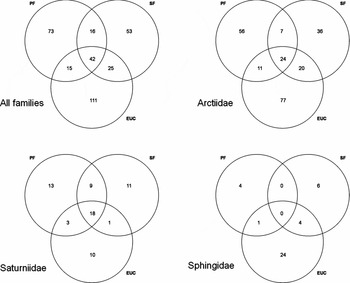
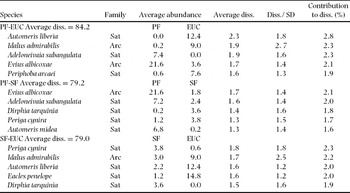
Beta diversity (Bray–Curtis dissimilarity) values were highest between primary forest and Eucalyptus plantations (84%) but all forest types supported largely unique communities (Figure 6), with five species contributing 9–11% of the total dissimilarity in each pairwise forest comparison (Table 3). Primary forest sites were distinct largely due to (1) an abundance of species rarely found in disturbed forest types (Evius albicoxae and Adeloneivia subangulata) and (2) lower relative densities or absence of species common in secondary forests (e.g. Dirphia tarquina and Periga cynira) and Eucalyptus plantations (e.g. Automeris liberia and Idalus admirabilis) (Table 2).
Number of species of Arctiidae, Saturniidae, Sphingidae and all families combined, captured in primary (PF) and secondary forest (SF), and Eucalyptus plantation (EUC).

Breakdown of average community dissimilarity (diss.) between primary (PF) and secondary forests (SF), and Eucalyptus plantations (EUC) into percentage contributions from each species. The five species with the greatest contribution are shown for each habitat-pair comparison in order of decreasing contribution. Arc = Arctiidae, Sat = Saturniidae, Diss./SD = the ratio of dissimilarity to the standard deviation of dissimilarity: higher values indicate a more consistent contribution to differences between communities.

Responses to forest type and landscape structure
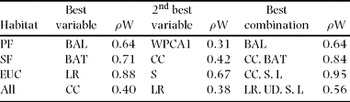
The BIO-ENV analysis identified canopy cover as the best single predictor of moth community structure when examining all forest types combined (Table 4). Basal area of lianas and basal area of live trees were the best predictors in primary and secondary forests respectively, whereas the moth community structure in plantation sites was strongly correlated to the attraction radius of the light-traps, which was significantly negatively correlated with both understorey density (r = –0.862, P < 0.001) and canopy cover (r = –0.921, P < 0.001). The amount of primary forest within 3 km was not identified as a strong predictor in the BIO-ENV analysis and geographic distance between sites was also not related to patterns of community dissimilarity (RELATE: Rho = –0.09, P = 0.738). There was no difference in the lunar phase across forest types (mean fraction of the moon visible per night; F 2,30 = 0.564, P = 0.583).
Results of BIO-ENV analysis showing the relationships of moth community structure and weather, habitat and landscape variables in primary (PF) and secondary forests (SF), Eucalyptus plantations (EUC), and all habitats combined. CC = canopy cover, UD = understorey density, LR = light-trap radius, BAL = basal area of lianas ≥ 5 cm dbh, BAT = basal area of live trees ≥ 10 cm dbh, S = number of saplings <10 cm dbh, L = number of lianas < 5 cm dbh, WPCA1 = weather PCA1 score (degree of cloud cover). Other variables analysed: moon phase, proportion of primary forest in a 3-km radius. ρW = weighted Spearman's.

The main difference in land-cover within 3 km of sample sites in secondary forest and Eucalyptus plantations was the proportion of primary forest, varying from 2.5% to 61.2%. However, there were no significant relationships between the amount of primary forest and moth alpha diversity within either secondary forests or Eucalyptus plantations. Nevertheless, the areas surrounding the two Eucalyptus sites containing the highest levels of alpha diversity (Areas 95 and 127) had the highest proportion of primary forest (Table 1).
DISCUSSION
This is the first study to quantitatively evaluate the diversity patterns and community structure of moth assemblages in a human-dominated landscape in lowland Amazonia. Light-trapping for nocturnal Arctiidae, Saturniidae and Sphingidae in the Jari landscape of Brazilian Amazonia revealed three major patterns: (1) undisturbed primary forests were not distinctly richer or more diverse than secondary forests or Eucalyptus plantations, but each forest type exhibited a distinct community in terms of both structure and composition; (2) species turnover was highest between primary forests and Eucalyptus plantations (highest beta diversity), with secondary forest sites being intermediate; and (3) the three moth families varied in their response to disturbance in terms of species richness but changes in abundance and community structure were relatively consistent.
Abundance and species richness in primary, secondary and plantation forests
Total captures of Sphingidae were much lower than those in the other families sampled in this study (Arctiidae and Saturniidae), and they contributed little to any observed community differences between forest types. However, Sphingidae are not expected to be common in the dark primary forest understorey (Schulze et al. Reference SCHULZE, LINSENMAIR and FIEDLER2001) and may not be sensitive to disturbance (Schulze & Fiedler Reference SCHULZE and FIEDLER2003, cf. Beck et al. Reference BECK, KITCHING and LINSENMAIR2006). The Arctiidae sampled contain very few from subfamilies Ctenuchinae or Lithosiinae but these are likely to be included in the large number identified only to morphospecies.
The lower overall abundance of all three families in secondary forests could be largely attributed to the dilution effect on the effectiveness of light-traps as a result of denser vegetation (Hilt & Fiedler Reference HILT and FIEDLER2005, Ricketts et al. Reference RICKETTS, DAILY, EHRLICH and FAY2001). In contrast, light-traps appear especially effective in the relatively open Eucalyptus plantations in attracting moths from a larger surrounding area and, when standardized by trap-area, abundances were actually much lower in Eucalyptus plantations than secondary or primary forests.
We are unaware of any other studies that have standardized trap catches by area in terms of the effective visibility of light sources but tentatively suggest that, following experimental testing, this could be a useful approach to compare moth abundances in structurally different forest types. For example, Kitching et al. (Reference KITCHING, ORR, THALIB, MITCHELL, HOPKINS and GRAHAM2000) detected a higher abundance of Arctiidae in areas of secondary forest regenerated from cleared tropical rain forest in Queensland, Australia. The disparity between this finding and our raw abundances may be in part due to effective light-trap area since our standardized abundances suggest a similar response. Differences in abundance require careful interpretation however, particularly since light-trapping depends strongly on patterns of moth activity and other external factors (Butler et al. Reference BUTLER, KONDO, BARROWS and TOWNSEND1999, Fiedler & Schulze Reference FIEDLER and SCHULZE2004), including seasonal differences in moth diversity and abundance (Summerville & Crist Reference SUMMERVILLE and CRIST2003), and variability in collection conditions (Gotelli & Colwell Reference GOTELLI and COLWELL2001). Although taxa from different ecological niches can exhibit variable responses to anthropogenic habitat alteration (Stork et al. Reference STORK, SRIVASTAVA, WATT and LARSEN2003) the similar abundance patterns we report here suggest a common response by the Arctiidae and Saturniidae.
In contrast, our species richness results do suggest different responses between families. Conversion to plantation forestry has been reported to have potentially irreversible consequences for biodiversity (Holloway et al. Reference HOLLOWAY, KIRKSPRIGGS and CHEY1992, Kanowski et al. Reference KANOWSKI, CATTERALL and WARDELL-JOHNSON2005), and a reduction in moth species richness in disturbed areas has been observed in a number of tropical forest studies (Beck et al. Reference BECK, SCHULZE, LINSENMAIR and FIEDLER2002, Fiedler & Schulze Reference FIEDLER and SCHULZE2004, Willott Reference WILLOTT1999). Other studies have reported increases in species richness (Hilt & Fiedler Reference HILT and FIEDLER2005) and it is important to note that these studies examined moth families with widely differing life-histories (Geometridae, Sphingidae, Arctiidae, Pyralidae).
A ‘life-history hypothesis’ has been developed to explain the variety of responses between and within families (Beck et al. Reference BECK, KITCHING and LINSENMAIR2006, Janzen Reference JANZEN1984). Income breeders (e.g. Sphingidae: Sphingini and Macroglossini), which feed as adults, are long-lived, strong-flying, and are expected to persist in disturbed environments. Capital breeders (e.g. Saturniidae), which are non-feeding as adults, have a shorter adult life span and are predicted to distribute differentially throughout the landscape, possibly due to differences in mobility and their larval food plant requirements (Beck et al. Reference BECK, KITCHING and LINSENMAIR2006). Our results show some support for this hypothesis since the Sphingidae show no difference in levels of species richness between forest types, as opposed to lower levels for Saturniidae in Eucalyptus plantations. However, care must be taken with this interpretation, particularly because of the small sample sizes for Sphingidae. The higher levels of species richness for Arctiidae in both secondary forest and Eucalyptus plantations may be explained by the wide range of life-history strategies within this family.
Some support for the life-history hypothesis is given by the similar patterns observed in alpha diversity. No significant differences in Fisher's alpha were detected between forest types for the families analysed either together or separately, but there were lower values for Saturniidae in Eucalyptus plantations and higher values for Arctiidae in secondary forests. Other studies of Sphingidae responses following land-use change have also found no clear differences, even with larger sample sizes (Beck et al. Reference BECK, KITCHING and LINSENMAIR2006, Chey et al. Reference CHEY, HOLLOWAY and SPEIGHT1997), but phylogenetic differences between Sphingidae from Asia and America need to be considered here (Beck & Nässig Reference BECK and NÄSSIG2007).
Low sample representation is commonly encountered in tropical insect inventories (Price et al. Reference PRICE, DINIZ, MORAIS and MARQUES1995), and estimates of alpha diversity in primary tropical forest are thus likely to be underestimates, particularly when samples from the forest canopy are not included (Brehm Reference BREHM2007, Dumbrell & Hill Reference DUMBRELL and HILL2005, Willott Reference WILLOTT1999). Stratification is another important factor in determining diversity patterns (Hilt & Fiedler Reference HILT, FIEDLER, Beck, Bendix, Kottke, Makeschin and Mosandl2008) and alpha diversity estimates for Eucalyptus plantations may be positively biased due to higher captures of the often distinct canopy fauna in these families (Brehm Reference BREHM2007, Schulze et al. Reference SCHULZE, LINSENMAIR and FIEDLER2001). The high variability in diversity among individual Eucalyptus sites may potentially be related to variability in the abundance of tourists or vagrants as well, as a result of differences in the effective attraction radii of light-traps (differences in understorey density) or the amount of primary forest in the surrounding landscape.
Turnover in moth communities following land-use change
High levels of dominance by a limited number of species are usually expected in more heavily disturbed sites (DeVries et al. Reference DEVRIES, WALLA and GREENEY1999, Fiedler & Schulze Reference FIEDLER and SCHULZE2004). However, we did not find this pattern for the Jari landscape as species-abundance relationships were very similar among forest types and the total number of captures was primarily dominated by few species in primary forest.
Patterns of both community structure and composition differed clearly among forest types, with similar results from NMDS plots based on both abundance and presence/absence data showing that these patterns are driven by differences in the distribution of both rare and common species. Differences between the two sampling sessions at each site may be related to the adult life span of moths since Saturniidae, for example, have an especially short adult phase (Janzen Reference JANZEN1984). Combined with the synchronized emergence of adults, this could cause a relatively fast temporal turnover in species active within any one forest type. However, the three forest types had consistently distinct communities in each sampling session and, despite some shared species, each forest type supported a largely unique moth fauna.
These clear patterns representing differential distribution across the landscape were maintained when examining the ‘capital breeding’ Saturniidae. Only primary forest and Eucalyptus plantations held distinct communities of the mainly ‘income breeding’ Sphingidae, while the Arctiidae, with a wide range of life-histories, had distinct communities in each forest type. It would be interesting to examine patterns of beta diversity in relation to the ‘life-history hypothesis’ (Beck et al. Reference BECK, KITCHING and LINSENMAIR2006) and further variability in responses may also exist within subfamilies or tribes of each of these families (Hilt & Fiedler Reference HILT and FIEDLER2006) but larger sample sizes would be required.
Moth–environment relationships
Because forest structure variables were intercorrelated, it is difficult to identify the most important factors determining the observed variation in community structure and composition. Although canopy cover and basal area of trees and lianas were identified as important factors, it is more likely that differences in moth assemblages are primarily determined by the distribution of host-plant resources than differences in physical vegetation structure (Summerville & Crist Reference SUMMERVILLE and CRIST2003). Most moths are herbivorous as larvae and many are noted for their pronounced host-specificity (Holloway et al. Reference HOLLOWAY, KIRKSPRIGGS and CHEY1992). Plant diversity or the presence of particular plant species is therefore critical, both for the emergence of adults and for egg-laying, but investigating the relationship between the moth community structure and plant diversity is hindered by the very limited knowledge of resource use by individual moth species (Brehm et al. Reference BREHM, SUSSENBACH and FIEDLER2003).
The strong correlation between light-trap radius and moth species composition in Eucalyptus plantations suggests that trap-effectiveness is a critical factor in plantation sites (Table 4). Forest cover in the immediately surrounding landscape also appears important in determining the local moth community in plantation sites: Area 95 and Area 127 were surrounded by the highest proportion of primary forest within a 3-km radius, contained communities most similar to those in primary forest, and had the highest values of alpha diversity despite the smallest light-trap areas for plantation sites.
CONCLUSION
Although this study shows that both secondary forests and Eucalyptus plantations are relatively species-rich and diverse compared to primary forest, they each hosted a community structure and composition that was markedly distinct from those in primary forest. For example, half (51%) of the species associated with primary forest were entirely absent from the surrounding matrix, as primary forest species became replaced by species likely to be geographically widespread disturbance or edge specialists (Dunn Reference DUNN2004, Horner-Devine et al. Reference HORNER-DEVINE, DAILY, EHRLICH and BOGGS2003).
The relatively high levels of species richness and diversity recorded in Eucalyptus plantations and secondary forest may be explained by the landscape heterogeneity, which is known to increase the biodiversity value of plantations (Kanowski et al. Reference KANOWSKI, CATTERALL and WARDELL-JOHNSON2005, Lindenmayer & Hobbs Reference LINDENMAYER and HOBBS2004), forest fragments (Shahabuddin & Terborgh Reference SHAHABUDDIN and TERBORGH1999), secondary forests and the wider countryside (Horner-Devine et al. Reference HORNER-DEVINE, DAILY, EHRLICH and BOGGS2003). This study provides some support for the life-history hypothesis (Beck et al. Reference BECK, KITCHING and LINSENMAIR2006) but more detail, including information on variability within families, is required to examine how species traits may interact to determine reactions to disturbance (Koh et al. Reference KOH, SODHI and BROOK2004, Mattila et al. Reference MATTILA, KAITALA, KOMONEN, KOTIAHO and PÄIVINEN2006). Finally, comparisons with patterns from other taxa are urgently needed to allow greater understanding of the complex responses of biodiversity to landscape-level habitat changes.
ACKNOWLEDGEMENTS
We thank the Brazilian Ministerio de Ciencias e Tecnologia (CNPq) and Ministerio do Meio Ambiente (MMA-IBAMA) for permission to conduct this study. We are grateful to Orsa Florestal and Jari Celulose for permission to work on their landholding and logistical support throughout the project. Specimen preparation and identification was performed at INPA with the assistance of Simone Ferreira Trovisco, Francisco Felipe Xavier Filho and Gilcélia Melo Lourido. Additional help was provided by Ian Kitching from the Natural History Museum, London. Philip Judge prepared Figure 1. We thank Jan Beck, Keith Summerville and two anonymous reviewers for constructive comments on earlier versions of the manuscript. The project was funded by the UK Government Darwin Initiative, Conservation International, and a NERC postgraduate studentship to JH. This is publication number 20 of the Land-Use Change and Amazonian Biodiversity project (see www.tropicalforestresearch.org).
Species list and abundances of Arctiidae, Saturniidae and Sphingidae from 30 nights of light-trapping at five primary forest (PF), five secondary forest (SF) and five Eucalyptus plantation (EUC) sites within the Jari landscape, northern Brazilian Amazonia. Code = label for species appearing in Figure 4.