1. Introduction
It is well known that the sound system of the native language (L1) influences how non-native listeners perceive sounds and recognize words in a second language (L2). One particular approach that seeks to explain L1 effects on L2 speech perception and word recognition is the cue-weighting theory of speech perception. According to this theory, speech perception is multidimensional: Listeners use a variety of acoustic cues simultaneously to perceive sound contrasts, but weigh these cues as a function of their informativeness for signaling contrasts in the L1; because cues are weighed differently across languages, L1 effects on the perception of L2 sound contrasts are attributed to non-native listeners’ transfer of their cue weightings from the L1 to the L2 (e.g., Francis, Baldwin & Nusbaum, Reference Francis, Baldwin and Nusbaum2000; Francis & Nusbaum, Reference Francis and Nusbaum2002; Holt & Lotto, Reference Holt and Lotto2006; Ingvalson, Holt & McClelland, Reference Ingvalson, Holt and McClelland2011; Iverson, Kuhl, Akahane-Yamada, Diesch, Tohkura, Kettermann & Siebert, Reference Iverson, Kuhl, Akahane-Yamada, Diesch, Tohkura, Kettermann and Siebert2003). For example, the difficulty that Japanese-speaking L2 learners of English experience in their perception of the English /l/-/ɹ/ contrast has been attributed to their greater reliance on the second-formant (F2) cue than on the third-formant (F3) cue, with F2 being an important cue for encoding the Japanese liquid but F3 being the critical cue for distinguishing /l/-/ɹ/ in English (Ingvalson et al., Reference Ingvalson, Holt and McClelland2011; Iverson et al., Reference Iverson, Kuhl, Akahane-Yamada, Diesch, Tohkura, Kettermann and Siebert2003). Non-native listeners’ successful perception of sound contrasts in the L2 is thus predicted to be contingent on their learning of the appropriate cue weighting for that contrast.
The cue-weighting theory of speech perception can explain L1 effects on the perception of L2 segmental and suprasegmental contrasts (e.g., Francis et al., Reference Francis, Baldwin and Nusbaum2000; Francis, Ciocca, Ma & Fenn, Reference Francis, Ciocca, Ma and Fenn2008; Francis & Nusbaum, Reference Francis and Nusbaum2002; Holt & Lotto, Reference Holt and Lotto2006; Ingvalson et al., Reference Ingvalson, Holt and McClelland2011; Iverson et al., Reference Iverson, Kuhl, Akahane-Yamada, Diesch, Tohkura, Kettermann and Siebert2003; Qin, Chien & Tremblay, Reference Qin, Chien and Tremblay2016). However, no study (to our knowledge) has yet examined whether this theory can also adequately explain L1 effects on the use of acoustic cues in L2 speech segmentation. Unlike the perception of sound contrasts, locating word boundaries in continuous speech requires listeners to associate particular cues in the speech signal to the left or right edge of the word, and use this information to recognize the target word (e.g., ham) over competitor words that overlap with it segmentally but differ from it in their initial or final boundary (e.g., hamster, hamstring, Hamlet) (e.g., Salverda, Dahan & McQueen, Reference Salverda, Dahan and McQueen2003; Salverda, Dahan, Tanenhaus, Crosswhite, Masharov & McDonough, Reference Salverda, Dahan, Tanenhaus, Crosswhite, Masharov and McDonough2007). The processes involved in speech segmentation are likely to differ from those involved in the perception of segmental and suprasegmental contrasts. This raises the question of whether the cue-weighting theory of speech perception can be successfully extended to explain L1 effects in L2 speech segmentation.
If applied to the study of L2 speech segmentation, the cue-weighting theory of speech perception would predict that non-native listeners would be more likely to attend to cues that are important for signaling lexical identity in the L1 than to cues that are not, even if these cues are used differently in the L1 and L2 (e.g., to signal a contrast between two words in the L1 and to locate a word boundary in the L2). In other words, this theory would predict that the greater the functional weight of a particular cue in the L1, the more likely non-native listeners would be to learn the association between this same cue and a different function (and word boundary) in the L2. Such a finding would not only extend the cue-weighting theory of speech perception to the realm of speech segmentation, but also have the broader implication that acoustic cues that serve one function in the L1 (e.g., to establish a contrast between two different words) can be reallocated to a different function in the L2 (i.e., to locate word boundaries in continuous speech).
The present study is the first to shed light on this question. It does so by examining whether English- and Dutch-speaking L2 learners of French who were matched in French proficiency and experience differ in their use of fundamental-frequency (F0) cues to word-final boundaries in French. Unlike English and Dutch, French does not have lexical stress; it only has phrasal prominence, with the final non-reduced syllable of the last word in the Accentual Phrase (AP) ending with an F0 rise (and being lengthened) in non-utterance-final position (e.g., Jun & Fougeron, Reference Jun, Fougeron and Botinis2000, Reference Jun and Fougeron2002; Welby, Reference Welby2006). By contrast, in English and Dutch, the majority of words are stressed on the initial syllable (e.g., Cutler & Carter, Reference Cutler and Carter1987; Schreuder & Baayen, Reference Schreuder and Baayen1994; Vroomen & de Gelder, Reference Vroomen and de Gelder1995), and pitch-accented words with initial stress are realized with an F0 rise on the initial syllable (Beckman, Reference Beckman1986; Gussenhoven, Reference Gussenhoven and Jun2004). Hence, French differs from English and Dutch not only in not having lexical stress, but also in the F0 rise signaling word-final (rather than word-initial) boundaries (for words in non-utterance-final, AP-final position). This means that both English- and Dutch-speaking L2 learners of French must learn to associate the F0 rise to word-final rather than word-initial boundaries in order to use this F0 rise in the segmentation of French speech.
Crucially, English and Dutch differ in the relative weight of F0 cues to lexical identity. In English, stress is often signaled by the contrast between full and reduced vowels, with English listeners relying on this segmental information to infer stress placement and, consequently, showing reduced sensitivity to stress in the absence of this vowel quality information (e.g., Bond & Small, Reference Bond and Small1983; Cutler, Reference Cutler1986; Cutler & Clifton, Reference Cutler, Clifton, Bouma and Bouwhuis1984; Fear, Cutler & Butterfield, Reference Fear, Cutler and Butterfield1995; Small, Simon & Goldberg, Reference Small, Simon and Goldberg1988). By contrast, stress in Dutch is not as strongly correlated with segmental cues, with Dutch listeners making better use of prosodic cues such as F0, duration, and intensity than English listeners to recognize English words (Experiment 3 in Cooper, Cutler & Wales, Reference Cooper, Cutler and Wales2002). Given the greater functional weight of F0 cues for signaling lexical identity in Dutch as compared to English, we predict that Dutch-speaking L2 learners of French will make greater use of F0 cues to word-final boundaries in French than would English-speaking L2 learners of French (in line with Cooper et al., Reference Cooper, Cutler and Wales2002), even if both English and Dutch differ from French in how F0 signals word boundaries.
The present study newly tests this prediction through a replication of Tremblay, Broersma, Coughlin, and Choi (Reference Tremblay, Broersma, Coughlin and Choi2016) but with Dutch-speaking L2 learners of French. Tremblay et al. (Reference Tremblay, Broersma, Coughlin and Choi2016) used a visual-world eye-tracking experiment to investigate whether the prosodic similarity between Korean and French would lead Korean listeners to assimilate the prosodic system of their L2 French to that of their L1 making it more difficult for them to use F0 cues to word-final boundaries in French (F0 cues to word-final boundaries peak slightly later in French than in Korean; for more details, see Tremblay et al., Reference Tremblay, Broersma, Coughlin and Choi2016). A comparison group of English-speaking L2 learners of French who were matched in French proficiency and experience to the Korean-speaking L2 learners of French also completed the experiment. The results showed that unlike the English listeners, the Korean listeners could not use F0 cues to word-final boundaries in French. Since this experiment was successful at capturing L1 effects on the use of L2 speech segmentation cues (though with the purpose of testing a different theory), we use it again to investigate whether Dutch listeners make greater use of F0 cues to word final-boundaries in French as compared to English listeners. In this study as well, we matched our English- and Dutch-speaking L2 learners of French in French proficiency and experience. As a result, the group of English listeners tested here, though partially overlapping, differs from that tested in Tremblay et al. (Reference Tremblay, Broersma, Coughlin and Choi2016).
2. Methods
2.1. Participants
Participants included 25 native French listeners (mean age: 26.4, SD: 4.6), 27 English-speaking L2 learners of French (mean age: 21.6, SD: 3.4), and 27 Dutch-speaking L2 learners of French (mean age: 20.2, SD: 2.3). The native French listeners in this study are the same as those in Tremblay et al. (Reference Tremblay, Broersma, Coughlin and Choi2016). Of the 27 English-speaking L2 learners of French examined in this study, 12 were included in Tremblay et al. (Reference Tremblay, Broersma, Coughlin and Choi2016).Footnote 1 The English listeners were undergraduate or graduate students at a university in the US who either majored in French or identified themselves as having functional proficiency in French. The Dutch listeners were undergraduate students at a university in The Netherlands who majored in French or who identified themselves as having functional proficiency in French. All participants had normal or corrected-to-normal vision, and no participants reported any hearing impairment. All participants received monetary compensation or course credit in exchange for their time.
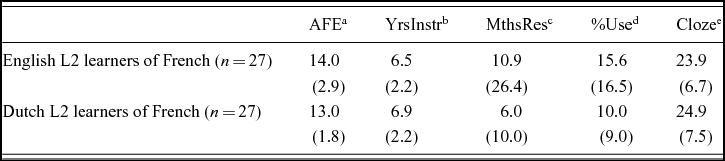
The L2 learners filled out a language background questionnaire and completed a cloze test that would assess their proficiency in French (Tremblay, Reference Tremblay2011). Their language background information and proficiency scores are presented in Table 1. The English and Dutch listeners were matched in both their experience with French and their proficiency in French. Independent-samples t-tests do not reveal significant differences between the two groups on any of the variables summarized in Table 1 (p > .128).Footnote 2
L2 learners’ language background information and proficiency scores.

Note. Mean (standard deviation)
aAge of First Exposure to French
bNumber of Years of Formal Instruction on French
cMonths of Residence in a French-speaking Environment
dPercent Weekly Use of French
eCloze test results out of a maximum of 45
The Dutch listeners also had knowledge of English. On a scale from 1 to 4 (1 = beginner, 2 = intermediate, 3 = advanced, 4 = near-native), they rated their English proficiency as similar to their French proficiency (English: mean: 2.9, SD: 0.6; French: mean: 2.7, SD: 0.8; t < |1|).
2.2. Materials
The visual-world eye-tracking experiment that participants completed is exactly that reported in Tremblay et al. (Reference Tremblay, Broersma, Coughlin and Choi2016). The stimuli came from Tremblay, Coughlin, Bahler, and Gaillard (Reference Tremblay, Coughlin, Bahler and Gaillard2012, Experiment 2). Participants heard sentences in which a competitor word was created for the sequence of a monosyllabic target word and the first syllable of the word following it (e.g., chalet ‘cabin’ in chat lépreux ‘leprous cat’). The monosyllabic word was recorded such that it would be in either AP-final or AP-internal position. When the monosyllabic word was in AP-final position, the competitor word crossed an AP boundary (e.g., [[Le chat] ap [lépreux et légendaire]AP]PP s'endort doucement ‘The leprous and legendary cat is slowly falling asleep’); we will thus refer to this condition as the “across-AP” condition. When the monosyllabic word was in AP-internal position, the competitor word did not cross an AP boundary (e.g., [[Le chat lépreux]AP]PP s'endort doucement ‘The leprous cat is slowly falling asleep’); we will refer to this condition as the “within-AP” condition. Monosyllabic words recorded in AP-final position ended with an F0 rise and were lengthened; monosyllabic words in AP-internal position had a relatively flat F0 and were not lengthened (for details, see Tremblay et al., Reference Tremblay, Coughlin, Bahler and Gaillard2012). These two different conditions allowed us to elicit two natural F0 contours (one with and one without an F0 rise) over the same critical words (e.g., chat lépreux).
The auditory stimuli were recorded by a female native speaker of French from Bordeaux (France) using a Marantz PMD 750 solid state recorder and head-mounted condenser microphone. The F0 contours of the stimuli were then resynthesized such that the F0 of the first four syllables was swapped between the across-AP and within-AP conditions (for details on the resynthesis and for an acoustic analysis of the stimuli, see Tremblay et al., Reference Tremblay, Coughlin, Bahler and Gaillard2012). This manipulation resulted in four conditions: Across-AP conditions with and without F0 rise as a cue to word-final boundaries, and within-AP conditions with and without F0 rise as a cue to word final boundaries.
The experiment included a total of 32 experimental stimuli randomly interspersed with the 69 filler stimuli, eight of which were used in the practice session. The participants were assigned to one of four lists and saw each experimental item in only one condition (total: 8 items per condition; for the complete list of experimental items, see Tremblay et al., Reference Tremblay, Coughlin, Bahler and Gaillard2012, Experiment 2).
Participants saw four words in the visual display and clicked on the word they thought they heard. In the experimental stimuli, the display included the target (monosyllabic) word (e.g., chat), the competitor (disyllabic) word (e.g., chalet), and two distracter words. The pairs of distracter words also overlapped in their segmental content; they were either both monosyllabic (e.g., clé ‘key’ and craie ‘chalk’; 6 items), both disyllabic (e.g., chemin ‘path’ and cheval ‘horse’; 6 items), or one of each (e.g., prince ‘prince’ and principe ‘principle’; 20 items), and they did not overlap segmentally or semantically with the target and competitor words. Because the words across the four prosodic conditions are identical, L2 learners’ familiarity with the words in the display cannot explain any prosodic effect that we may find (for discussion, see Tremblay et al., Reference Tremblay, Coughlin, Bahler and Gaillard2012). Since not all the experimental words were easily imageable, the words in the visual display were presented orthographically (for a validation of this method, see Huettig & McQueen, Reference Huettig and McQueen2007; McQueen & Viebahn, Reference McQueen and Viebahn2007). This also facilitated the task for the L2 learners, who may not have been equally familiar with all the words in the experiment.
2.3. Procedures
Experiment Builder software (SR Research) was used to create and administer the eye-tracking experiment, and Eyelink software (SR Research) was used to monitor participants’ eye movements. Eye movements were recorded at a sampling rate of either 250 Hz or 1000 Hz, depending on the location of the data collection. The stimuli were heard with an ASIO-compatible sound card, ensuring accurate audio timing in relation to the recording of eye movements.
At the beginning of the experiment, the eye tracker was calibrated using the participants’ right eye. If the eye tracker could not be successfully calibrated with the participant's right eye, his/her left eye was instead used. Following this initial calibration, the eye-tracking experiment began first with a practice session (8 trials) and then with the main experiment (93 trials). Each trial proceeded as follows: (i) the participants saw four orthographic words in a (non-displayed) 2 × 2 grid for 4,000 milliseconds; (ii) as the words disappeared, a fixation cross appeared in the middle of the screen for 500 milliseconds; (iii) as the fixation cross disappeared, the four words reappeared on the screen in their original position and the auditory stimulus was heard (synchronously) over headphones. The participants were instructed to click on the target word with the mouse as soon as they heard the target word in the stimulus. The participants’ eye movements were measured from the onset of the target word (e.g., the onset of chat). The trial ended with the participants’ response, with an inter-trial interval of 1,000 milliseconds.
The 32 experimental and 61 filler trials were presented in four blocks (23 trials per block, except for one block that contained 24 trials). Each block contained 8 experimental trials (2 from each condition). The order of the experimental and filler trials within a block and the order of blocks were randomized across participants. The participants were offered to take a break after the second block. The eye tracker was calibrated at the beginning of each block and whenever it was necessary during the experiment. The experiment lasted approximately 15–20 minutes.
2.4. Data Analysis and Predictions
Experimental trials that received distracter responses (rather than target or competitor responses) or no response, or for which eye movements could not reliably be tracked, were excluded from the analyses. This resulted in the exclusion of 4.9% of the trials (2.0% for French listeners, 0.8% for Dutch listeners, and 2.1% for English listeners). For the remaining trials, we analyzed the participants’ eye movements in each of the four regions of interest, corresponding to the four orthographic words on the screen.
Proportions of fixations to the target, competitor, and distracter words were extracted in 8-ms time windows from the onset of the target word to 1,500 ms post-target-word onset. To better capture any effect of lexical competition due to the manipulated F0 cues, statistical analyses were conducted on the difference between target and competitor fixations (i.e., competitor fixations were subtracted from target fixations, henceforth referred to as the “differential proportions of fixations”). This difference reduces any difference in the speed with which participants begin to fixate both target and competitor words, thus making the data more comparable between native listeners and L2 learners.
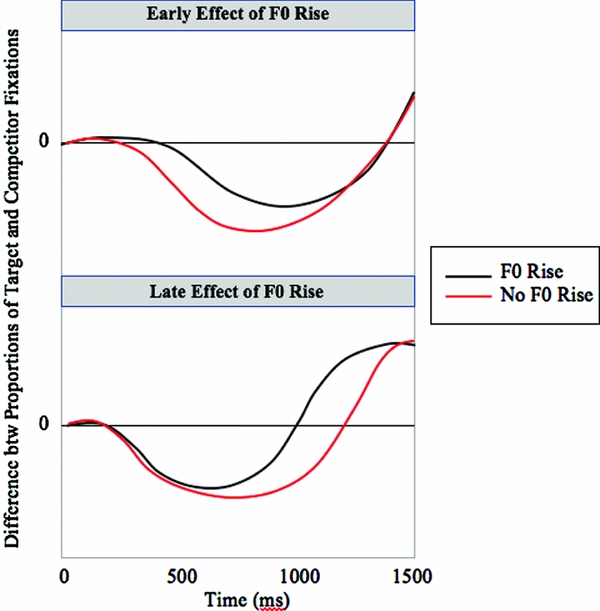
Listeners’ differential proportions of fixations were modeled using growth curve analysis (GCA; Mirman, Reference Mirman2014; Mirman, Dixon & Magnuson, Reference Mirman, Dixon and Magnuson2008). GCA enables researchers to model the curvilinear relationship between proportions of fixations and time. It is a more appropriate method for analyzing eye fixations when different groups of participants show effects of the manipulated variable at different points in time (as do our participants). It is also less subjective than a time-window analysis in that it models the shape of participants’ fixation line over the entire trial rather than at arbitrary points in time. If listeners’ speech segmentation benefits from the presence of F0 cues to word-final boundaries early on in the word recognition process, their differential fixation line (e.g., the difference between their proportions of fixations to chat and chalet) should show a less convex (i.e., ∪) shape and/or more of a reverse ‘s’ (i.e., ~) shape in the presence of F0 cues than in the absence of such cues (top panel of Figure 1); if listeners’ speech segmentation benefits from the presence of F0 cues to word-final boundaries later on in the word recognition process, their differential fixation lines should show a less convex and/or more canonical ‘s’ (i.e., ∽) shape (bottom panel of Figure 1).Footnote 3 The analyses in this study thus included linear, quadratic, and cubic time polynomials to model the slope, convex shape, and ‘s’ shape (respectively) of the fixation lines. Following Mirman (Reference Mirman2014), the polynomials were centered and orthogonalized prior to entering the analyses.
Predicted difference between participants’ proportions of target and competitor fixations if listeners use F0 rise as a cue to word-final boundaries early (top panel) or late (bottom panel) in the word recognition process

For us to conclude that our manipulation of F0 had an effect on participants’ fixations, the GCA must show both an effect of F0 and an interaction between it and at least one of the time polynomials. Such an interaction indicates that the shape of participants’ fixation line differs for the two F0 conditions. Finding only an effect of F0 and no interaction between it and any of the time polynomials indicates that fixation proportions are higher or lower in one condition than in another, but the shape of participants’ fixation lines is similar across the two conditions. Hence, such an effect could not be attributed to the speech signal (i.e., such an effect would be better interpreted as a baseline effect; for discussion, see Barr, Gann & Pierce, Reference Barr, Gann and Pierce2011).
The GCAs were run on participants’ differential proportions of fixations using the lme4 package in R (Bates et al., 2015). The GCAs were conducted separately for the across-AP and within-AP conditions (as they differed in the timing of disambiguation of the target word). For the sake of clarity, we first present the analysis of the individual groups’ fixations. These analyses included F0 (no F0 rise, F0 rise), time (linear, quadratic, cubic), and their interaction as fixed effects, with the no F0 rise condition as baseline (since the time polynomials were centered, any effect of F0 is to be interpreted at the midpoint of the time continuum). A backward-fitting function from the package LMERConvenienceFunctions (Tremblay & Ransijn, Reference Tremblay and Ransijn2015) was used to identify the model that accounted for significantly more of the variance than all simpler models, as determined by log-likelihood ratio tests; only the results of the best model are presented, with the effects in this model being interpreted in reference to an adjusted alpha level of .0167 (Bonferroni correction). Next, we summarize analyses that tested three-way interactions between the effects of F0, time, and L1, first with French listeners as baseline (all listeners), and second with English listeners as baseline (L2 listeners only). These analyses are presented in detail in the Supplementary Materials (Supplementary Materials). Following Mirman (Reference Mirman2014), all analyses included participant as random intercept and the time polynomials as random slopes for the participant variable, thus modeling a different line shape for each participant.Footnote 4
If F0 cues to word-final boundaries enhance speech segmentation, the GCAs should yield both an effect of F0 rise (with larger differential proportions of fixations in the condition with an F0 rise than in the condition without such a rise) and an interaction between this F0 rise and at least one of the three time polynomials, indicating that the fixation lines in the condition with vs. without an F0 rise have different shapes. If participants’ L1 modulates their ability to use this F0 rise, the GCAs should yield three-way interactions between F0 rise, L1, and at least one of the time polynomials. We predict such an interaction, with Dutch listeners showing greater reliance on F0 rise as a cue to word-final boundaries in French as compared to English listeners.
3. Results
3.1. Across-AP Condition
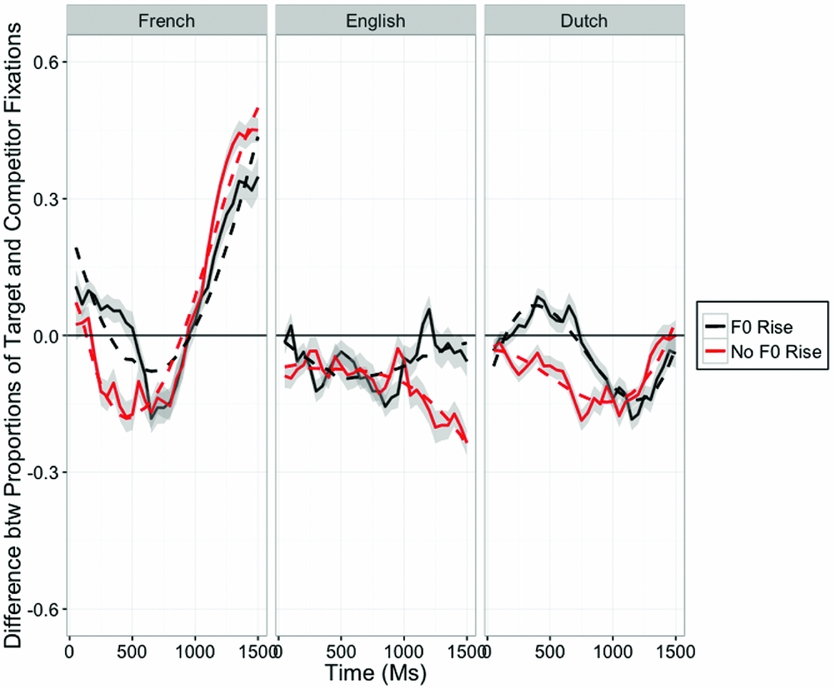
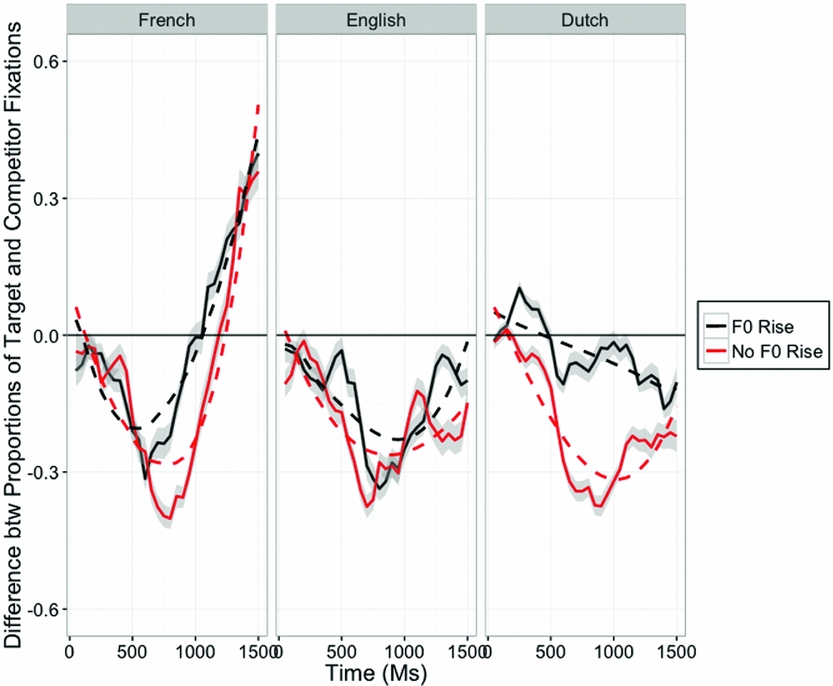
Figure 2 presents participants’ differential proportions of fixations in the across-AP condition: Differential proportions of fixations above 0 mean that participants looked at the target more than the competitor, and differential proportions of fixations below 0 mean that participants looked at the competitor more than the target; the solid lines represent the actual data; the dashed lines represent the predicted differential proportions of fixations according to the GCAs run on the individual groups’ results (presented next).
Difference between participants’ proportions of target and competitor fixations in the across-AP condition; the shading represents one standard error above and below the mean; a positive difference in fixations means that participants had higher proportions of fixations to the target than to the competitor; a negative difference in fixations means that participants had lower proportions of fixations to the target than to the competitor; the solid lines represent participants’ differential proportions of fixations; the dashed lines represent participants’ predicted differential proportions of fixations according to the GCA run on the individual groups

French listeners
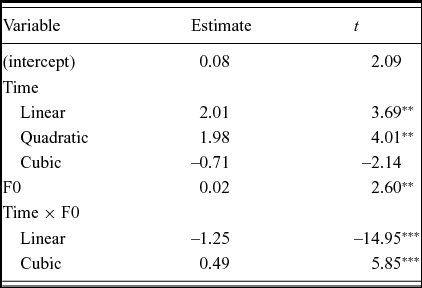
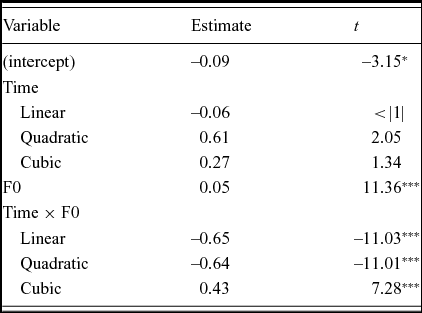
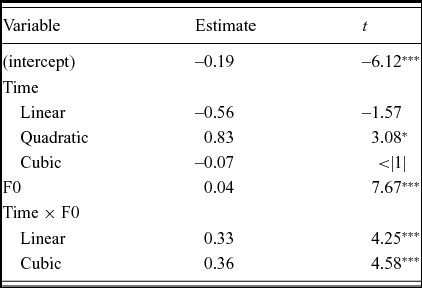
The GCA with the best fit for French listeners’ differential proportions of fixations in the across-AP condition included all time polynomials, F0, and the interaction between F0 and the linear and cubic time polynomials. The results of this GCA are presented in Table 2.Footnote 5
Growth curve analysis on French listeners’ differential proportions of fixations in the across-AP condition.

Note. α = .0167, * = p < .0167, ** = p < .003, *** = p < .0003; n = 25; 9,236 observations; baseline: condition without an F0 rise
The positive estimate for the linear and quadratic time polynomials indicate that French listeners’ fixations in the condition without an F0 rise had an ascending and convex (i.e., ∪) shape. The positive estimate for the effect of F0 means that French listeners had higher differential proportions of fixations in the condition with an F0 rise than in the condition without an F0 rise. Importantly, the negative estimate for the interaction between F0 and the linear time polynomial and the positive estimate for the interaction between F0 and the cubic time polynomial mean that French listeners’ fixation line had a less ascending and more reverse ‘s’ (i.e., ~) shape in the condition with an F0 rise than in the condition without an F0 rise.
These results can be seen in Figure 2 (left panel): In the presence of an F0 rise, French listeners showed higher differential proportions of fixations, thus less lexical competition, during the first 750 ms post target-word onset, after which fixations somewhat reversed between the two conditions. The less ascending and more reverse ‘s’ shape of the fixation line in the condition with an F0 rise can thus be attributed to this early effect of F0. Thus, in the across-AP condition, the presence of an F0 rise modulated French listeners’ fixation early on in the word-recognition process by decreasing lexical competition and increasing the target word activation.
English listeners
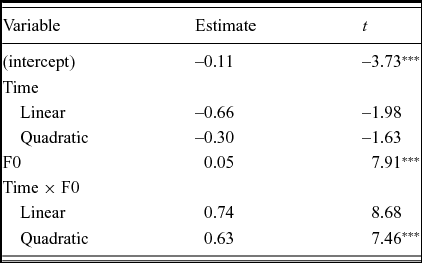
The GCA with the best fit for English listeners’ differential proportions of fixations in the across-AP condition included the linear and quadratic time polynomials, F0, and the interactions between the linear and quadratic time polynomials and F0. The results of this GCA are presented in Table 3.
Growth curve analysis on English listeners’ differential proportions of fixations in the across-AP condition.

Note. α = .0167, * = p < .0167, ** = p < .003, *** = p < .0003; n = 27; 10,028 observations; baseline: condition without an F0 rise
The negative estimate for the intercept indicates that the English listeners’ differential proportion of fixations in the condition without an F0 rise was lower than 0. The positive estimate for F0 indicates that English listeners showed higher differential proportions of fixations in the condition with an F0 rise than in the condition without an F0 rise. Crucially, the positive estimates for the interactions between F0 and the linear and quadratic time polynomials mean that English listeners’ fixation line was more ascending and more convex (i.e., ∪) in the condition with an F0 rise than in the condition without an F0 rise.
These results are evident in Figure 2 (middle panel): English listeners’ differential proportions of fixations in the two F0 conditions were similar up until 1,000 ms post target-word onset, after which English listeners showed higher differential proportions of fixations, thus less lexical competition, in the condition with an F0 rise than in the condition without an F0 rise. The more ascending and more convex fixation line in the condition with an F0 rise can thus be attributed to this late effect of F0.Footnote 6 This suggests that the F0 rise also modulated English listeners’ fixations in the across-AP condition, but it did so later on in the word recognition process.
Dutch listeners
The GCA with the best fit for Dutch listeners’ differential proportions of fixations in the across-AP condition included all simple effects and all interactions. The results of this GCA are presented in Table 4.
Growth curve analysis on Dutch listeners’ differential proportions of fixations in the across-AP condition.

Note. α = .0167, * = p < .0167, ** = p < .003, *** = p < .0003; n = 27; 10,152 observations; baseline: condition without an F0 rise
The negative estimate for the intercept indicates that Dutch listeners’ differential proportion of fixations in the condition without an F0 rise was below 0. The positive estimate for F0 indicates that the Dutch listeners showed greater differential proportions of fixations in the condition with an F0 rise than in the condition without an F0 rise. Importantly, the negative estimates for the interaction between F0 and the linear and quadratic time polynomials and the significant positive estimate for the interaction between F0 and the cubic time polynomial mean that Dutch listeners’ fixation line had a more descending, less convex (i.e., ∪), and more reverse ‘s’ (i.e., ~) shape in the condition with an F0 rise than in the condition without an F0 rise.
These results can be observed in Figure 2 (right panel): Up until 1,000 ms post-target-word onset, Dutch listeners showed greater differential proportions of fixations in the condition with an F0 rise than in the condition without an F0 rise, after which fixations in the two conditions became more similar. The more descending, less convex, and more reverse ‘s’ shape of the fixation line in the condition with an F0 rise can therefore be attributed to this early effect of F0. Thus, in the across-AP condition, the F0 rise modulated Dutch listeners’ fixations, but did so early on in the word recognition process.
All listeners
The GCA with the best fit for participants’ differential proportions of fixations in the across-AP condition included all simple effects and all interactions. The results of this GCA and the interpretation of its estimates can be found in the Supplementary Materials (Supplementary Materials, Table SM1). Among other effects, the GCA revealed significant three-way interactions between L1 (English and Dutch), F0, and the time polynomials, confirming that the L2 learners differed from the French listeners in the effect of F0 they showed over time in the across-AP condition.
L2 listeners
The GCA on L2 learners’ results with the best fit included all simple effects and all interactions. The results of this GCA and the interpretation of its estimates can be found in the Supplementary Materials (Supplementary Materials, Table SM2). This GCA revealed significant three-way interactions between L1, F0, and all three time polynomials, indicating that English and Dutch listeners differed from each other in the effect of F0 they showed over time.
3.2. Within-AP Condition
Figure 3 presents participants’ differential proportions of fixations in the within-AP condition. Again, differential proportions of fixations above 0 mean that participants looked at the target more than the competitor, and differential proportions of fixations below 0 mean that participants looked at the competitor more than the target. The solid lines represent the actual data; the dashed lines represent the predicted differential proportions of fixations according to the GCAs run on the individual groups’ results (presented next).
Difference between participants’ proportions of target and competitor fixations in the within-AP condition; the shading represents one standard error above and below the mean; a positive difference in fixations means that participants had higher proportions of fixations to the target than to the competitor; a negative difference in fixations means that participants had lower proportions of fixations to the target than to the competitor; the solid lines represent participants’ differential proportions of fixations; the dashed lines represent participants’ predicted differential proportions of fixations according to the GCA run on the individual groups

French listeners
The GCA with the best fit for French listeners’ differential proportions of fixations in the within-AP condition included all simple effects and all interactions. The results of this GCA are presented in Table 5.Footnote 7
Growth curve analysis on French listeners’ differential proportions of fixations in the within-AP condition.

Note. α = .0167, * = p < .0167, ** = p < .003, *** = p < .0003; n = 25; 9,188 observations; baseline: condition without an F0 rise
The positive estimate for the quadratic time polynomial means that French listeners’ fixation line in the condition without an F0 rise had a convex (i.e., ∪) shape. The positive estimate for F0 indicates that French listeners showed higher differential proportions of fixations in the condition with an F0 rise than in the condition without an F0 rise. Importantly, the positive estimate for the interaction between F0 and the linear time polynomial and the significant negative estimates for the interaction between F0 and the quadratic and cubic time polynomials indicate that French listeners’ fixation line was more ascending, less convex, and more canonical ‘s’ (i.e., ∽) shaped in the condition with an F0 rise than in the condition without an F0 rise.
These results can be seen in Figure 3 (left panel): From 500 ms post-target-word onset, French listeners showed higher differential proportions of fixations, thus less lexical competition, in the presence of an F0 rise than in the absence of an F0 rise. The less ascending, less convex, and more canonical ‘s’ shape of the fixation line in the condition with an F0 rise can thus be attributed to the effect of F0 emerging from 500 ms. Thus, in the within-AP condition, the presence of an F0 rise modulated French listeners’ fixations later on in the word recognition process, resulting in decreased lexical competition and increased target-word activation.
English listeners
The GCA with the best fit for English listeners’ differential proportions of fixations in the within-AP condition included all simple effects and all interactions except the interaction between F0 and the cubic time polynomial. The results of this GCA are presented in Table 6.
Growth curve analysis on English listeners’ differential proportions of fixations in the within-AP condition.

Note. α = .0167, * = p < .0167, ** = p < .003, *** = p < .0003; n = 27; 10,122 observations; baseline: condition without an F0 rise
The negative estimate for the intercept means that English listeners’ differential proportion of fixations in the condition without an F0 rise was below 0. The positive estimate for the quadratic time polynomial indicates that English listeners’ fixation line in the condition without an F0 rise had a convex (i.e., ∪) shape. The positive estimate for F0 indicates that English listeners showed greater differential proportions of fixations in the condition with an F0 rise than in the condition without an F0 rise. Crucially, the positive estimates for the interactions between F0 and the linear and cubic time polynomials mean that English listeners’ fixation line was more ascending and more reverse ‘s’ (i.e., ~) shaped in the condition with an F0 rise than in the condition without an F0 rise.
These results can be observed in Figure 3 (middle panel): From approximately 300 to 700 ms post target-word onset, English listeners’ differential proportions of fixations are slightly higher in the condition with an F0 rise than in the condition without an F0 rise, with this difference disappearing at approximately 700 ms, reappearing at approximately 1,200 ms, and becoming much larger thereafter. The more ascending and more reverse ‘s’ shape of the fixation line in the condition with an F0 rise can thus be attributed to the weak effect of F0 emerging early on and reappearing towards the end of the trial.Footnote 8 This suggests that F0 modulated English listeners’ differential proportions of fixations in the within-AP condition, with the effect of F0 being more robust later in the word recognition process.
Dutch listeners
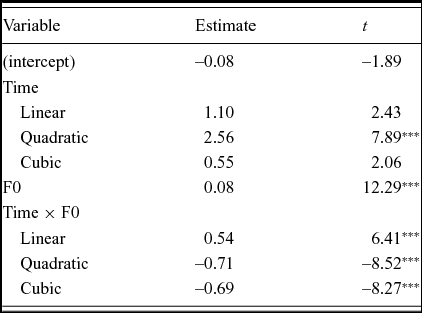
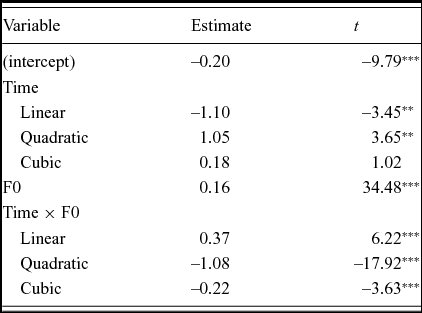
The GCA with the best fit for Dutch listeners’ differential proportions of fixations in the within-AP condition included all simple effects and all interactions. The results of this GCA are presented in Table 7.
Growth curve analysis on the Dutch listeners’ differential proportions of fixations in the within-AP condition.

Note. α = .0167, * = p < .0167, ** = p < .003, *** = p < .0003; n = 27; 10,132 observations; baseline: condition without an F0 rise
The negative estimate for the intercept means that Dutch listeners’ differential proportion of fixations in the condition without an F0 rise was below 0. The negative estimate for the linear time polynomial and the significant positive estimate for the quadratic time polynomial indicate that Dutch listeners’ fixation line in the condition without an F0 rise had a descending and convex (i.e., ∪) shape. The positive estimate for F0 indicates that Dutch listeners’ differential proportion of fixations was higher in the condition with an F0 rise than in the condition without an F0 rise. Importantly, the positive estimate for the interaction between F0 and the linear time polynomial, and the negative estimates for the interactions between F0 and the quadratic and cubic time polynomials, indicate that Dutch listeners’ fixation line was less descending, less convex, and more canonical ‘s’ (i.e., ∽) shaped in the condition with an F0 rise than in the condition without an F0 rise.
These results are evident in Figure 3 (right panel): From approximately 200 ms post target-word onward, Dutch listeners showed greater differential proportions of fixations in the condition with an F0 rise than in the condition without an F0 rise. An increase in lexical competition in the condition without an F0 rise is evident from approximately 500 ms to 1,100 ms. The less convex and more canonical ‘s’ shape of the fixation line in the condition with an F0 rise can thus be attributed to the stronger effect of F0 emerging after 500 ms. These results, again, indicate that Dutch listeners used F0 rise to locate word-final boundaries in the within-AP condition, and did so from very early on in the word recognition process.
All listeners
The GCA with the best fit on participants’ differential proportions of fixations in the within-AP condition included all simple effects and all interactions except the three-way interaction between L1, F0, and the linear time polynomial. The results of this GCA and the interpretation of its estimates can be found in the Supplementary Materials (Supplementary Materials, Table SM3). Among several effects, the effects relevant for this study in this GCA were significant two-way interactions between F0 and L1 for both L2 groups, with a greater effect of F0 rise for French listeners than for English listeners but a smaller effect of F0 rise for French listeners than for Dutch listeners. Furthermore, this GCA revealed three-way interactions between L1 (English and Dutch), F0, and the time polynomials, indicating that the L2 learners differed from French listeners in the effect of F0 they showed over time in the across-AP condition.
L2 listeners
The GCA on L2 listeners’ results with the best fit included all simple effects and all interactions. The results of this GCA and the interpretation of its estimates can be found in the Supplementary Materials (Supplementary Materials, Table SM4). In brief, this GCA revealed a significant two-way interaction between F0 and L1, with Dutch listeners showing a greater effect of F0 than English listeners. Furthermore, this GCA revealed significant three-way interactions between F0, L1, and the quadratic and cubic time polynomials, confirming that English and Dutch listeners differed from each other in the effect of F0 they showed over time in the within-AP condition.
4. Discussion and Conclusion
The present study examined whether English- and Dutch-speaking L2 learners of French who were matched in French proficiency and experience would differ in their use of F0 cues to word-final boundaries in French. Previous research had shown that Dutch-speaking L2 learners of English relied more on prosodic cues to stress in English than did native English listeners (Experiment 3 of Cooper et al., Reference Cooper, Cutler and Wales2002). These results were attributed to the greater weight of prosodic cues in Dutch as compared to English: Since English stress is often signaled by a contrast between full and reduced vowels, English listeners can rely on this segmental information to infer stress placement, resulting in lower sensitivity to prosodic correlates of stress; by contrast, since stress is not as strongly correlated with segmental cues in Dutch, Dutch listeners can instead tune in to the prosodic correlates of stress (Cooper et al., Reference Cooper, Cutler and Wales2002). This study tested whether the Dutch listener advantage would extend to the realm of speech segmentation where the L1 and L2 differed in the use of prosodic cues. We hypothesized that Dutch-speaking L2 learners of French would show greater reliance on F0 cues to word-final boundaries in French than would English-speaking L2 learners of French.
The results corroborated this prediction: The GCAs revealed that the two L2 groups differed from each other in the effect of F0 they showed over time in both the across-AP and within-AP conditions. In the across-AP condition, the early influence of the F0 rise on Dutch listeners’ differential proportions of fixations but the late influence of the F0 rise on English listeners’ differential proportions of fixations resulted in fixation lines that differed in shape between the two L2 groups. These results suggest that the F0 rise constrained lexical access earlier for the Dutch-speaking L2 learners of French than for the English-speaking L2 learners of French, at least when duration also signaled word-final boundaries in French. In the within-AP condition, the more robust influence of F0 in Dutch listeners as compared to English listeners also resulted in fixation lines that differed in shape between the two groups. Hence, the Dutch-speaking L2 learners of French appeared to have made greater use of F0 rise than the English-speaking L2 learners of French when word-final boundaries in French were not signaled by duration cues. These results are in line with the hypothesis that the greater functional weight of F0 cues in Dutch leads Dutch listeners to rely more on F0 cues to word-final boundaries in French as compared to English listeners. Since the two L2 groups were matched in their French proficiency and experience, these variables cannot explain the Dutch listener advantage found in this study.
The results also showed that in the within-AP condition, the F0 rise had a greater effect for Dutch-speaking L2 learners of French than for native French listeners, and this difference was statistically reliable (see Table SM3 in the Supplementary Materials). In that sense, the present results parallel those of Cooper et al. (Reference Cooper, Cutler and Wales2002, Experiment 3), where Dutch-speaking L2 learners of English made greater use of prosodic information in English than native English listeners. The explanation for these results may be that F0 cues also have a greater functional weight in Dutch than in French: In addition to having phrasal prosody, Dutch has lexical stress, with prosodic cues to stress constraining lexical access in Dutch (Donselaar, Koster & Cutler, Reference Donselaar, Koster and Cutler2005). In contrast, French only has phrasal prosody (Jun & Fougeron, Reference Jun, Fougeron and Botinis2000, Reference Jun and Fougeron2002; Welby, Reference Welby2006), and French listeners are known to have difficulty encoding stress in non-words and in L2 words (Dupoux, Sebastián-Gallés, Navarrete & Peperkamp, Reference Dupoux, Sebastián-Gallés, Navarrete and Peperkamp2008; Tremblay, Reference Tremblay2008). In that sense, it is not surprising that Dutch-speaking L2 learners of French would make greater use of F0 cues than native French listeners in the within-AP condition, even if these F0 cues are used differently in Dutch and French. These results provide strong support for the hypothesis that the functional weight of a prosodic cue in the L1 predicts the learning and use of this cue in the L2.Footnote 9
The present results can be explained by the cue-weighting theory of speech perception (e.g., Francis et al., Reference Francis, Baldwin and Nusbaum2000; Francis & Nusbaum, Reference Francis and Nusbaum2002; Holt & Lotto, Reference Holt and Lotto2006), according to which acoustic cues are weighed as a function of their informativeness for signaling linguistic contrasts, with L2 learners transferring their L1 cue weighting to the perception of L2 linguistic contrasts (e.g., Francis et al., Reference Francis, Ciocca, Ma and Fenn2008; Ingvalson et al., Reference Ingvalson, Holt and McClelland2011; Iverson et al., Reference Iverson, Kuhl, Akahane-Yamada, Diesch, Tohkura, Kettermann and Siebert2003; Qin et al., Reference Qin, Chien and Tremblay2016). Importantly, the present results extend this theory first by showing that the functional weight of a prosodic cue in the L1 can also predict the use of this cue in L2 speech segmentation, more specifically the learning of a new association between this prosodic cue and word boundaries: In the present study, the greater functional weight of F0 cues to lexical identity in Dutch than in English put Dutch listeners at an advantage over English listeners when learning to use F0 cues to word-final boundaries in French. To our knowledge, this study is the first to show that acoustic cues that play an important role for signaling lexical identity in the L1 also predict the learning of new associations between these cues and word boundaries in the L2.
In addition to extending the cue-weighting theory of speech perception to the realm of speech segmentation, the current findings have one important broader implication: They suggest that acoustic cues that serve one function in the L1 (e.g., to establish a contrast between two different words) can be reallocated to a different function in the L2 (i.e., to locate word boundaries in continuous speech). Other research appears to support this implication. To illustrate, Qin et al. (Reference Qin, Chien and Tremblay2016, Experiment 2) found that Mandarin-speaking L2 learners of English did not differ from native English listeners in their encoding of stress in English non-words when stress was realized with F0 cues, but they were less accurate than native listeners when stress was realized with duration cues. These results were attributed to the importance of F0 cues for encoding lexical tones in Mandarin, suggesting that the L2 learners transferred the use of prosodic cues from one function (lexical tones) to another (stress) if these cues also signaled lexical identity in the L2 (see also Wang, Reference Wang2008; Zhang & Francis, Reference Zhang and Francis2010). These findings suggest that as long as a particular cue is important for signaling lexical identity in the L1, the learning of a new association between it and the function it serves in the L2 should be possible.
The current study does leave open the question of how cue-weighting trading relations affect Dutch- and English-speaking L2 learners of French in their segmentation of French speech. For example, a visual inspection of the results suggests that the F0 rise had a numerically larger effect for Dutch listeners when it did not coincide with lengthening (within-AP condition) than when it did (across-AP condition).Footnote 10 One possible explanation for these results is that Dutch listeners weighed duration cues to word-final boundaries more highly than F0 cues to word-final boundaries, thus showing a reduced effect of F0 when the target word was also lengthened. In future studies, by examining the effect of trading relations between prosodic cues on Dutch and English listeners’ segmentation of French speech, we may be in a position to provide further support for, or perhaps refine, the hypothesis that the functional weight of a prosodic cue in the L1 predicts the use of this cue in the L2.
Supplementary material
To view supplementary material for this article, please visit https://doi.org/10.1017/S136672891700030X