Implications
Methane (CH4) output from ruminant production systems represents loss of energy which could otherwise be used for growth and milk production. Among others, animal-based CH4 mitigation strategies will have potential to lower the carbon footprint of milk production. This requires low-cost and portable techniques for quantifying CH4 output on a large scale, which are so far rare. This study examined and validated a technique that offers quick assay of CH4 output from individual animals and on a large scale. This would enable the use of animal-based mitigation strategies to utilize the existing between-animal variations in CH4 output traits.
Introduction
Methane emission from dairy systems is not only an environmental problem but also a loss of valuable feed energy in ruminants. This is because enteric emission of CH4 represents a loss of carbon from the rumen and therefore an unproductive use of dietary energy (Hindrichsen et al., Reference Hellwing, Lund, Madsen and Weisbjerg2006). Dairy cows lose about 2% to 12% of their ingested energy via CH4 of which about 95% is released as eructated CH4 (Murray et al., Reference McCourt, Yan, Mayne and Porter1976). Thus, mitigation of CH4 emission from dairy systems would help not only reduce countries’ emission liabilities but it may also bring a further boost to animal productivity.
In dairy cows, any attempt to reduce the environmental footprint of milk production via animal-based mitigation strategies requires accurate and large-scale measurement of the greenhouse gases from individual cows (Negussie et al., Reference Negussie, Mäntysaari, Mäntysaari and Lidauer2014). The ability to accurately measure CH4, particularly from individual cows is essential to estimate between-animal variations. Besides, reliable estimates of CH4 emissions in dairy cows are necessary in order to implement appropriate and comprehensive national greenhouse gas reduction strategies and provide realistic emission figures. Nevertheless, the lack of reliable techniques for the measurement of CH4 output particularly from individual cows and on large scale has been a hindrance to the implementation of animal-based mitigation strategies. So far, many of the available measurement techniques are either slow, expensive or labor intensive, and are unsuitable for large-scale measurements which is a prerequisite for genetic studies.
The advantages and disadvantages of some of the widely used measurement techniques have been reviewed by Storm et al. (Reference Storm, Hellwing, Nielsen and Madsen2012). For instance, the longstanding calorimetric respiration chambers have been described as the most accurate for quantitative CH4 measurements. However, the associated establishment costs and the limited capacity of the system restrict the number of animals to be measured at any one time. Moreover, it affects the behavior of animals and its relatively long measurement time limits, its use mainly for targeted short-term metabolic, physiological and nutritional experiments (Storm et al., Reference Storm, Hellwing, Nielsen and Madsen2012; Knapp, et al., Reference Knapp, Laur, Vadas, Weiss and Tricarico2015).
Recent advances have been reported in the use of emerging fast, portable and handheld techniques that are based either on Fourier transform IR (Garnsworthy et al., Reference Garnsworthy, Craigon, Hernandez-Medrano and Saunders2012a; Lassen et al., Reference Lassen, Løvendahl and Madsen2012) or laser techniques (Chagunda et al., Reference Boadi and Wittenberg2009). One other emerging methodology that is tailored for the measurement of greenhouse gasses is based on photoacoustic IR spectroscopy (PAS) technique. Literature on such emerging methodologies that are meant for the quantification of CH4 on a large number of individuals and in a short time is rare. Particularly, information on the repeatability of CH4 output traits and the applicability of fast and portable individual animal CH4 measurement technique that is based on PAS utilizing F10 multigas analyzer (PAS-F10) is lacking. The objectives of this study were to examine and validate a non-invasive individual cow CH4 measurement system that is based on PAS-F10 technique and to estimate the repeatability of CH4 output traits from a large-scale data collected on an individual animal basis.
Material and methods
Photoacoustic spectroscopy
The photoacoustic effect is based on the conversion of optical energy into thermal energy (Haisch, Reference Hammond, Burke, Koolaard, Muetzel, Pinares-Patiño and Waghorn2012). The principle of photoacoustic detection involves (Kuusela and Kauppinen, Reference Kuusela and Kauppinen2007) the guiding of light into a photoacoustic cell where it is absorbed by the sample gas. As a consequence, a fraction of the ground state molecular population will excite to higher energy levels. These excited states will eventually relax through radiative and non-radiative pathways. The non-radiative part of the excitations heats the sample gas, which induces thermal expansion. In an enclosed space, the thermal expansion generates a pressure wave, which can subsequently be detected with a pressure sensor, that is, a microphone.
Photoacoustic detection has some advantages against conventional transmission-based IR detection techniques. In PAS, direct absorption is investigated instead of small reductions in a high background signal (Haisch, Reference Hammond, Burke, Koolaard, Muetzel, Pinares-Patiño and Waghorn2012). In practical use, this enables long calibration intervals and high stability in long-term use. One other advantage of PAS is that achieving high sensitivity does not require a long optical path length. Therefore, a high dynamic range can be achieved with PAS and the sample gas volume inside the photoacoustic cell is typically very low.
F10 multigas analyzer
For the purposes of this study the portable F10 multigas analyzer (Gasera Ltd, Turku, Finland) that is based on non-dispersive IR cantilever-enhanced photoacoustic detection was chosen. F10 can reliably and simultaneously monitor of up to nine different gas components using a gas sample of only few milliliters in volume. One of the main applications of F10 is for the measurement and monitoring of greenhouse gases.
F10 utilizes an ultra-sensitive optical cantilever microphone that can achieve several orders of magnitude better sensitivity than conventional condenser microphones (Kuusela and Kauppinen, Reference Kuusela and Kauppinen2007). It has a pulsed IR source and the selectivity in the measurement is achieved by using narrow band-pass optical filters in the mid-IR region. Mechanical chopper is not required due to the use of an electronically pulsed IR source. For each gas compound, all the installed optical filters are used in the analysis to minimize the cross-sensitivity between different compounds. Analysis is based on a modified classical least squares fit of sample response to calibration data. The total internal volume inside F10 is only 30 ml, which enables efficient and fast gas exchange, which is required in the measurement of greenhouse gases. F10 is suitable for the measurement difficult gas mixtures – for example, those with high humidity as in dairy barns.
Measurements of methane
The multipoint F10 gas analyzer was fitted to two feeding kiosks (two sampling points) for continuous measurement of CH4, CO2 and acetone outputs from individual cows at the Minkiö dairy farm. Whenever a cow visits the feeding kiosk, her breath is sampled and analyzed for the contents of the different gases. Measurements were made alternatively between the two sampling points and every other minute a gas was sampled and analyzed from each sampling point. Sampling of the gas and its analysis required ~30 s each and a single CH4 concentration measurement from one of the sampling points took about a minute. One of the main reasons for setting up sampling points in the feeding kiosks was that feeding kiosks are visited by cows several times during the day and this allows the collection of several measurements per animal. During each individual measurement, the cow ID, date, time and the concentration of the various gases measured were recorded automatically. A continuous 24/7 measurement system was employed. In addition, each of the cows visits to the kiosk as well as the corresponding concentration of the gasses were recorded and stored in the internal memory of the F10 equipment.
Carbon as a tracer for methane measurement
In dairy cattle, so far the most commonly used media for the surveillance of the health status are blood, milk and urine (Larsen and Nielsen, Reference Larsen and Nielsen2005). Nowadays breath analysis is slowly gaining ground in livestock production and one of the main reasons for this is recent advances in different techniques that used breath analysis in many applications. For instance, breath analysis has now moved from laboratory research to commercial reality and is providing a platform for cow-side methods to be used for semi-quantitative determination of diseases (Larsen and Nielsen, Reference Larsen and Nielsen2005). One advantage of using breath analysis is its non-invasive and non-contact nature of the procedure. This makes breath analysis relatively simple to carry out and also very amenable to animal welfare requirements (Chagunda et al., Reference Boadi and Wittenberg2009).
Recent advances in fast and handheld emerging techniques utilize this opportunities and the use of carbon dioxide as a tracer for the measurement of CH4 is one. The use of CO2 as a tracer gas for the measurement of CH4 output in ruminants is described by Madsen et al. (Reference Madsen, Bjerg, Hvelplund, Weisbjerg and Lund2010). The technique, instead of using externally added markers or tracers such as sulfur hexafluoride (SF6), relies mainly on the naturally emitted CO2 to quantify CH4 emissions. Madsen et al. (Reference Madsen, Bjerg, Hvelplund, Weisbjerg and Lund2010) have described that with information on live weight, milk production and feed intake, the heat production and CO2 output (Pedersen et al., Reference Pedersen, Blanes-Vidal, Jørgensen, Chwalibog, Haeussermann, Heetkamp and Aarnink2008) of a cow can be quantified. If the CH4 : CO2 ratios are known through the measurement of breath samples then the total CH4 production of a cow could easily be calculated. The exhaled air of cattle contains CO2 and CH4 in concentrations 100 and 1000 times higher than the concentrations in atmospheric air, respectively. Therefore, it is only necessary to have 5% to 10% of the animal’s breath in the air being analyzed (Storm et al., Reference Storm, Hellwing, Nielsen and Madsen2012). This can easily be achieved in a barn or when individual cows visit an automatic milking system or concentrate feed dispensers or feeding kiosks in the barn. The accuracy of the method in part depends on reliable measurement of the CH4 to CO2 ratio in the breath sample of cows using accurate and robust multigas analyzers. So far the concentrations of CH4 and CO2 from cows have been measured with different types of analyzers such as Gasmet DX-4000 (Gasmet Technologies Oy, Helsinki, Finland) based on Fourier transform infrared (FTIR) (Lassen et al., Reference Lassen, Løvendahl and Madsen2012), laser CH4 detector (Chagunda et al., Reference Boadi and Wittenberg2009), Guardian Plus (Garnsworthy et al., Reference Garnsworthy, Craigon, Hernandez-Medrano and Saunders2012a). However, the measurement of CH4 and CO2 from the breath sample of cows using F10 multigas analyzer that is based on photoacoustic IR technology has not been tested, validated and reported. Besides, despite their great importance in livestock production, the use of such breath-based techniques for CH4 detection has currently been limited and is mostly at experimental level (Chagunda et al., Reference Boadi and Wittenberg2009).
Animals, feeding and measurements
This study was conducted at the Minkiö experimental dairy herd of the Natural Resources Institute Finland (Luke). Feed intake, milk production, BW and CH4 output traits recorded on 115 pirimiparous cows for over 2 years period were used. All cows were of the Nordic Red dairy cattle and were multiple ovulation and embryo transfer nucleus herd cows undergoing their first lactation test. The cows were housed in free stall barn and were fed ad libitum. The diet was based on grass silage and home blend concentrate mix. Concentrate was given from concentrate feeding stations and the amount of concentrate cows get depends on the stage of lactation and the digestibility of the grass silage as described by Mäntysaari and Mäntysaari (Reference Murray, Bryant and Leng2015).
In the herd, individual milk yield and feed intake were recorded daily. However, during the summer months the cows were out on pasture and feed intake was not recorded. Milk composition including protein, fat, lactose contents and somatic cell count were analyzed once a month on test days by IR analysis (MilkoScan FT6000; Foss Electric, HillerØd, Denmark). All cows were weighted twice daily via automated scale when leaving the milking parlour after milking. To calculate BW and BW changes, the average daily BW were smoothened by regression model that fitted fixed effect of days in milk and random animal effect. Body weight change, that is, weight gain or loss was then calculated as a difference between any consecutive days weights. The body condition of the cows were assessed every 4th week using a score on a scale of 1 to 5 (1=skinny to 5=very fat) with intervals of 0.25. The chemical composition of diets was also monitored regularly as described in Mäntysaari and Mäntysaari (Reference Murray, Bryant and Leng2015) to calculate the metabolizable (Luke, 2015) and gross energy content of the feeds.
Estimation of daily methane output
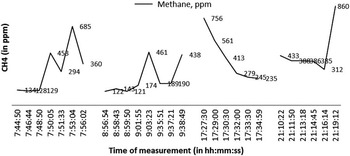
The raw PAS-F10 CH4 measurements during each visit of cows to the feeding kiosks were highly variable and ranged from as low as 122 to 1000 ppm (Figure 1). Therefore, to account for some of this high variability the daily mean of repeated PAS-F10 readings were calculated after corrections were made for the background concentration level of the gases in the barn. The mean daily concentrations of CH4 and CO2 were then used to calculate the daily CH4 : CO2 ratio. For correction of the background levels, during each cows visit to the kiosk measurements of the gases recorded from an empty kiosk (without cow) before the entrance of the cow in to the feeding kiosks were collected, averaged and used as background measurements of the gasses in the barn. During data preparation, the mean daily CH4 and CO2 output and CH4 : CO2 ratios were merged with all daily measurements of production, feed intake and BW records for analysis. The daily CH4 : CO2 ratios were used for the estimation of daily CH4 output used in the validation study where estimates from cattle chamber and prediction models were compared. Whereas ratios from each visit were used to generate large CH4 output data used in the linear mixed model analysis. The daily CH4 output of cows was estimated from the daily measurements using the method by Madsen et al. (Reference Madsen, Bjerg, Hvelplund, Weisbjerg and Lund2010). In this method, measurements of CH4 and CO2 concentrations in breath of cows were combined with estimates of total CO2 production from information on metabolizable energy (ME) intake to quantify daily CH4 output using the following equation:
 $${\rm CH}_{4} \,{\rm output}\,\left( {{\rm l\,/\,day}} \right)\,{\equals}\,a\,{\times}{{\left( {b{\minus}d} \right)} \over {\left( {c{\minus}e} \right)}}$$
Methane (CH4) measurement profile (in parts per million (ppm)) from a cow in the dairy barn using F10 multipoint gas analyzer that is based on photoacoustic IR spectroscopy technique.

where a is the CO2 produced by the animal (l/day); b the concentration of CH4 in air mix (ppm); c the concentration of CO2 in air mix (ppm); d the concentration of CH4 in the barn air (ppm); and e the concentration of CO2 in the barn air (ppm).
The CH4 output of a cow per day was described as output in liters per day (CH4 (l/day)) and the amount of energy lost as CH4 as a percentage of the gross energy intake (CH4GE) was also calculated using the CH4 energy conversion of 55.22 MJ/kg (Brouwer, Reference Chagunda, Römer and Roberts1965).
Repeatability of daily methane output
The data used in this study consists of daily measurements of milk yield, feed or energy intake and BW. Estimates of the daily CH4 output from each of the 115 Nordic Red cows were first merged with daily production and weight records for statistical analysis. A linear mixed model fitting a repeatability animal model was used to assess the significance of the different systematic environmental effects (including, milk yield, dry matter intake (DMI), stages of lactation, time of measurement, BW, kiosk number and recording year×season) as well as to estimate the magnitude of between-animal variations in CH4 output traits. Measurement months were grouped into four season classes representing November to February, March to April, May to July and August to October. Non-random variables year×season, kiosk number, lactation week and time of measurement were all fitted as fixed class effects and time of measurement was included as time to the nearest hour with 24 classes. The repeatability of CH4 output traits was calculated as the ratio of between-animal to total phenotypic variations. The linear mixed model used for the analysis of the data can be described as
 $$\eqalignno{ & y_{{ijkot}} \,{\equals}\,YRs_{i} {\plus}Kn_{j} {\plus}LW_{k} {\plus}Tm_{o} {\plus}\beta _{1} {\times}ECM_{{ijkot}} {\plus}\beta _{1} \cr &\qquad \quad {\times}DMI_{{ijkot}} {\plus}\beta _{1} {\times}BW_{{ijkot}} {\plus}a_{t} {\plus}{\varepsilon}_{{ijkot}} $$
where y
ijkot
is the daily CH4 output observation of a cow t, made in the year×season i and in her lactation week k by sampling the cow’s breath during her visit in concentrate kiosk j and at time of the day o. YRs
i
the effect of recording year×season; Kn
j
the effect of concentrate feeding kiosk; LW
k
the effect of lactation week; Tm
o
the effect of time of measurement; β
c the fixed regression coefficients, c=1, 2, 3 for ECM, DMI and BW, respectively; a
t
the random animal effects; and
 $${\varepsilon}_{{ijkot}} $$
the random residual.
Testing and validation of methane measurements
In order to establish the accuracy and reliability, PAS-F10 measurements were tested against CH4 measurements from an open-circuit indirect respiration calorimetry system consisting of four climate-controlled respiration chambers for cattle. Measurements by both methods were taken consecutively because a simultaneous measurement was logistically not possible. Therefore, for each cow, measurements were taken in a 3-weeks sequence, where 1-week PAS-F10 measurements were followed by 1-week measurement in the chamber which was again followed by a week PAS-F10 measurements starting immediately at the end of chamber measurements. In total, measurements on 22 cows were made and after data validation measurements from 21 cows were available for analysis. To validate PAS-F10 measurements against chamber and establish the agreement between the two methods, a concordance analysis was carried out (Lin, Reference Lin1989). Lin’s concordance analysis computes agreement on a continuous measure obtained by two methods. It is widely used in validation studies because of its ability to combine measures of both precision and accuracy to determine how far the observed data deviate from the line of perfect concordance. Besides, it is important that measuring the agreement of a new technique with a gold standard such as chamber should also include determining the measurement error of the new technique. Therefore, plots of residuals were assessed from the prediction of chamber measurements from different PAS-F10 measurements fitting linear regression models. In addition to the validation with the chamber, estimates from PAS-F10 were also tested against estimates from Intergovernmental Panel on Climate Change (IPCC) (1997) Tier II and other widely used prediction models by Kirchgeβner et al. (Reference Kirchgeβer, Windisch and Muller1995), Wilkerson et al. (Reference Wilkerson, Casper and Mertens1995), Yan et al. (Reference Yan, Mayne and Porter2005) and Reynolds et al. (Reference Reynolds, Crompton and Millis2011).
Results
Profiles of methane measurement
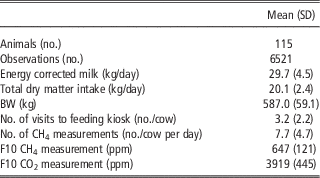
Table 1 shows basic statistics including number of animals measured, means and standard deviation of production, intake as well as daily CH4 output traits and the number of CH4 measurements per animal during a visit to the feeding kiosk. The mean energy corrected milk (ECM), total DMI and BW were 29.7 kg/day, 20.1 kg/day and 587 kg, respectively. During the study period, a cow visited the feeding kiosk on average 3.2 times/day and during each visit on average 7.7 CH4 concentration measurements/cow were recorded. The mean raw CH4 and CO2 concentration measurements were 647 and 3919 ppm. Profiles of the raw CH4 measurements from PAS-F10 are also presented in Figure 1. The figure shows that at the beginning when the cow enters the feeding kiosk, readings for both CH4 and CO2 were slightly lower with values ranging from 128 to 134 ppm and 1538 to 1820 ppm, respectively. These low readings are close to the baseline concentration of the gases in the barn. Lower readings at the beginning of measurements may be due to the fact that the cow’s head has not settled into the feeding trough of the kiosk and thus is still not yet close enough to the tip of the sampling tube located at the bottom of the feeding kiosk. However, when the cow settled down, then the normal readings start and the concentration of CH4 and the other gases picks up (Figure 1). A similar situation was observed toward the end of the cow’s visit when the cow is about to leave the feeding kiosk. During this occasion, however, very low readings were rare. To avoid the influence of very low readings at the beginning of cows entry to the kiosks and its effect on the calculation of the daily CH4 outputs, only records of cows that had two or more consecutive repeated measurements (with concentrations above the mean daily background levels) were considered in the final data analysis.
Description of data used in the study

ppm=Parts per million; CH4=methane; CO2=carbon dioxide.
Daily methane output
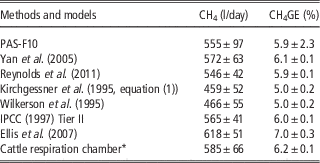
The daily CH4 output of cows from the two methods of measurements and prediction models are presented in Table 2. The result shows that the daily CH4 output from PAS-F10 was 555 l/day and ranged from 300 to 880 l/day. On the other hand, estimates from the different prediction models ranged from 546 to 618 l/day. In addition, the amount of energy lost as eructed CH4 as a percentage of the gross energy intake of the cows was 5.9% from PAS-F10 and ranged from 5.9% to 9.0% for the various prediction models. The corresponding estimates for the chamber from the smaller validation data was a mean of 585±66 l/day and 6.2% the gross energy intake was lost as eructed CH4.
Estimates of daily methane output from photoacoustic IR spectroscopy (PAS)-F10 and from selected prediction models from the analysis of large data

CH4GE=energy lost as eructed methane as a percentage of gross energy intake; PAS-F10=method for methane measurement using the F10 multigas analyzer (GASERA Ltd, Turku, Finland) that is based on PAS technique.
* Estimate from validation data set.
Effects of systematic environmental factors
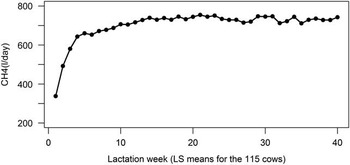
The analyses of different systematic environmental factors showed that DMI, milk production, stages of lactation (lactation week), recording year×season and time of measurement had all significant effects on daily CH4 output of cows. On the other hand, the kiosk or concentrate feed dispenser which the cow has visited and BW had no significant effect. With regard to DMI, the least squares analysis indicated that with the increase in the DMI there was an increase in the daily CH4 out of cows. Similarly, although in the opposite direction, with the increase in the levels of ECM yield, there was a decrease in the CH4/kg ECM. Stages of lactation had also a significant effect on the daily CH4 output (Figure 2). The result in Figure 2 shows that at the beginning of lactation, the daily CH4 output was lower and increased rapidly to lactation weeks 4 and 5 and gradually toward lactation weeks 8 and 9. Then after, however, it was somewhat stable until lactation week 35 from where it started to decline toward late lactation.
Effect of stages of lactation on daily methane (CH4) output.

Validation of daily methane output estimates
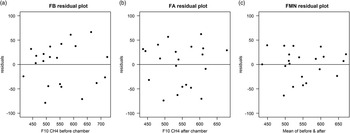
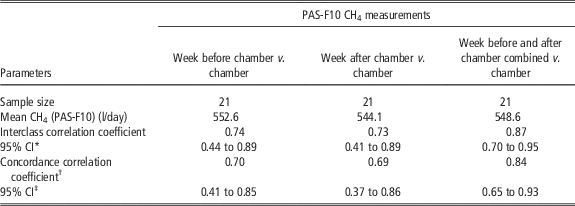
The compatibility and reliability of CH4 output estimates from PAS-F10 technique was tested against measurements from cattle respiration chamber and prediction models. In the chamber comparison, a week in chamber measurement was preceded and also followed by a week of PAS-F10 measurements. The mean daily PAS-F10 CH4 output during the week before the cows entered into the chamber, the measurement within chamber and PAS-F10 measurements taken after the cows came out of the chamber were 552, 567 and 544 l/day, respectively. The agreement between the chamber and PAS-F10 methods were assessed using concordance analysis and the corresponding results are in Table 3. The result shows that the concordance correlation coefficient for a week before chamber PAS-F10 CH4 measurement was 0.70 with 95% lower and upper confidence limits of 0.41 and 0.85, respectively, whereas the coefficient for the week after chamber PAS-F10 CH4 was 0.69 with corresponding lower and upper confidence limits of 0.37 and 0.86, respectively. However, when the week before and week after chamber PAS-F10 CH4 measurements were combined the agreement between the methods has markedly improved. For the combined PAS-F10 measurements the concordance correlation coefficient was 0.84 with the 95% lower and upper confidence limits of 0.65 and 0.93, respectively. This result shows that combined weekly mean PAS-F10 measurements taken in a week interval can provide a much closer prediction of the respiration chamber measurements. This relationship is also clearly shown by the size of the prediction error variances when chamber measurements were predicted from the PAS-F10 measurements fitting linear regression models (Figure 3). The plot of residuals from the model used for the prediction of chamber measurements from PAS-F10 measurements are given in Figures 3a to 3c. The figure shows that when chamber measurements were predicted, either from a week before chamber PAS-F10 CH4 measurements or from a week after chamber PAS-F10 CH4 measurements separately, the residuals were much further from 0 (Figures 3a and b) in both cases. However, when the week before and the week after chamber PAS-F10 CH4 measurements were combined, the prediction error variance was relatively smaller and the distributions of residuals were much closer to 0 indicating better agreement between the measurements.
Residual plots from the prediction of chamber methane measurements based on (a) 1-week before chamber photoacoustic IR spectroscopy (PAS)-F10 measurements (FB); (b) 1-week after chamber PAS-F10 measurements (FA); and (c) mean before and after chamber PAS-F10 measurements (FMN). Data points are means for individual cows.

Concordance analyses for the validation of photoacoustic IR spectroscopy (PAS-F10) against open-circuit calorimetric chamber measurements of methane (CH4) output in dairy cows

PAS-F10=method for CH4 measurement using the F10 multigas analyzer (GASERA Ltd, Turku, Finland) which is based on PAS technique.
* 95% (lower to upper) confidence interval for interclass correlation.
† Concordance analysis (Lin, Reference Lin1989).
‡ 95% (lower to upper) confidence interval from concordance analysis.
In Table 2 results from the comparison of the mean daily CH4 output estimates of PAS-F10 with those estimated by the prediction models are presented. Estimates of the mean daily CH4 output from the widely used Tier II of IPCC (1997) was 565 l/day, whereas that from Yan et al. (Reference Yan, Mayne and Porter2005) and Reynolds et al. (Reference Reynolds, Crompton and Millis2011) were 572 l/day and 546 l/day, respectively. These estimates are all rather close to mean daily estimates of 555 l/day from PAS-F10. However, estimates of 618, 459 and 466 l/day predicted from Ellis et al. (Reference Ellis, Kebreab, Odondo, McBride, Okine and France2007), Kirchgessner et al. (Reference Kirchgeβer, Windisch and Muller1995) and Wilkerson et al. (Reference Wilkerson, Casper and Mertens1995) equations, respectively, were slightly different than the estimates from our PAS-F10 technique.
Between-animal variations in methane output traits
Estimates of between- and within-animal variations from the repeatability animal model analysis were used to calculate the repeatability of CH4 output traits. The repeatabilities for CH4 output (l/day) and CH4GE (%) traits were calculated as ratio of between-animal variation to total phenotypic variation (between+within animal variation) and were 0.41 and 0.46, respectively.
Discussion
Daily methane output and effects of systematic environmental factors
Daily CH4 output in dairy cows is variable and is mostly affected by several factors such as the breed of the cow, diet, levels of milk production and stages of lactation. In this study the average daily CH4 output in cows was 555 l/day. This is slightly higher than estimates of Bell et al. (Reference Bell, Saunders, Wilcox, Homer, Goodman, Craigon and Garnsworthy2014) who measured CH4 output during milking of 215 Holstein-Friesian cows and reported a daily CH4 output of 516 l/day with a range of 389 to 638 l/day. Working on Danish lactating cows the daily CH4 output compiled over eight experiments and covering 30 diets was 577 l/day with 6.2% of gross energy intake eructed as CH4 (Hellwing et al., Reference Hindrichsen, Wettstein, Machmuller and Kreuzer2013). On the other hand, Chagunda et al. (Reference Boadi and Wittenberg2009) and Grainger et al. (Reference Grainger, Clarke, McGinn, Auldist, Beauchemin, Hannah, Waghorn, Clark and Eckard2007) reported a slightly lower estimate of CH4 output per day working on Holstein-Friesian cattle. Chagunda (Reference Boadi and Wittenberg2009) using a laser CH4 detector for the estimation of CH4 output in UK Holstein-Friesian cows reported a mean daily CH4 output of 356 g/day which is equivalent to 498 l/day.
Methane has an energy content of 55.22 MJ/kg (Brouwer, Reference Chagunda, Römer and Roberts1965) and represents a significant loss of dietary energy from the ruminant production system and its mitigation would have positive implications. The amount of gross energy intake that is lost as CH4 in dairy cows varies considerably. Losses of dietary energy via eructated CH4 in dairy cows can be expressed as a percentage of cow’s gross energy intake (CH4GE). Results from our study indicate that on average 5.9% of the gross energy intake of the cows was lost as eructed CH4. This is close to the estimates of McBride et al. (Reference Mäntysaari and Mäntysaari2013) who have reported that energy lost as CH4 as percentage of gross energy intake in dairy cows fed diets to UK farming conditions were 6.5% (3.4% to 8.8%) for lactating and 6.1% (4.4% to 8.4%) for non-lactating cows. On the other hand, Storlien et al. (Reference Storlien, Adler, Thuen and Harstad2013) assessing the effects of silage botanical composition on CH4 emission in Norwegian Red cows fed on four different diets reported that CH4GE ranged from 4.3% to 9.3%. Very low CH4 outputs of about 2% to 3% of gross energy intake have also been reported from cattle fed low (10% to 30%) forage diets, such as beef finishing rations (Johnson and Johnson, Reference Johnson and Johnson1995). In general, various estimates suggest that 2% to 12% of the total gross energy consumed by the dairy cow is converted to CH4 and our estimates lies within this range.
There are several systematic environmental factors affecting CH4 output in dairy cows. Dry matter intake is one of the main factors explaining variations in daily CH4 output. In this study, DMI explained the largest proportion of variation about 55% in CH4 output. Most studies have also estimated that variation in DMI accounts for 52% to 62% of the variation in CH4 production on a per day basis when cattle were fed ad libitum (Boadi and Wittenberg, Reference Broucek2002; Pinares-Patiño et al., Reference Pinares-Patiño, Hickey, Young, Dodds, MacLean, Molano, Sandoval, Kjestrup, Harland, Hunt, Pickering and McEwan2007). Ellis et al. (Reference Ellis, Kebreab, Odondo, McBride, Okine and France2007) reported that DMI (kg/day) predicted CH4 production (g/day) with an R 2 of 0.64 and ME intake (MJ/day) predicted CH4 production (g/day) with an R 2 of 0.53 for dairy cattle. In a study involving the effects of feed intake on enteric CH4 emissions in sheep, Hammond et al. (Reference Haisch2013) predicted that organic matter intake accounts for most of the variation (R 2=0.87) in CH4 output. However, this relationship seems to be influenced by the physiological status of the animal (lactation) as the prediction increased when data were grouped into lactating and non-lactating animals.
The level of milk production is another factor that affects CH4 output. In this study with an increase in the level of milk production a decrease in daily CH4 output per kilogram ECM was observed. The background for this is that in high yielding cows the base emission of CH4 that every day a cow produces through consumption of maintenance feed will be distributed over more kilogram of milk that the cow produces over and above that of her contemporaries. The implication of this is the dilution of maintenance effect and as a result with the increase in production efficiency there will be a decrease in CH4 output per kilogram of ECM. Thus, improving the production efficiency of dairy cows could be one of the potential strategies to lower the environmental footprint from the dairy production systems. Yan et al. (2010) working on data from 579 lactating cows demonstrated that CH4 output can be lowered with improvement in production efficiency. They reported a negative relationship between CH4 output and energy intake indicating that an increase in the ME intake of high yielding cows increased feeding levels and reduced the proportion of energy used for maintenance resulting in the reduction of CH4 output as a proportion of energy intake. Along with other managemental approaches that include reduction in involuntary culling and diseases, Knapp et al. (Reference Knapp, Laur, Vadas, Weiss and Tricarico2015) have also indicated that increasing the productivity of an animal will have an effect to decrease the proportion of CH4 produced per unit of product. Our results therefore reaffirm that improving the productive efficiency of animals can be one of the most cost effective and sustainable strategies to address the unfavorable environmental effects of dairy system emissions.
In addition to the level of milk production, stages of lactation had also a significant effect on the daily CH4 output of dairy cows. Chagunda et al. (Reference Boadi and Wittenberg2009) in a study that validated laser CH4 detector have found that the activity of the cow and stages of lactation had significant effects on daily CH4 output of cows. In this study, the trend for CH4 output during lactation showed lower values in early lactation that gradually increased toward peak lactation and somewhat stabilized thereafter (Figure 2). Similar trends for CH4 output during lactation have also been reported by several authors (Garnsworthy et al., Reference Garnsworthy, Craigon, Hernandez-Medrano and Saunders2012b; Lassen et al., Reference Lassen, Løvendahl and Madsen2012). The relatively lower CH4 output observed during early lactation could be due to the relative depression of feed intake experienced by most transition and early lactation cows. On the other hand, with the progression of lactation and with the increase in the level of DMI, corresponding increases in CH4 output are expected in mid to late lactation periods. As a consequence, in this study the highest daily CH4 output during lactation was observed around mid-lactation when the animals start to gain weight and condition. Working on data from 665 Holstein-Friesian heifers, de Haas et al. (Reference de Haas, Windig, Calus, Dijkstra, de Haan, Bannink and Veerkamp2011) also reported a similar trend for predicted CH4 output during lactation that followed a standard feed intake curve during lactation.
A closer look at the effect of recording year×season showed that there was some year to year and seasonal variations in the CH4 output of cows. For instance, during the first year of recording, the relatively highest CH4 measurements were recorded during the winter months followed by spring and autumn months. During the second year, however, the highest CH4 output was recorded during the spring months and was followed by winter and autumn months. For the summer season, no data were available mainly because no CH4 measurements were made during summer months as all cows were out on the pasture and individual recording of feed intake during these months was impractical. In general, the variability observed during the different seasons over the years could be due to some changes in the diet or silage composition and digestibility or due to some other unexplained environmental factors and changes related to recording and managemental routines followed over the years. Diurnal variation had also a significant effect on the CH4 out of dairy cows. In this study, a marked variability was found in the CH4 output of cows depending at which time of the day the measurements were taken. Measurements in the morning and particularly after feeding were usually higher than those measurements taken during late in the evening. Naturally this variability could be related to the feeding, resting and activity rhythm of the cows as wells as the underlying dynamic physiological and metabolic functions. This marked variability in CH4 output during the different times of the day mostly referred to as circadian variations is in line with the significant effects of time of measurement reported by Kinsman et al. (Reference Kinsman, Sauer, Jackson and Wolynetz1995), Garnsworthy et al. (Reference Garnsworthy, Craigon, Hernandez-Medrano and Saunders2012b) and Lassen et al. (Reference Lassen, Løvendahl and Madsen2012).
Validation of daily methane output estimates by PAS-F10
So far very few studies have attempted the validation of portable CH4 measurements against some other well-established measurement techniques. In this study a concordance analysis was used to assess the agreement between the two methods. An assessment of concordance is particularly important when new measuring technique is tested and validated. In this regard, our results show that the concordance correlation coefficient for the before chamber weekly PAS-F10 and after chamber weekly PAS-F10 measurements were moderate and were 0.70 and 0.69, respectively. When the mean of both these separate weekly measurements were taken the concordance correlation coefficient has increased to 0.84 (Table 3). The result indicates that a better agreement between the two methods was realized with the combined weekly PAS-F10 measurements than with either of the separate PAS-F10 weekly measurements taken alone. Similarly, the plots of residuals from the prediction of chamber measurements from the PAS-F10 measurements indicated a lower prediction error variance when weekly PAS-F10 measurements were combined (Figure 3).
Nevertheless, the moderate associations observed particularly between the separate weekly PAS-F10 and chamber measurements could be due to in part to the setup and design of the validation test as mentioned earlier. Besides, respiration chambers have the advantage of measuring CH4 output from all sources including CH4 emanating from both foregut and hind gut fermentation. It has been reported that the hind gut fermentation accounts for about 5% of total CH4 output that is lost via flatus (Broucek, Reference Chagunda and Yan2014). Although this represents a relatively small fraction, PAS-F10 does not measure this hind gut loss and this might have also contributed to the slight decrease in the agreement observed between the estimates from the two methods. Similar findings have been reported by Grainger et al. (Reference Grainger, Clarke, McGinn, Auldist, Beauchemin, Hannah, Waghorn, Clark and Eckard2007) who worked on the SF6 tracer technique. They reported that the CH4 yield measured by SF6 was about 8% less than the estimates from the calorimetric chamber values. In general, the level of association observed in this study between combined PAS-F10 and chamber measurements is in line with the estimates reported by Chagunda et al. (Reference Brouwer2011). They reported a correlation of 0.8 between CH4 measurements of laser CH4 detector and those from calorimetric chamber. It should, however, be noted that a better design, whereby animals could be measured simultaneously with both CH4 measurement techniques would provide an ideal validation platform. In addition, developing correction factors to account for the loss from hind gut fermentation could further improve the agreement between PAS-F10 and chamber CH4 measurements.
The application of prediction models could be an important and alternative way of quantifying CH4 output in dairy herds. However, it is difficult to find models that are robust and applicable under widely different circumstances and production systems. In this study for instance, slight disparities have been observed in the estimates of daily CH4 output between PAS-F10 and those from the different prediction models. Estimates from some of the models gave closer estimates while others did not. One of the main reasons for such disparity could be the fact that most predication models tend to be more specific and accurate mainly to the data and to the environment in which they were developed.
Repeatability of methane output traits
In deciding on most effective mitigation strategies, accurate and repeatable CH4 measurement techniques are required (Knapp et al., Reference Knapp, Laur, Vadas, Weiss and Tricarico2015). So far, several direct and indirect methods have been used to quantify CH4 emissions in vivo, many of which have been reviewed by Johnson and Johnson (Reference Johnson and Johnson1995), Kebreab et al. (Reference Kebreab, Clark, Wagner-Riddle and France2006) and Storm et al. (Reference Storm, Hellwing, Nielsen and Madsen2012). There is, however, less information on techniques that are emerging, fast, handheld and portable applications which could provide a means for quick assay of CH4 output on a large scale and on an individual animal basis. The repeatability of daily CH4 output from this study ranged from 0.40 to 0.46 for the different CH4 output traits. So far, not much has been reported about the repeatability of CH4 output traits from dairy system emissions. For instance, McCourt et al. (Reference McBride, Morrison and Yan2005) and Grainger et al. (Reference Grainger, Clarke, McGinn, Auldist, Beauchemin, Hannah, Waghorn, Clark and Eckard2007) reported a repeatability of 0.17 and 0.18 for CH4 production for beef cattle from a study that involved the SF6 tracer technique and a whole animal respiration chamber, respectively. Lassen et al. (Reference Lassen, Løvendahl and Madsen2012) have reported repeatability of 0.37 for Holsteins and 0.33 for Jerseys for CH4 : CO2 ratios. Higher repeatabilities of 0.53 to 0.94 have also been reported for CH4/day in sheep kept under different sampling schemes (Pinares-Patino et al., Reference Pinares-Patiño, Waghorn, Machmüller, Vlaming, Molano, Cavanagh and Clark2013). Working on Dutch Holsteins data, de Hass et al. (Reference Brouwer2011) have reported heritability of 0.29 to 0.42 for predicted CH4 output. In general, our repeatability estimates of 0.41 and 0.46 for CH4 and CH4GE are moderate and indicate the size of available between-animal variations in CH4 output traits, which could be utilized through animal-based mitigation strategies.
Conclusions
In this study, the suitability of non-invasive individual cow CH4 measurement technique that is based on PAS technique (PAS-F10) was developed and tested. The comparison with the widely used chamber and prediction models showed that estimates from PAS-F10 had reasonably high correlations. The technique can therefore be used to provide a quick assay of CH4 output in individual animal basis and in a large scale. The sizable between-animal variations and the corresponding repeatability estimates of 0.40 to 0.46 gives good indications that there is some between-animal variations in CH4 output traits.
Acknowledgments
The authors would like to acknowledge financial support from the Finnish Ministry of Agriculture and Forestry (MMM) though GreenDairy Project No. 2908234. The authors hank Mikiö experimental dairy farm staff members for their all-round support during data collection and to GASERA Ltd, Turku, Finland for their technical assistance with the F10 multigas analyzer.