In ruminants, the development of the mammary gland occurs during four major stages of life: pre-puberty, post-puberty, gestation and lactation. Before and after puberty, mammary development is strongly related to ovarian activity, which stimulates mammary growth (Aker, Reference Aker2002). After the first sexual cycle, oestrogens allow development of the mammary gland duct system. From the 5th month of gestation, the lobulo-alveolar system develops, and mammary acini length and number increase (Tucker, Reference Tucker2000). Mammary epithelial cells (MECs) are responsible for the production of milk within the mammary gland (Forsyth, Reference Forsyth1986; Tucker, Reference Tucker2000). Their number and activity are controlled during the different developmental cycles of the mammary gland and are under the influence of the animal's hormonal status. Mammogenic hormones, such as the oestrogens, stimulate MEC proliferation and induce maturation of mammary acini for milk production (Clarke, Reference Clarke2000). Experiments in vivo investigating the suppression of ovarian secretions in heifers and prepubertal goats (Berry et al. Reference Berry, Jobst, Ellis, Howard, Capuco and Akers2003a; Yart et al. Reference Yart, Finot, Marnet and Dessauge2012a) and experiments in vitro using MAC-T cells (Woodward et al. Reference Woodward, Beal and Akers1993) indicate that oestradiol (E2) is essential for mammary parenchyma development and that E2 stimulates MEC proliferation. Oestrogens produced by the feto-placental unit contribute to the development of the alveolar tissue (Desjardins et al. Reference Desjardins, Paape and Tucker1968), and their secretion increases progressively during gestation and decreases abruptly at parturition (Patel et al. Reference Patel, Takenouchi, Takahashi, Hirako, Sasaki and Domeki1999). During lactation, various studies have shown opposite effects of E2 on mammary cells.
Forty years ago, Mollett et al. (Reference Mollett, Erb, Monk and Malven1976) performed experiments involving injections of sexual steroids (oestradiol and progesterone) into lactating cows. These authors showed that the steroids had negative effects on the production of milk and modified its composition. Athie et al. (Reference Athie, Bachman, Head, Hayen and Wilcox1996) specifically studied the effects of E2 on the involution of the mammary gland in dairy cows and suggested that E2 injections led to acceleration of mammary involution. Recently, Delbecchi et al. (Reference Delbecchi, Miller, Prud'homme, Petitclerc, Wagner and Lacasse2005) showed that E2 injections in non-pregnant cows in mid-lactation increased stanniocalcin (STC) concentrations in both milk and plasma. An increase of STC concentration in milk is a characteristic of mammary gland involution (Hurley, Reference Hurley1989). In lactating cows, a decline in milk production after the peak of lactation is caused by the regression of the secretory tissue, a reduction of alveolar size and a loss of MEC (Wilde & Knight, Reference Wilde and Knight1989). During this period, MEC undergo apoptosis to decrease the cell number within the mammary tissue.
The effect of E2 on MEC is highly dependent on the model used (Russo et al. Reference Russo, Yang, Hu, Bove, Huang, Silva, Tahin, Wu, Higgy, Zekri and Russo1998). The results can differ between in-vitro and in-vivo models, animals and humans or cancer MECs and normal MECs. For example, in breast cancer, there is plenty of evidence indicating that oestrogens play a role in the development and progression of the cancer (Jordan et al. Reference Jordan, Lewis, Osipo and Cheng2005). Oestrogen stimulates proliferation and inhibits apoptosis through oestrogen receptor-mediated mechanisms in different cell types. Interestingly, recent studies in vitro have demonstrated that MCF-7 breast cancer cells are able to modify their response to E2 treatment by switching from a proliferative state to an apoptotic state (Lewis et al. Reference Lewis, Meeke, Osipo, Ross, Kidawi, Li, Bell, Chandel and Jordan2005). Therefore, many trials in vitro and in vivo have indicated that the E2 effect is driven by the MEC environment, which controls E2 sensitivity and mediates specific signalling pathways.
We thus hypothesized that proliferative or apoptotic effects of E2 on MECs could be influenced by the physiological status of the cells. MAC-T cells are a good model to study the effect of sex steroids on MEC because they behave similarly to primary MEC removed from the mammary tissue extracts of heifers (Berry et al. Reference Berry, Weber Nielsen, Sejrsen, Pearson, Boyle and Akers2003b) and they are sensitive to sex steroids (Zarzynska et al. Reference Zarzynska, Gajewska and Motyl2005). Thus, the objectives of this study were to investigate in vitro the effect of E2 on MECs by mimicking two physiological statuses (active and early apoptotic MECs) using MAC-T cells. To some extent, active and early apoptotic MECs could be respectively compared with newly generated MECs in early- and mid- lactation mammary gland and senescent MECs in late-lactation mammary gland.
Materials and methods
Cell culture and treatment
The MAC-T cell line was established by Huynh et al. (Reference Huynh, Robitaille and Turner1991). MAC-T cells were grown in high-glucose Dulbecco's Modified Eagle Medium (DMEM; Dominique Dutscher, Brumath, France) supplemented with 10% fetal calf serum (A15-101, PAA, Les Mureaux, France), 100 U/ml of penicillin-streptomycin-fungizone (Dominique Dutscher) and 5 μg/ml of bovine insulin (Dominique Dutscher). Cells were maintained at 37°C in a humidified atmosphere containing 5% CO2 and passaged twice a week (cells reached confluency within 2–3 d). Cells were plated either in 75-cm2 flasks 48 h before drug treatment (2 × 10⁶ cells/flask), or in a 96-well microplate (2000 cells/well). In the first part of this study, cells were treated for 48 h with pharmacological doses of 17β-oestradiol: 1 × 10⁻⁹, 1 × 10⁻⁸, 1 × 10⁻⁷ and 1 × 10⁻⁶ mol/ml (E4389, Sigma Aldrich Chimie, Lyon, France) (treatments are considered to be at physiological doses from 1 × 10⁻¹² to 1 × 10⁻⁹ mol/ml). Controls cells did not receive oestradiol. In the second part of this study, cells were treated with 10 μm camptothecin (CPT) (C9911, Sigma Aldrich Chimie) to induce apoptosis, and supplemented or not with 1 × 10⁻⁷ mol/ml E2 (CPT/E2 and CPT respectively) for 2, 6, 24 and 48 h prior to collection. Two additional treated groups were used: a batch of cells treated with 1 × 10⁻⁷ mol/ml E2 only and a control batch that received neither CPT nor E2 (Control).
The 96-well microplates were used for cell viability and proliferation assessment, whereas flasks were used for Caspases 3/7 activity measurement, western blotting and flow cytometry analyses. MAC-T cells in flasks were trypsinized using 0·25% trypsin/EDTA (Sigma Aldrich Chimie). Medium from individual flasks, which could contain dead, floating cells, was collected and mixed with adherent cells from the same flask. The cells were collected, centrifuged at 1000 g at 4°C for 5 min and washed with cold PBS.
Cell viability and proliferation
For the cell viability [3-(4,5-dimethylthiazol-2-yl)-2,5-diphenyltetrazolium bromide MTT (Sigma Aldrich Chimie) test] and proliferation [Cyquant test (Thermo Fisher Scientific, Illkirch, France)] assays, cells were plated at a density of 2000 cells per well. The cells were then treated with or without oestradiol (1 × 10⁻⁷ mol/ml) and camptothecin (10 μm) for 48 h.
Cell viability was assessed in 96-well microplates using the 3-(4,5-dimethylthiazol-2-yl)-2,5-diphenyltetrazolium bromide MTT test (Sigma Aldrich Chimie). The medium was removed at the end of the treatment period. After washing with PBS, cell monolayers were exposed to 200 μl of MTT solution (0·5 mg/ml in PBS) at 37°C in a humidified 5% CO2 incubator for 2 h to allow blue formazan crystals to be produced via the mitochondrial enzyme succinate dehydrogenase. The MTT solution was discarded; the cells were washed with PBS; and the formazan crystals were solubilized with 200 μl of DMSO per well (Sigma Aldrich Chimie) using gentle agitation for 10 min at room temperature. Then, the 96-well plates were measured spectrophotometrically at 540 nm using a Multiskan Spectrum microplate reader (Thermo Fisher Scientific) equipped with a spectrophotometer. Cell viability analysis was repeated 3 times.
Cell proliferation rates in 96-well microplates were estimated using the Cyquant Cell Proliferation assay (Thermo Fisher Scientific) according to the manufacturer's instructions. The amount of DNA in the wells was measured after removal of the medium and washing with PBS. The DNA was then frozen at −80°C until the day of the analysis. Cyquant fluorescent dye diluted 400-fold in 1 × lysis buffer was added to the wells. After 5 min of incubation, the fluorescence intensity of each sample was measured at 485/530 nm using a Mithras LB940 fluorescence microplate reader (Berthold Technologies, Thoiry, France). A standard curve using a dilution series of cells ranging from 300 to 40 000 cells was generated to convert sample fluorescence values into cell numbers. Cell proliferation analysis was repeated 3 times.
Caspases 3/7 activity
Caspases 3/7 activity was evaluated with a luminogenic assay using the caspases 3/7 Glo kit (Promega France) according to the manufacturer's recommendations. Briefly, cell lysates (10 μg) were incubated with 200 μl of the caspases 3/7 Glo buffer for 1 h at room temperature. Then, the luminescence generated by substrate cleavage was measured using a Mithras luminometer (Perkin Elmer, Courtaboeuf, France) at 380 nm (excitation wavelength) and 455 nm (emission wavelength). The measurement of caspases 3/7 activity was repeated 3 times.
Protein extraction and Western blot analysis
Total proteins were extracted from pelleted cells using the Mammalian Protein Extraction Reagent (MPER, Thermo Fisher Scientific) containing a proteinase inhibitor mixture (Thermo Fisher Scientific). The soluble protein fraction was collected after centrifugation at 13 000 g at 4°C for 10 min, and protein concentrations were determined using the BCA Protein Assay kit according to the manufacturer's instructions (Thermo Fisher Scientific). Lysates were combined with sample buffer (50 mm-TrisHCl (pH 6·8), 2% SDS, 0·1% bromophenol blue, 20% glycerol and 0·1 m-dithiothreitol), boiled for 5 min at 95°C, and resolved using SDS-PAGE.
Equal amounts of protein (10 μg) were separated on 4–12% NuPage gradient gels (Thermo Fisher Scientific) via SDS–PAGE and transferred electrophoretically to polyvinylidene difluoride membranes (Amersham, Courtaboeuf, France) at 100 V for 60 min. The membranes were incubated with blocking solution (5% dry skimmed milk dissolved in Tris-buffered saline Tween (TBS-T) buffer, 50 mm-Tris-HCl (pH 8·6), 150 mm-NaCl and 0·1% Tween) for 30 min. A set of prestained molecular mass standards (Thermo Fisher Scientific) was run in each gel. Detection of PARP cleavage, progesterone receptor (PR) and oestradiol receptor alpha (ERα) was accomplished by incubating the membranes overnight (4°C) with a rabbit polyclonal anti-PARP antibody (9542, Ozyme, St Quentin Yvelines, France), a mouse monoclonal anti-PR antibody (PN IM1546, clone PR10A9, Immunotech SAS, Marseille, France) and a rabbit polyclonal anti-ERα antibody (sc-543, clone HC-20, Santa Cruz Biotechnology, Heidelberg, Germany), respectively. Actin levels, recognized using a mouse monoclonal anti-β-actin antibody (A5441, Sigma Aldrich Chimie), were used as an internal control. The three primary antibodies were used at 1 : 1000. The membranes were incubated for 1 h with the appropriate secondary antibody coupled to horseradish peroxidase (HRP; Dako France SAS, Trappes, France) used at 1 : 2500, which was visualized using an ECL kit (Thermo Fisher Scientific) and the ImageQuant LAS4000 Biomolecular Imager digital imaging system (GE Healthcare, Velizy-Villacoublay, France). Images generated as gel files were analysed using the corresponding ImageQuant TL software (GE Healthcare). For each protein, protein extraction and Western blot analysis were repeated 2 times.
Flow cytometry analysis of PI/Annexin-V labelling
Annexin-V and PI double labelling was used to visualize apoptotic and necrotic cells using the Alexa Fluor 488 Annexin-V/Dead cell apoptosis kit (Thermo Fisher Scientific) procedure according to the manufacturer's recommendations.
Cells were resuspended in 100 μl of binding buffer. Then, cells were incubated for 15 min at room temperature in darkness with Annexin-V-FITC (5 μg/ml) and PI (1 μg/ml). After the incubation period, cells were diluted 5-fold in 400 μl of annexin-binding buffer, mixed gently and immediately analysed by flow cytometry. The following controls were used to set up quadrants: unstained cells, cells labelled with Annexin-V-FITC alone (without PI), and cells labelled with PI alone (without Annexin-V-FITC).
For each sample, 2 × 10⁴ events were analysed. Flow cytometry analyses were performed using a MACSQuant Analyzer (Miltenyi Biotec SAS, Paris, France), followed by analysis using MACSQuantify software (Miltenyi Biotec SAS). Flow cytometry analysis was repeated 3 times.
Observation of cells
Cells were observed at 10 × magnification, objective length 160/0·17, using phase contrast microscopy (Olympus CK2; Olympus France, Rungis, France), and images were generated.
Statistical analysis
Data on cell viability, flow cytometry, caspases activity and proliferation are expressed as means±sd. Data were subjected to a Student's t test to compare the mean values. Statistical analyses were performed using the R software package. Effects were considered statistically significant at P < 0·05.
Results
Effect of E2 on MAC-T cell proliferation and apoptosis
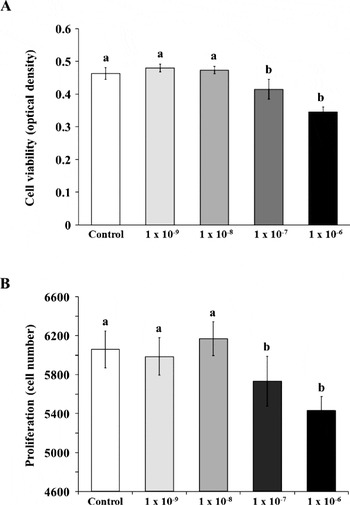
We first studied the effect of E2 on the viability of the bovine MAC-T cell line. As shown in Fig. 1(a), E2 treatments at increasing doses (1 × 10⁻⁹ to 1 × 10⁻⁶ mol/ml) applied over 48 h induced a decrease in MAC-T cell viability (−11% at 1 × 10⁻⁷ mol/ml and −26% at 1 × 10⁻⁶ mol/ml, P < 0·01). Similar results were obtained after 24 and 72 h of E2 treatment (data not shown).
Effects of E2 on MAC-T cell viability and proliferation. MAC-T cells were cultured for 48 h in medium without E2 (Control) or containing different concentrations of E2 (1 × 10⁻⁹ mol/ml to 1 × 10⁻⁶ mol/ml). (a) Cell viability was assayed using the MTT method. (b) Cell numbers were determined using the Cyquant method. Bars represent means±sd. a, b within a variable, values with different superscript letters are significantly different (P < 0·05). Experiments were repeated at least three times

The same E2 doses were used to test the effect of E2 on the proliferation of MAC-T cells (Fig. 1b). As observed based on cell viability, E2 treatments at increasing doses (1 × 10⁻⁹ to 1 × 10⁻⁶ mol/ml) applied over 48 h induced a decrease in MAC-T cell numbers (−6% at 1 × 10⁻⁷ mol/ml and −11% at 1 × 10⁻⁶ mol/ml, P < 0·01). E2 treatments had no significant effect on MAC-T cell numbers and viability at doses of 1 × 10⁻⁹ and 1 × 10⁻⁸ mol/ml.
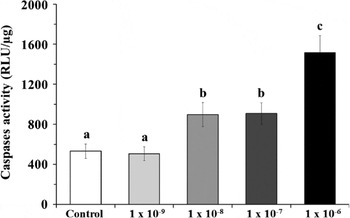
Caspases 3/7 activities were quantified to determine the apoptotic potential of E2 on bovine MECs in vitro. We detected active forms of caspases 3/7 beginning at an E2 dose of 1 × 10⁻⁸ mol/ml after 48 h of treatment. As shown in Fig. 2, the E2 treatments led to an increase in caspases 3/7 activity in a dose-dependent manner in MAC-T cells, suggesting that E2 induced apoptosis in the MAC-T cells (by 2·3 and 3·3-fold at 1 × 10⁻⁷ and 1 × 10⁻⁶ mol/ml E2, respectively).
Effects of E2 on caspases activity. MAC-T cells were cultured for 48 h in medium containing 0 mol/ml E2 (Control) or different concentrations of E2 (1 × 10⁻⁹ mol/ml to 1 × 10⁻⁶ mol/ml). Cells were lysed in MPER buffer for total protein extraction. Caspases 3/7 activity was assessed in total protein extracts using a Caspase Glo kit. a, b, c within a variable, values with different superscript letters are significantly different (P < 0·05).The experiment was independently repeated three times

Effect of E2 on the expression of an oestrogen-dependent protein
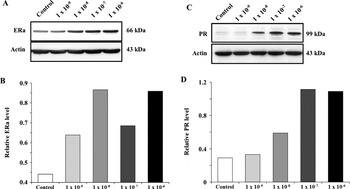
The E2 receptivity of MAC-T cells was assessed by Western blot quantification of the oestrogen nuclear receptor, ERα (Fig. 3a). Cells from the five groups expressed ERα, and its expression was increased in E2 treated cells whatever the treatment dose (Fig. 3b).
Effects of E2 on oestrogen receptivity and progesterone receptor levels. MAC-T cells were cultured for 48 h in medium without E2 (Control) or containing different concentrations of E2 (1 × 10⁻⁹ mol/ml to 1 × 10⁻⁶ mol/ml). (a) The cells were lysed in MPER buffer for total protein extraction, and 15 μg of protein was analysed using electrophoresis and Western blotting (ERα and Actin). (b) Each band was quantified using a molecular imager, and for each treatment, ERα (66 kDa) data were normalized using actin (43 kDa) data. (c) The cells were lysed in MPER buffer for total protein extraction, and 15 μg of protein was analysed using electrophoresis and Western blotting (PR and Actin). (d) Each band was quantified using a molecular imager, and for each treatment, PR (99 kDa) data were normalized using actin (43 kDa) data

The progesterone receptivity of MAC-T cells was assessed by Western blot quantification of PR (Fig. 3c). The PR expression was increased in E2 1 × 10⁻⁸, 1 × 10⁻⁷ and 1 × 10⁻⁶ mol/ml treatment groups and was strongly stimulated by 1 × 10⁻⁷ and 1 × 10⁻⁶ mol/ml E2 doses at 48 h.
Quantification of PR levels (Fig. 3d) revealed that the 1 × 10⁻⁷ mol/ml E2 dose induced the maximum level in the MAC-T cells (3-fold compared with the control). These results suggested that MAC-T cells are sensitive and receptive to oestradiol treatment and that oestradiol is able to activate an E2 target protein.
Effect of E2 on apoptosis induction in MAC-T cells
Camptothecin is a cytotoxic quinoline alkaloid, often used in breast cancer treatments, that inhibits the DNA enzyme topoisomerase I. We used this drug to induce an apoptotic state in MAC-T cells and to examine the effects of E2 on cells engaged in cell death to mimic MEC status during late lactation. We checked beforehand that we induced apoptosis of MAC-T cells with 10 μm of CPT (data not shown).
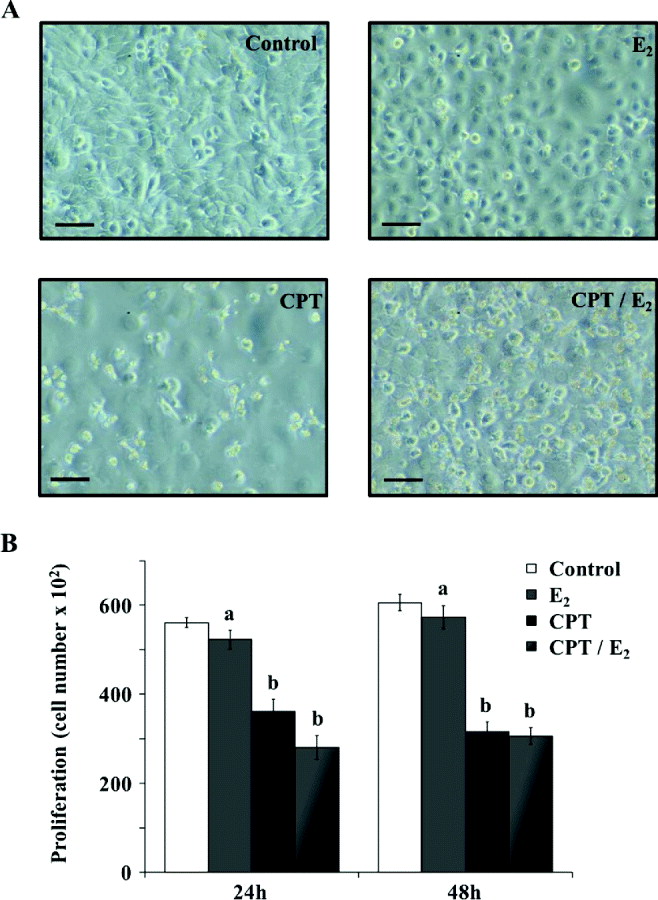
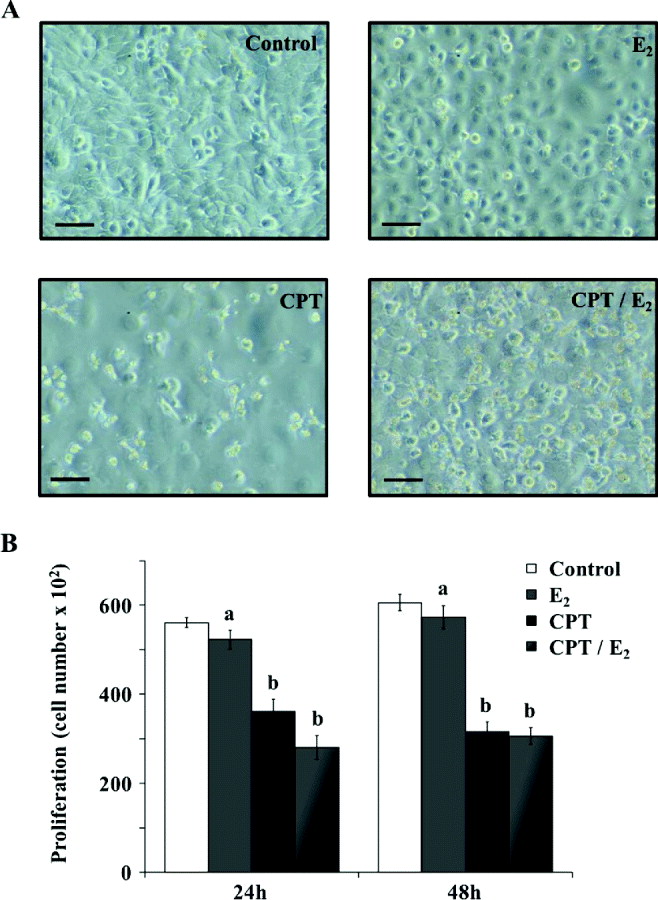
First, we observed cell morphology on MAC-T cells treated with CPT, E2 (1 × 10⁻⁷ mol/ml) or E2 (1 × 10⁻⁷ mol/ml) in combination with CPT (CPT/E2). MAC-T cells treated with CPT underwent significant changes with respect to their cell shape and surface (Fig. 4a), which was less observable following treatment with E2 alone. Interestingly, cells treated with a combination of E2 and CPT appeared to be rounded with numerous plasma membrane deformations and lost adhesion to the substrate. Moreover, proliferation assays (Fig. 4b) confirmed that E2 had a negative effect by decreasing cell numbers after 24 and 48 h of treatment. Cell proliferation was further decreased by the addition of CPT; however, addition of E2 to CPT did not cause an additional decline.
Effects of E2 on apoptosis-induced MAC-T cell morphology and proliferation. MAC-T cells were cultured for 48 h in medium without E2 (Control) or containing 1 × 10⁻⁷ mol/ml of E2 (E2), 10 μm of CPT (CPT) or 1 × 10⁻⁷ mol/ml plus 10 μm CPT (CPT/E2). (a) Treated and untreated cells were observed using microscopy. Scale bars represent 10 μm. (b) Cell numbers were determined using the Cyquant method. a, b within a variable, values with different superscript letters are significantly different (P < 0·05). Experiments were repeated at least three times
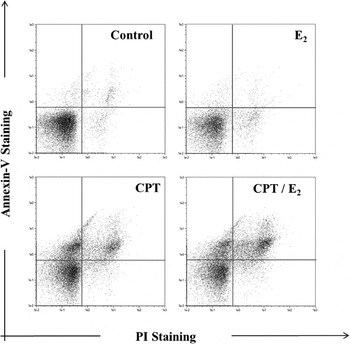
Next, we extensively analysed MAC-T cell apoptosis in response to E2 ± CPT. Flow cytometry results indicated that long-term (48 h) CPT/E2 treatment led to an increase in Annexin-V and PI positive cell number (+3 and 7%, respectively). Interestingly, as shown in Fig. 5 and Table 1, E2 was able to induce a switch from an early apoptotic stage (Annexin-V positive cells) to a late apoptotic stage (PI/Annexin-V double-labelled cells).
Effects of E2 on apoptosis-induced MAC-T cell apoptosis. MAC-T cells were cultured for 48 h in medium without E2 (Control) or containing 1 × 10⁻⁷ mol/ml of E2 (E2), 1 μm of CPT (CPT) or 1 × 10⁻⁷ mol/ml plus 10 μm CPT (CPT/E2). Annexin-V and PI staining were analysed using flow cytometry. Each plot corresponds to 20 000 events

Percentages of Annexin-V, PI and PI/Annexin-V positive cells determined by flow cytometry after 24 and 48 h of treatment. Results are expressed as percentages of total cell number. MAC-T cells were cultured for 24 or 48 h in medium without E2 (Control) or containing 1 × 10⁻⁷ mol/ml of E2 (E2), 10 μm of CPT (CPT) or 1 × 10⁻⁷ mol/ml E2 plus 10 μm CPT (CPT/E2)†

† a, a′, a″, b, b′, b″, c, c′, c″, d, d′ within a variable, values with different superscript letters are significantly different (P < 0·05)
Caspases signalling pathways induced by E2 treatment
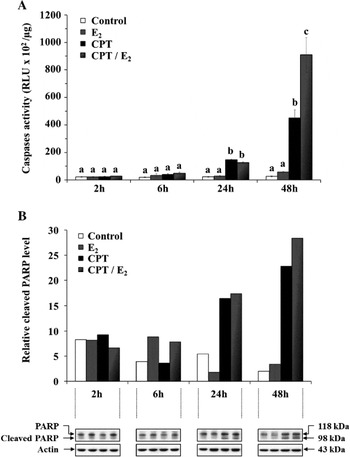
We next studied the effects of E2, CPT and CPT/E2 on several MAC-T cell apoptosis markers. We treated cells at various time points (2, 6, 24 and 48 h) with drug combinations as described above and measured caspases 3/7 activity. We found that E2 had an additive effect on the action of CPT by inducing an increase in caspases 3/7 activity after 24 h of treatment (Fig. 6a). Indeed, from 24 h, E2 enhanced apoptosis in MAC-T cells in which apoptosis had been induced by CPT. PARP is a protein involved in DNA repair that can be cleaved and inactivated by caspases. Here we observed that the CPT/E2 treatment induced cleavage of PARP after 24 and 48 h of treatment (Fig. 6b). Quantification of cleaved PARP levels revealed that the additional treatment with E2 increased these levels to 6 and 25% after 24 and 48 h of treatment, respectively, compared with CPT alone.
Effects of E2 on apoptosis-induced MAC-T cell apoptosis signalling pathways. MAC-T cells were cultured for 48 h in medium without E2 (Control) or containing 1 × 10⁻⁷ mol/ml of E2 (E2), 10 μm of CPT (CPT) or 1 × 10⁻⁷ mol/ml E2 plus 10 μm CPT (CPT/E2). (a) Cells were lysed in MPER buffer for total protein extraction. Caspase activation was assessed in total protein extracts using a Caspase Glo kit. The experiment was independently repeated three times. (b) Cells were lysed in MPER buffer for total protein extraction, and 15 μg of protein was analysed using electrophoresis and Western blotting. Each band was quantified using a molecular imager, and for each treatment, cleaved PARP data were normalized using actin data. a, b, c within a variable, values with different superscript letters are significantly different (P < 0·05)

Discussion
In this study we investigated the effect of E2 on MAC-T cells in vitro, considering two physiological states: active MECs and early apoptotic MECs. MAC-T cells are mammary alveolar bovine cells able to secrete milk proteins and are receptive to sex steroids.
First we studied the effect of different concentrations of E2 on MAC-T cells (active MECs). In the present study, MAC-T cells expressed ERα and the use of pharmacological doses of E2 (from 10−6 m to 10−3 m) enhanced the transcription of PR. The pr gene expression, and by this way its protein transcription, is known to be positively regulated by E2. Our results highlighted that MAC-T cells express PR and that the level of PR expression is E2 dose dependent, thereby confirming that MAC-T cells are responsive to E2. The maximal PR protein level observed was induced by a dose of 10−4m E2. Similarly, treating MAC-T cells with increasing doses of E2 led to a reduction in their viability and proliferation. We attempted to connect this anti-proliferative effect to an apoptotic mechanism, and we showed that E2 was able to activate key proteins involved in programmed cell death: the caspases. This is the first study to describe a direct apoptotic effect of E2 on bovine MEC. Woodward et al. (Reference Woodward, Beal and Akers1993) demonstrated that the growth of MAC-T cells was not stimulated by E2 at any dose. Indeed, here we found that none of our treatment doses of E2 were able to induce proliferation in MAC-T cells. On the contrary, the highest doses of E2 (10−7 mol/ml and 10−6 mol/ml) tested accelerated apoptosis. The effect of E2 on cell death marker was described in MAC-T cells by Zarzynska et al. (Reference Zarzynska, Gajewska and Motyl2005). In this study, the authors observed an increase in transforming growth factor-beta 1 (TGF-β1) expression in response to E2. The apoptosis induced during mammary gland involution involves many intracellular events, including TGF-β1 production. Execution of TGF-β1-induced apoptosis in bovine MEC occurs through the action of caspases (Kolek et al. Reference Kolek, Gajkowska, Godlewski and Motyl2003).
Thus, in a second part of the experiment, we studied the effect of E2 on early apoptotic MAC-T cells. For this purpose, we used camptothecin to induce cell death. Camptothecin was applied either alone or combined with E2 (10−7 mol/ml). Observations of cell morphology and proliferation of MAC-T cells treated for 24 and 48 h with E2 alone, CPT alone or their combination showed an amplifying effect of E2 on the decrease in cell numbers and morphological modifications (disorganization of the plasma membrane and presence of apoptotic bodies). Flow cytometry analysis enabled us to link this rise in cell loss to an increase in apoptosis. Indeed, after 48 h of treatment, E2 alone had a weak apoptotic effect on MAC-T cells compared with the apoptosis rate induced by CPT, whereas E2 strongly increased apoptosis in early apoptotic MAC-T cells (+7% of PI/Annexin-V positive cells). Many studies have indicated that E2 acts as a mitogenic factor by stimulating proliferation and inhibiting cell death in different cell types. Here, E2 had an opposite effect and was able to induce apoptosis. However, various models exist and indicate that E2 is able to induce apoptosis in different cell types, in particular in human MECs. A putative oestrogen receptor response element has been identified in the FasL gene (extrinsic apoptotic pathway), which activates the Fas/FasL pathway (Mor et al. Reference Mor, Kohen, Garcia-Velasco, Nilsen, Brown, Song and Naftolin2000), responsible for caspases activation. In a human breast cancer cell line, E2 treatment severely increased the expression of several pro-apoptotic proteins and led to a loss of the mitochondrial potential and to the activation of caspases 7 and 9. Caspase activation induces cleavage of the protein PARP, which is an enzyme involved in DNA repair in response to environmental stress. Thus, PARP cleavage reflects an apoptotic state and activated caspases. We showed that E2 was able to accelerate apoptosis in early apoptotic MAC-T cells by activating caspases, leading to an increase in PARP cleavage. Taken together, these results suggest that E2 may have different responsiveness dependent on the cell physiological status.
Recently, we published a study indicating that suppression of ovarian steroids by ovariectomy in non-pregnant lactating cows limited the decline in milk yield after the peak of lactation, in the second half of lactation (Yart et al. Reference Yart, Dessauge, Finot, Barbey, Marnet and Lollivier2012b). After 14 months of lactation, this resulted in a 36% higher milk yield for ovariectomized cows compared with control non-pregnant cows. Interestingly, the molecular analyses performed on mammary tissue samples collected on these cows after 14 months of lactation revealed that the limited decline in milk yield measured in ovariectomized cows was related to a decrease in MEC apoptosis, evidenced by a decrease in PARP protein abundance. Here, we have demonstrated that E2 is able to activate caspases in early apoptotic cells and that this activation later involves PARP cleavage. Moreover, the difference in cleaved PARP protein abundance after 48 h of treatment was more important between CPT and CPT/E2 groups than between Control and E2 groups. This suggests that the apoptotic processes that are increased in the presence of ovarian steroids in the late-lactating mammary gland, are similar to those observed in vitro in early apoptotic MECs, treated with E2 during 48 h.
It is now well established that the decline in milk yield that follows the peak of lactation is the consequence of a gradual increase in apoptotic MEC number (Capuco et al. Reference Capuco, Wood, Baldwin, Mcleod and Paape2001; Stefanon et al. Reference Stefanon, Colitti, Gabai, Knight and Wilde2002). Oestradiol has been identify as a potential factor involved in the decline in milk yield insofar as its administration in mid- or late-lactating cows induces a strong decrease in milk yield (Mollett et al. Reference Mollett, Erb, Monk and Malven1976) and accelerates mammary gland involution (Athie et al. Reference Athie, Bachman, Head, Hayen and Wilcox1996; Delbecchi et al. Reference Delbecchi, Miller, Prud'homme, Petitclerc, Wagner and Lacasse2005). Delbecchi et al. (Reference Delbecchi, Miller, Prud'homme, Petitclerc, Wagner and Lacasse2005) showed that E2 injections in non-pregnant cows in mid-late lactation induced an 81% decrease in the milk yield after 11 d of treatment, related to a decrease in β-casein gene expression in the mammary tissue and an increase in STC-mediated mammary gland involution. However, they failed to demonstrate any effect of the suppression of ovarian steroid secretion on milk yield, when applied during the first two-thirds of lactation (Delbecchi & Lacasse, Reference Delbecchi and Lacasse2006). These data support the idea that the sensitivity of MECs to ovarian steroids, and specifically to E, evolves within the course of lactation. Apoptosis induced by E2 in MECs seems to be more important in late lactation, in aging cells. In our study, the enhancement of apoptosis in MECs by E2 is more efficient in early apoptotic cells which could be compared with senescent cells in the late-lactating mammary gland.
Conclusions
In this study, we showed that oestradiol induced slightly apoptosis on viable MEC and accelerated apoptosis on early apoptotic MEC after 48 h of treatment. This suggests that E2 has a late differential effect that is dependent on the cells' viability. In lactating cows, the hormonal and cellular environment change over time and influence MEC status. More particularly, the decrease in cell survival factors during the course of lactation affects MEC viability. Therefore, the negative effect of E2 on lactation persistency could be due to an enhancement of apoptotic processes in MECs.
The authors are grateful to American Journal Expert (Durham, NC, USA) for the language editing (certificate verification key: 35B8-0850-5CE5-1ADB-D90E). This research was co-supported by the French National Institute of Agricultural Science (INRA), the PHASE department.