1. Introduction
Rotating and stratified fluids are ubiquitous in stellar interiors, as well as planetary atmospheres and oceans. To predict their structure and evolution, one of the main challenges is to understand how momentum, heat and chemical elements are redistributed and mixed by various transport mechanisms (e.g. large scale circulations, waves or hydrodynamical instabilities) and small-scale processes in presence of stratification and rotation (e.g. Vallis Reference Vallis2017; Kippenhahn, Weigert & Weiss Reference Kippenhahn, Weigert and Weiss2013; Aerts, Mathis & Rogers Reference Aerts, Mathis and Rogers2019). In this context, hydrodynamic instabilities have been thoroughly studied because of their prime importance in transport processes (see Zahn Reference Zahn1984; Rieutord Reference Rieutord2006; Smyth & Carpenter Reference Smyth and Carpenter2019). Their nonlinear evolutions produce efficient momentum and heat fluxes and strongly modify the initial structure of the flows.
Among various instabilities, shear instability is most frequently encountered as it only necessitates a velocity shear to develop (Peltier & Caulfield Reference Peltier and Caulfield2003; Carpenter et al. Reference Carpenter, Tedford, Heifetz and Lawrence2012; Caulfield Reference Caulfield2021), a configuration which is generic in geophysical and astrophysical flows. In planetary atmospheres and oceans, shear is present in shear layers, jets, wakes and boundary layers flows (Johannessen et al. Reference Johannessen, Shuchman, Digranes, Lyzenga, Wackerman, Johannessen and Vachon1996; Flament et al. Reference Flament, Lumpkin, Tournadre and Armi2001). In stellar interiors, in particular in stably stratified radiative regions, the differential rotation in the radial and latitudinal directions is associated with large-scale sheared motions. The resulting instabilities are thought to control the turbulent transport and mixing (Chaboyer & Zahn Reference Chaboyer and Zahn1992; Zahn Reference Zahn1992; Mathis & Zahn Reference Mathis and Zahn2004; Mathis et al. Reference Mathis, Prat, Amard, Charbonnel, Palacios, Lagarde and Eggenberger2018).
For two-dimensional, homogeneous and inviscid parallel flows, the Rayleigh and Fjørtoft necessary conditions for shear instability are well known: the former states that the velocity profile must have an inflection point whereas the latter requires that it should correspond to a shear maximum (Smyth & Carpenter Reference Smyth and Carpenter2019). Furthermore, for non-rotating and non-stratified shear flows, Squire’s theorem ensures that the most unstable mode is two-dimensional. As reviewed below, previous works have studied how a stable stratification, a planetary rotation, viscous effects and heat or mass diffusion modify these classical results (e.g. Deloncle, Chomaz & Billant Reference Deloncle, Chomaz and Billant2007; Arobone & Sarkar Reference Arobone and Sarkar2012; Park et al. Reference Park, Prat, Mathis and Bugnet2021). The following discussion will be restricted to the configuration in which the flow and shear are along the horizontal, whereas the stratification or rotation component is along the vertical. In this case, only the three-dimensional stability of the flow is modified by stratification or rotation whereas the two-dimensional stability (i.e. in the horizontal plane) is unaffected.
The impact of a vertical stable stratification on the horizontal shear instability has been studied by Deloncle et al. (Reference Deloncle, Chomaz and Billant2007). They have demonstrated that the fastest growing mode remains two-dimensional even if Squire’s theorem no longer holds in a stratified fluid. However, the range of unstable vertical wavenumbers is broadened as the stratification increases, meaning that three-dimensional perturbations tend to be more unstable in stratified fluids than in homogeneous fluids.
In the presence of a background rotation about the vertical axis, the most unstable mode of the shear instability remains also two-dimensional but the band of unstable vertical wavenumbers shrinks as the rotation increases (Yanase et al. Reference Yanase, Flores, Métais and Riley1993; Arobone & Sarkar Reference Arobone and Sarkar2012). The inertial instability, which is of a different nature and is three-dimensional, can also exist in an intermediate range of anticyclonic background rotation when the Pedley criterion is satisfied (Pedley Reference Pedley1969). This criterion is the analogue for parallel shear flows of the generalised Rayleigh criterion for the centrifugal instability of vortices. Arobone & Sarkar (Reference Arobone and Sarkar2012) have also considered the combined effects of rotation and stable stratification. Their effects on the shear instability for non-zero vertical wavenumbers are globally the same as when each effect is considered separately.
Recently, Park et al. (Reference Park, Prat, Mathis and Bugnet2021) have considered the linear stability of a horizontally sheared flow, the hyperbolic tangent velocity profile, in stratified rotating fluids in presence of the non-traditional Coriolis force. This force, which comes from the horizontal component of background rotation, is generally neglected when studying geophysical and astrophysical flows. Such a `traditional’ approximation is legitimate if the vertical velocity is small compared with the horizontal velocity or if the flow is sufficiently away from the equator (Gerkema et al. Reference Gerkema, Zimmerman, Maas and van Haren2008). However, several works have demonstrated that small-scale processes can be affected by non-traditional effects: gravito–inertial waves (Gerkema & Shrira Reference Gerkema and Shrira2005) and their coupling with convectively induced turbulence (Mathis, Neiner & Tran Minh Reference Mathis, Neiner and Tran Minh2014), the dynamics of vortices (Toghraei & Billant Reference Toghraei and Billant2022, Reference Toghraei and Billant2025) or the inertial instability (Zeitlin Reference Zeitlin2018; Park et al. Reference Park, Prat, Mathis and Bugnet2021; Park & Mathis Reference Park and Mathis2025).
In presence of the non-traditional Coriolis force, Park et al. (Reference Park, Prat, Mathis and Bugnet2021) have shown that the horizontal shear instability can remain two-dimensional, if it is initially so, but with three velocity components, i.e. with a non-zero vertical velocity field due to the non-traditional Coriolis force. As a consequence, the stability problem depends on the non-dimensional Brunt–Väisälä frequency
 $N$
characterising the stratification and on the non-dimensional, non-traditional Coriolis parameter
 $\tilde {f}$
, both non-dimensionalised using the maximum shear. In the inviscid and non-diffusive limits, they have shown that the maximum growth rate decreases with
 $N$
and increases with
 $\tilde {f}$
. However, in the presence of strong thermal diffusion, which suppresses the effect of stratification, the classical results for the two-dimensional horizontal shear instability are recovered (Park et al. Reference Park, Prat, Mathis and Bugnet2021).
It is well known that the nonlinear evolution of the shear instability leads to the formation of periodic Kelvin–Helmholtz billows. In two-dimensional homogeneous fluids, these vortices remain coherent and are essentially stable except for the pairing instability (Corcos & Sherman Reference Corcos and Sherman1976; Patnaik, Sherman & Corcos Reference Patnaik, Sherman and Corcos1976; Klaassen & Peltier Reference Klaassen and Peltier1985a , Reference Klaassen and Peltierb , Reference Klaassen and Peltier1989). Nowadays, such a classical configuration serves even as a benchmark for testing numerical codes (Lecoanet et al. Reference Lecoanet, McCourt, Quataert, Burns, Vasil, Oishi, Brown, Stone and O’Leary2016). In contrast, in two-dimensional stably stratified vertically sheared layers, secondary instabilities of the primary Kelvin–Helmholtz vortices and of the braids inbetween can occur (Klaassen & Peltier Reference Klaassen and Peltier1991; Staquet Reference Staquet1995; Mashayek & Peltier Reference Mashayek and Peltier2012a , Reference Mashayek and Peltierb ). These secondary instabilities are shear-driven or buoyancy-driven. The latter one is due to the vorticity intensification made possible by baroclinic effects. A similar effect occurs in two-dimensional, incompressible, variable density shear flows (Reinaud, Joly & Chassaing Reference Reinaud, Joly and Chassaing2000; Fontane & Joly Reference Fontane and Joly2008). In addition, many studies have looked at the nonlinear three-dimensional evolution of the Kelvin–Helmholtz vortices in various configurations such as homogeneous fluids (Pierrehumbert & Widnall Reference Pierrehumbert and Widnall1982), stably stratified fluids with vertical shear (Mashayek & Peltier Reference Mashayek and Peltier2011, Reference Mashayek and Peltier2012a , Reference Mashayek and Peltierb ) or stratified and/or rotating fluids with horizontal shear (Smyth & Peltier Reference Smyth and Peltier1994; Basak & Sarkar Reference Basak and Sarkar2006; Arobone & Sarkar Reference Arobone and Sarkar2012, Reference Arobone and Sarkar2013; Cope, Garaud & Caulfield Reference Cope, Garaud and Caulfield2020). A wealth of different three-dimensional instabilities and nonlinear behaviours can occur but, since the present paper is restricted to a two-dimensional configuration, they will not be discussed further.
The present work develops upon Park et al. (Reference Park, Prat, Mathis and Bugnet2021) by studying the nonlinear evolution of the horizontal shear instability of the hyperbolic tangent velocity profile in the presence of stratification and non-traditional rotation. As justified later in § 2, the disturbances will be imposed to depend only on the horizontal coordinates, i.e. they will be two-dimensional, but with three velocity components. This configuration will allow us to concentrate only on the dynamics of the inflectional instability of an horizontal shear flow. Regarding the nonlinear evolution of the Goldreich–Schubert–Fricke (GSF) instability, which is analogous to inertial instability in the presence of strong thermal diffusion, we refer to the recent works by Barker et al. (Reference Barker, Jones and Tobias2019, Reference Barker, Jones and Tobias2020) and Dymott et al. (Reference Dymott, Barker, Jones and Tobias2023) which also consider the complete Coriolis acceleration.
The outline of the paper is as follows. In § 2, the problem and numerical methods are presented. Section 3.1 first presents typical nonlinear evolutions as the non-traditional Coriolis parameter and the Brunt–Väisälä frequency are varied. Sections 3.2 and 3.3 describe the effects of the stratification and horizontal rotation component on the evolutions of the kinetic and potential energies, as well as the enstrophy. In § 3.4, we investigate the origin of the secondary instabilities that are observed for weak and moderate stratification. Finally, in § 3.5, the strongly stratified limit is investigated in detail. It is shown that the governing equations in this limit can be transformed back into the traditional equations thanks to a change of variables. This allows us to derive scaling laws for the energies and they are tested against the results of the numerical simulations. Section 4 draws the conclusions and discusses the results in the context of stellar or planetary atmospheric/oceanic dynamics, before giving ideas for further research.
2. Methods
2.1. Formulation of the problem
2.1.1. Governing equations
We consider the incompressible Navier–Stokes equations under the Boussinesq and
 $f$
-plane approximations,
 \begin{align} \displaystyle \partial _t \boldsymbol{u}+(\boldsymbol{u}\boldsymbol{\cdot }\boldsymbol{\nabla })\boldsymbol{u}+\boldsymbol{f_{0}}\times \boldsymbol{u} &=-\frac {1}{\rho _0}\boldsymbol{\nabla } p+b\boldsymbol{e_{z}}+\nu _{0}{\nabla ^2}\boldsymbol{u}, \\[-9pt] \nonumber \end{align}
 \begin{align} \displaystyle \partial _t b+\boldsymbol{u}\boldsymbol{\cdot }\boldsymbol{\nabla }b+N_{0}^{2}w&=D_{0}{\nabla ^2}b, \\[-9pt] \nonumber \end{align}
 \begin{align} \displaystyle \boldsymbol{\nabla }\boldsymbol{\cdot }\boldsymbol{u}&=0, \\[9pt] \nonumber \end{align}
where
 $\boldsymbol{u}=(u, v, w)$
is the velocity field in Cartesian coordinates
 $(x,y,z)$
, with unit vectors
 $(\boldsymbol{e_x},\boldsymbol{e_y}, \boldsymbol{e_z})$
for the zonal, meridional and vertical directions, respectively (figure 1). Here
 $\boldsymbol{f_{0}}=(0,\tilde {f_{0}},f_{0})$
is the complete Coriolis vector with
 $f_{0}=2\varOmega _{0}\cos \theta$
and
 $\tilde {f_0}=2\varOmega _{0}\sin \theta$
the traditional and non-traditional Coriolis components, respectively, where
 $\varOmega _{0}$
is the angular velocity and
 $\theta$
is the colatitude (see figure 1). Here
 $p$
is the pressure,
 $b=-g\hat {\rho }/\rho _0$
is the buoyancy perturbation, where
 $g$
is the gravity, and the density has been decomposed as
 $\rho =\rho _0+\overline {\rho }(z)+\hat {\rho }(x,y,z,t)$
with
 $\rho _0$
a reference density,
 $\overline {\rho }$
the mean density profile and
 $\hat {\rho }$
the perturbation density. Here
 $\nu _{0}$
is the kinematic viscosity,
 $\displaystyle N_{0}=\sqrt {-g\partial _{z}\overline {\rho }/\rho _{0}}$
is the Brunt–Väisälä frequency and
 $D_{0}$
is the diffusivity of the stratifying agent, which could represent temperature or salinity.
(a) Sketch of the local Cartesian frame at the colatitude
 $\theta$
in a sphere rotating at rate
 $\varOmega _{0}$
. (b) Sketch of the horizontal shear flow in a local Cartesian frame. The colour gradient from yellow to orange illustrates the increasing density as
 $z$
decreases.

2.1.2. Base state
We consider as base velocity a horizontal shear flow with the classical hyperbolic tangent profile (figure 1 b) (Michalke Reference Michalke1964)
 \begin{align} \boldsymbol{U}=(U(y),0,0) \quad \textrm {with} \quad U(y)=U_0\,\textrm {tanh}\left (\frac {y}{L_0}-y_{c}\right )\!, \end{align}
where
 $U_0$
and
 $L_0$
are the characteristic velocity and length, respectively, and
 $y_{c}$
is the centre of the shear flow. Such a flow is a solution of (2.1) in the inviscid and non-diffusive limits in the presence of the base buoyancy field (Park et al. Reference Park, Prat, Mathis and Bugnet2021):
 \begin{align} B=-\tilde {f}_{0}U. \end{align}
This relation is derived from the vertical momentum equation and could be interpreted as the thermal wind balance in the presence of the full Coriolis acceleration.
2.1.3. Governing equations for the perturbations
The base state (2.2)–(2.3) is subjected to perturbations denoted by a hat:
 \begin{align} (u,v,w,p,b)=(U,0,0,P,B)+ \big(\hat {u},\hat {v},\hat {w},\hat {p},\hat {b} \big), \end{align}
where
 $P$
is the base pressure. By introducing this decomposition into (2.1) and by neglecting the viscous and mass diffusions of the base state, we obtain the governing equations for the perturbations:
 \begin{align} \displaystyle \partial _t \hat {u}+U\partial _x\hat {u}+\hat {v}\partial _yU+\boldsymbol{\hat {u}}\boldsymbol{\cdot }\boldsymbol{\nabla }\hat {u}-f_{0}\hat {v}+\tilde {f_{0}}\hat {w}&=-\frac {1}{\rho _{0}}\partial _x \hat {p}+\nu _{0}{\nabla ^2}\hat {u}, \\[-9pt] \nonumber \end{align}
 \begin{align} \displaystyle \partial _t \hat {v}+U\partial _x\hat {v}+\boldsymbol{\hat {u}}\boldsymbol{\cdot }\boldsymbol{\nabla }\hat {v}+f_{0}\hat {u}&=-\frac {1}{\rho _{0}}\partial _y \hat {p}+\nu _{0}{\nabla ^2}\hat {v}, \\[-9pt] \nonumber \end{align}
 \begin{align} \displaystyle \partial _t \hat {w}+U\partial _x\hat {w}+\boldsymbol{\hat {u}}\boldsymbol{\cdot }\boldsymbol{\nabla }\hat {w}-\tilde {f_{0}}\hat {u}&=-\frac {1}{\rho _{0}}\partial _{z}\hat {p}+\hat {b}+\nu _{0}{\nabla ^2}\hat {w}, \\[-9pt] \nonumber \end{align}
 \begin{align} \displaystyle \partial _t \hat {b}+U\partial _x\hat {b}+\hat {v}\partial _{y}B+\boldsymbol{\hat {u}}\boldsymbol{\cdot }\boldsymbol{\nabla }\hat {b}+N_{0}^2\hat {w}&=D_{0}{\nabla ^2}\hat {b}, \\[-9pt] \nonumber \end{align}
 \begin{align} \boldsymbol{\nabla }\boldsymbol{\cdot }\boldsymbol{\hat {u}}&=0. \\[9pt] \nonumber \end{align}
From (2.5), it can be seen that if the perturbations are independent of the vertical coordinate initially, they will remain two-dimensional for any time but with three velocity components due to the non-traditional Coriolis force (Toghraei & Billant Reference Toghraei and Billant2022). Hence, we can restrict the following study to two-dimensional perturbations depending only on the horizontal coordinates. This implies that the divergence (2.5e
) can be automatically satisfied by introducing a stream function
 $\hat {\psi }$
such as
 $\hat {u}=-\partial _y \hat {\psi }$
,
 $\hat{v}=\partial _x \hat {\psi }$
. As a consequence, the traditional Coriolis force can be written as
 $(-f_{0}\hat {v}, +f_{0}\hat {u},0)=-f_{0}\boldsymbol{\nabla }\hat {\psi }$
and therefore removed from (2.5) by redefining the pressure
 $\hat {p}\rightarrow \hat {p}-\rho _{0}f_{0}\hat {\psi }$
. Thus, (2.5) becomes formally independent of
 $f_{0}$
even if it is non-zero.
Finally, (2.5) is non-dimensionalised by using
 $L_{0}$
and
 $L_{0}/U_{0}$
as length and time units. It becomes
 \begin{align} \displaystyle \partial _t \hat {u}+U\partial _x\hat {u}+\hat {v}\partial _yU+\boldsymbol{\hat {u}}\boldsymbol{\cdot }\boldsymbol{\nabla }\hat {u}+\tilde {f}\hat {w}&=-\partial _x \hat {p}+\frac {1}{\textit{Re}}{\nabla ^2}\hat {u}, \\[-9pt] \nonumber \end{align}
 \begin{align} \displaystyle \partial _t \hat {v}+U\partial _x\hat {v}+\boldsymbol{\hat {u}}\boldsymbol{\cdot }\boldsymbol{\nabla }\hat {v}&=-\partial _y \hat {p}+\frac {1}{\textit{Re}}{\nabla ^2}\hat {v}, \\[-9pt] \nonumber \end{align}
 \begin{align} \displaystyle \partial _t \hat {w}+U\partial _x\hat {w}+\boldsymbol{\hat {u}}\boldsymbol{\cdot }\boldsymbol{\nabla }\hat {w}-\tilde {f}\hat {u}&=\hat {b}+\frac {1}{\textit{Re}}{\nabla ^2}\hat {w}, \\[-9pt] \nonumber \end{align}
 \begin{align} \displaystyle \partial _t \hat {b}+U\partial _x\hat {b}-\tilde {f}\hat {v}\partial _yU+\boldsymbol{\hat {u}}\boldsymbol{\cdot }\boldsymbol{\nabla }\hat {b}+N^2\hat {w}&=\frac {1}{\textit{Re} \textit{Sc}}{\nabla ^2}\hat {b}, \\[-9pt] \nonumber \end{align}
 \begin{align} \partial _x \hat {u}+\partial _y \hat {v}&=0, \\[9pt] \nonumber \end{align}
where
 \begin{align} N=\frac {N_{0}L_{0}}{U_{0}}, \quad \tilde {f}=\frac {\tilde {f_{0}}L_{0}}{U_{0}}, \quad \textit{Re}=\frac {U_{0}L_{0}}{\nu _{0}}, \quad \textit{Sc}=\frac {\nu _{0}}{D_{0}}, \end{align}
are the non-dimensional Brunt–Väisälä frequency, the non-dimensional non-traditional Coriolis parameter, the Reynolds number and the Schmidt number, respectively.
2.2. Numerical methods
Equations (2.6) are integrated by means of a Fourier pseudospectral method in a doubly periodic domain (Deloncle, Billant & Chomaz Reference Deloncle, Billant and Chomaz2008; Deloncle Reference Deloncle2007). The time integration is carried out by a fourth-order Runge–Kutta scheme except for the viscous and diffusive terms that are integrated exactly. The
 $2/3$
rule for dealiasing is used (i.e. the upper third of the modes in each direction is removed). The velocity field of the perturbation is initialised by a divergence-free random noise of amplitude 0.001 whereas the buoyancy
 $\hat {b}$
is initially set to zero. The form of the initial perturbation has no particular effect on the results. The random noise serves simply as a seed for the instability development.
The Reynolds number and the Schmidt number will be fixed to
 $ \textit{Re}=2000$
and
 $ \textit{Sc}=1$
throughout the paper. This value of
 $ \textit{Re}$
has been chosen so as to have weak viscous and diffusion effects with a reasonable computational cost. The effects of varying
 $ \textit{Re}$
and
 $ \textit{Sc}$
will be studied in a future paper.
The size
 $L_{x}$
of the domain (table 1) is set to the most amplified wavelength for each set of parameters
 $(\tilde {f}, N, \textit{Re}, \textit{Sc})$
. This prevents the occurrence of the pairing instability which leads to the merging of neighbouring Kelvin–Helmholtz vortices (Ho & Huerre Reference Ho and Huerre1984; Klaassen & Peltier Reference Klaassen and Peltier1989), allowing us to focus on the nonlinear evolution of the shear instability. However, in Appendix B, we present some simulations with
 $L_{x}$
equal to twice the dominant wavelength in which the pairing instability occurs. The size
 $L_{y}$
is chosen sufficiently large to minimise the effect of the periodic boundary conditions and the shear flow is centred in the domain
 $y_{c}=L_{y}/2$
. The resolution before dealiasing,
 $(N_{x}, N_{y})$
, is given in table 1 for four typical sets of parameters. It ranges from (512
 $\,\times \,$
512) to (1024
 $\,\times \,$
2048) depending on the size of the domain and whether or not there is a transition to small-scale turbulence. The time step has been chosen so as to satisfy the Courant–Friedrichs–Lewy condition for each case (table 1).
Summary of the physical and numerical parameters of typical simulations. Here
 $N$
is the non-dimensional Brunt–Väisälä frequency,
 $\tilde {f}$
the non-dimensional non-traditional parameter,
 $k_{x {m}}$
the most amplified wavenumber,
 $L_x$
and
 $L_{y}$
the sizes of the domain with
 $L_x=2\pi /k_{x {m}}$
,
 $N_x\times N_y$
the number of collocation points in the
 $x$
and
 $y$
directions,
 ${\rm d}t$
the time step,
 $k_{{max}}$
the maximum wavenumber and
 $k_{\eta }$
the Kolmogorov wavenumber. The Reynolds and Schmidt numbers are fixed to
 $ \textit{Re}=2000$
and
 $ \textit{Sc}=1$
throughout the paper.

When there is no transition to turbulence, (simulations denoted `traditional’, `traditional-like’ and `mixed’ in table 1), the accuracy of the simulations have been checked by running control simulations with a double resolution. In order to have the same initial conditions regardless of the resolution, the original simulations (with resolution
 $(N_{x}, N_{y})$
) and the control simulations (with resolution
 $(2N_{x}, 2N_{y})$
) have been initialised by the most unstable eigenmode with a small amplitude instead of a random noise. The total velocity has been observed to differ by less than 1 % at each common point between the two simulations. When there is a transition to turbulence (simulations denoted `non-traditional’ in table 1), the resolution has been fixed so as to have
 $k_{\textit{max}}/k_{\eta }\geqslant 1$
where
 $k_{{max}}$
is the highest wavenumber and
 $k_{\eta }=(\overline {\epsilon }/\nu _{0}^3)^{1/4}$
the Kolmogorov wavenumber, where
 $\overline {\epsilon }$
is the maximum value over time of the dissipation rate of kinetic energy averaged in space
 $\displaystyle \overline {\epsilon }= 1/(L_xL_yRe)\int \int (\boldsymbol{\nabla }\hat {u})^{2}{\rm d}x{\rm d}y$
(de Bruyn Kops & Riley Reference de Bruyn Kops and Riley1998).
Similarly, the effect of the periodic boundary conditions in the
 $y$
direction has been checked by increasing the size
 $L_{y}$
keeping the same resolution
 ${\rm d}y=L_{y}/N_{y}$
in simulations initialised by the most unstable eigenmode. When there is no transition to turbulence, the evolution of the total kinetic energy of the perturbations has been found to differ by less than 2 % when the size is doubled. For the simulation `non-traditional’ in table 1 for which turbulence arises, a maximum instantaneous difference of 5 % has been observed before t
 $=$
100 when
 $L_{y}$
is increased from 72 to 144. However, for
 $t\gt 100$
, the difference increases up to 15 % due to the high sensitivity of turbulence on initial conditions.
In general, the simulations require a larger resolution and a larger size
 $L_{y}$
as
 $\tilde {f}$
is increased for a given buoyancy frequency, especially for low values of
 $N$
. In order to keep computational costs reasonable, the highest value of
 $\tilde {f}$
that has been achieved for each
 $N$
for
 $ \textit{Re}=2000$
is
 $\tilde {f}=N$
.
As mentioned before, the viscous and mass diffusions of the base state are neglected in (2.6). This approximation is tested in Appendix A, for two simulations of table 1, against simulations where the base state is allowed to decay. It is shown that simulations that take into account the base state dissipations are very similar, both qualitatively and quantitatively, to those presented in the following since the Reynolds number is large
 $ \textit{Re}=2000$
.
2.3. Linear stability analysis
Prior to performing a nonlinear simulation for a given set of parameters, the most unstable eigenmode has been determined. To do so, (2.6) without nonlinear terms have been integrated over a long time in several simulations for different horizontal sizes
 $L_{x}$
, i.e. different streamwise wavenumbers
 $k_{x}=2\pi /L_{x}$
. The perturbation then tends towards the most unstable eigenmode in each simulation. Provided that the instability is non-oscillatory, its growth rate can be retrieved from
 \begin{align} \sigma =\lim _{t\rightarrow \infty }\frac {1}{2}\frac {d\ln (\hat {K})}{{\rm d}t}, \end{align}
where
 $\hat {K}$
is the perturbation’s kinetic energy integrated over the domain. The horizontal size
 $L_{x}$
in the nonlinear simulation has been then fixed to
 $L_{x}=2\pi /k_{x{m}}$
, where
 $k_{x{m}}$
is the wavenumber yielding the maximum growth rate,
 $\sigma_m=\textrm{max}(\sigma)$
. Figure 2(a) shows the results of the linear stability analysis for the set of parameters
 $(N, \tilde {f})$
studied by Park et al. (Reference Park, Prat, Mathis and Bugnet2021) by means of a pseudospectral Chebyshev method in the inviscid and non-diffusive limits. The results for the parameters listed in table 1 are also displayed. The growth rates obtained by the present method (symbols) are in good agreement with those of Park et al. (Reference Park, Prat, Mathis and Bugnet2021) (solid lines) for all the wavenumbers
 $k_{x}$
investigated, even if the Reynolds number is here
 $ \textit{Re}=2000$
. This validates our numerical method and indicates that viscous and diffusive effects have a very weak impact on the stability of the tangent hyperbolic profile for
 $ \textit{Re}=2000$
and
 $ \textit{Sc}=1$
.
(a) Growth rate
 $\sigma$
as a function of the wavenumber
 $k_{x}$
for different parameters
 $(N, \tilde {f})$
, coming from Park et al. (Reference Park, Prat, Mathis and Bugnet2021) and from the cases listed in table 1. The lines represent the results of Park et al. (Reference Park, Prat, Mathis and Bugnet2021) in the inviscid limit, whereas the symbols show the present results for
 $ \textit{Re}=2000$
and
 $ \textit{Sc}=1$
. (b) Rescaled growth rate
 $\sigma \sqrt {\alpha }$
as a function of the rescaled wavenumber
 $k_{x}\sqrt {\alpha }$
, where
 $\alpha =N^{2}/(\tilde {f}^{2}+N^{2})$
.

Since only the most unstable mode is computed for a given
 $k_{x}$
, i.e. for a given size
 $L_{x}$
of the domain, our method does not allow us to compute the growth rate of too low wavenumber
 $k_{x}$
because, then, the mode is dominated by the one for 2
 $k_{x}$
if it has a larger growth rate. However, this limitation is not a problem here since we are interested only by the most amplified wavenumber for each set of parameters
 $(N, \tilde {f})$
.
As discussed by Park et al. (Reference Park, Prat, Mathis and Bugnet2021), figure 2(a) shows that the non-traditional Coriolis force is destabilising when
 $N\geqslant 1$
since the maximum growth rate
 $\sigma _{{m}}$
increases with
 $\tilde {f}$
for a given value of
 $N$
and is always larger than the one in the traditional limit
 $\tilde {f}=0$
:
 $\sigma _{{m}}=0.1891$
. In contrast, the maximum growth rate decreases as
 $N$
increases for a given value of
 $\tilde {f}$
. It is also noteworthy that the most amplified wavenumber
 $k_{x{m}}$
tends to increase with
 $\tilde {f}$
and to decrease with
 $N$
. When
 $N\gg$
1, it is always larger than the value
 $k_{x{m}}=0.44$
in the traditional limit (figure 2
a). In contrast, for
 $(N, \tilde f)=(0.5,0.5)$
, the maximum growth rate and most amplified wavenumber are both lower than for
 $\tilde f=0$
. Figure 2(b) will be discussed in § 3.5.
3. Nonlinear dynamics
3.1. Exploration of the parameter space
Many nonlinear simulations have been performed for different values of
 $N$
and
 $\tilde {f}$
in the ranges
 $0\leqslant N\leqslant 5$
, and
 $0\leqslant \tilde {f}\leqslant \textrm {min}(N, 2.5)$
. Only positive values of
 $\tilde {f}$
have been considered since (2.6) is invariant under the changes
 $\tilde {f}, \hat {w}, \hat {b} \rightarrow -\tilde {f}, -\hat {w}, -\hat {b}$
. As mentioned before, the horizontal size
 $L_{x}$
has been considered as
 $L_{x}=2\pi /k_{xm}$
, where
 $k_{xm}$
is the wavelength of the most unstable mode determined by linear stability analysis for each set of parameters
 $(N,\tilde {f})$
. Figure 3 summarises all the simulations in the parameter space
 $(N, \tilde {f})$
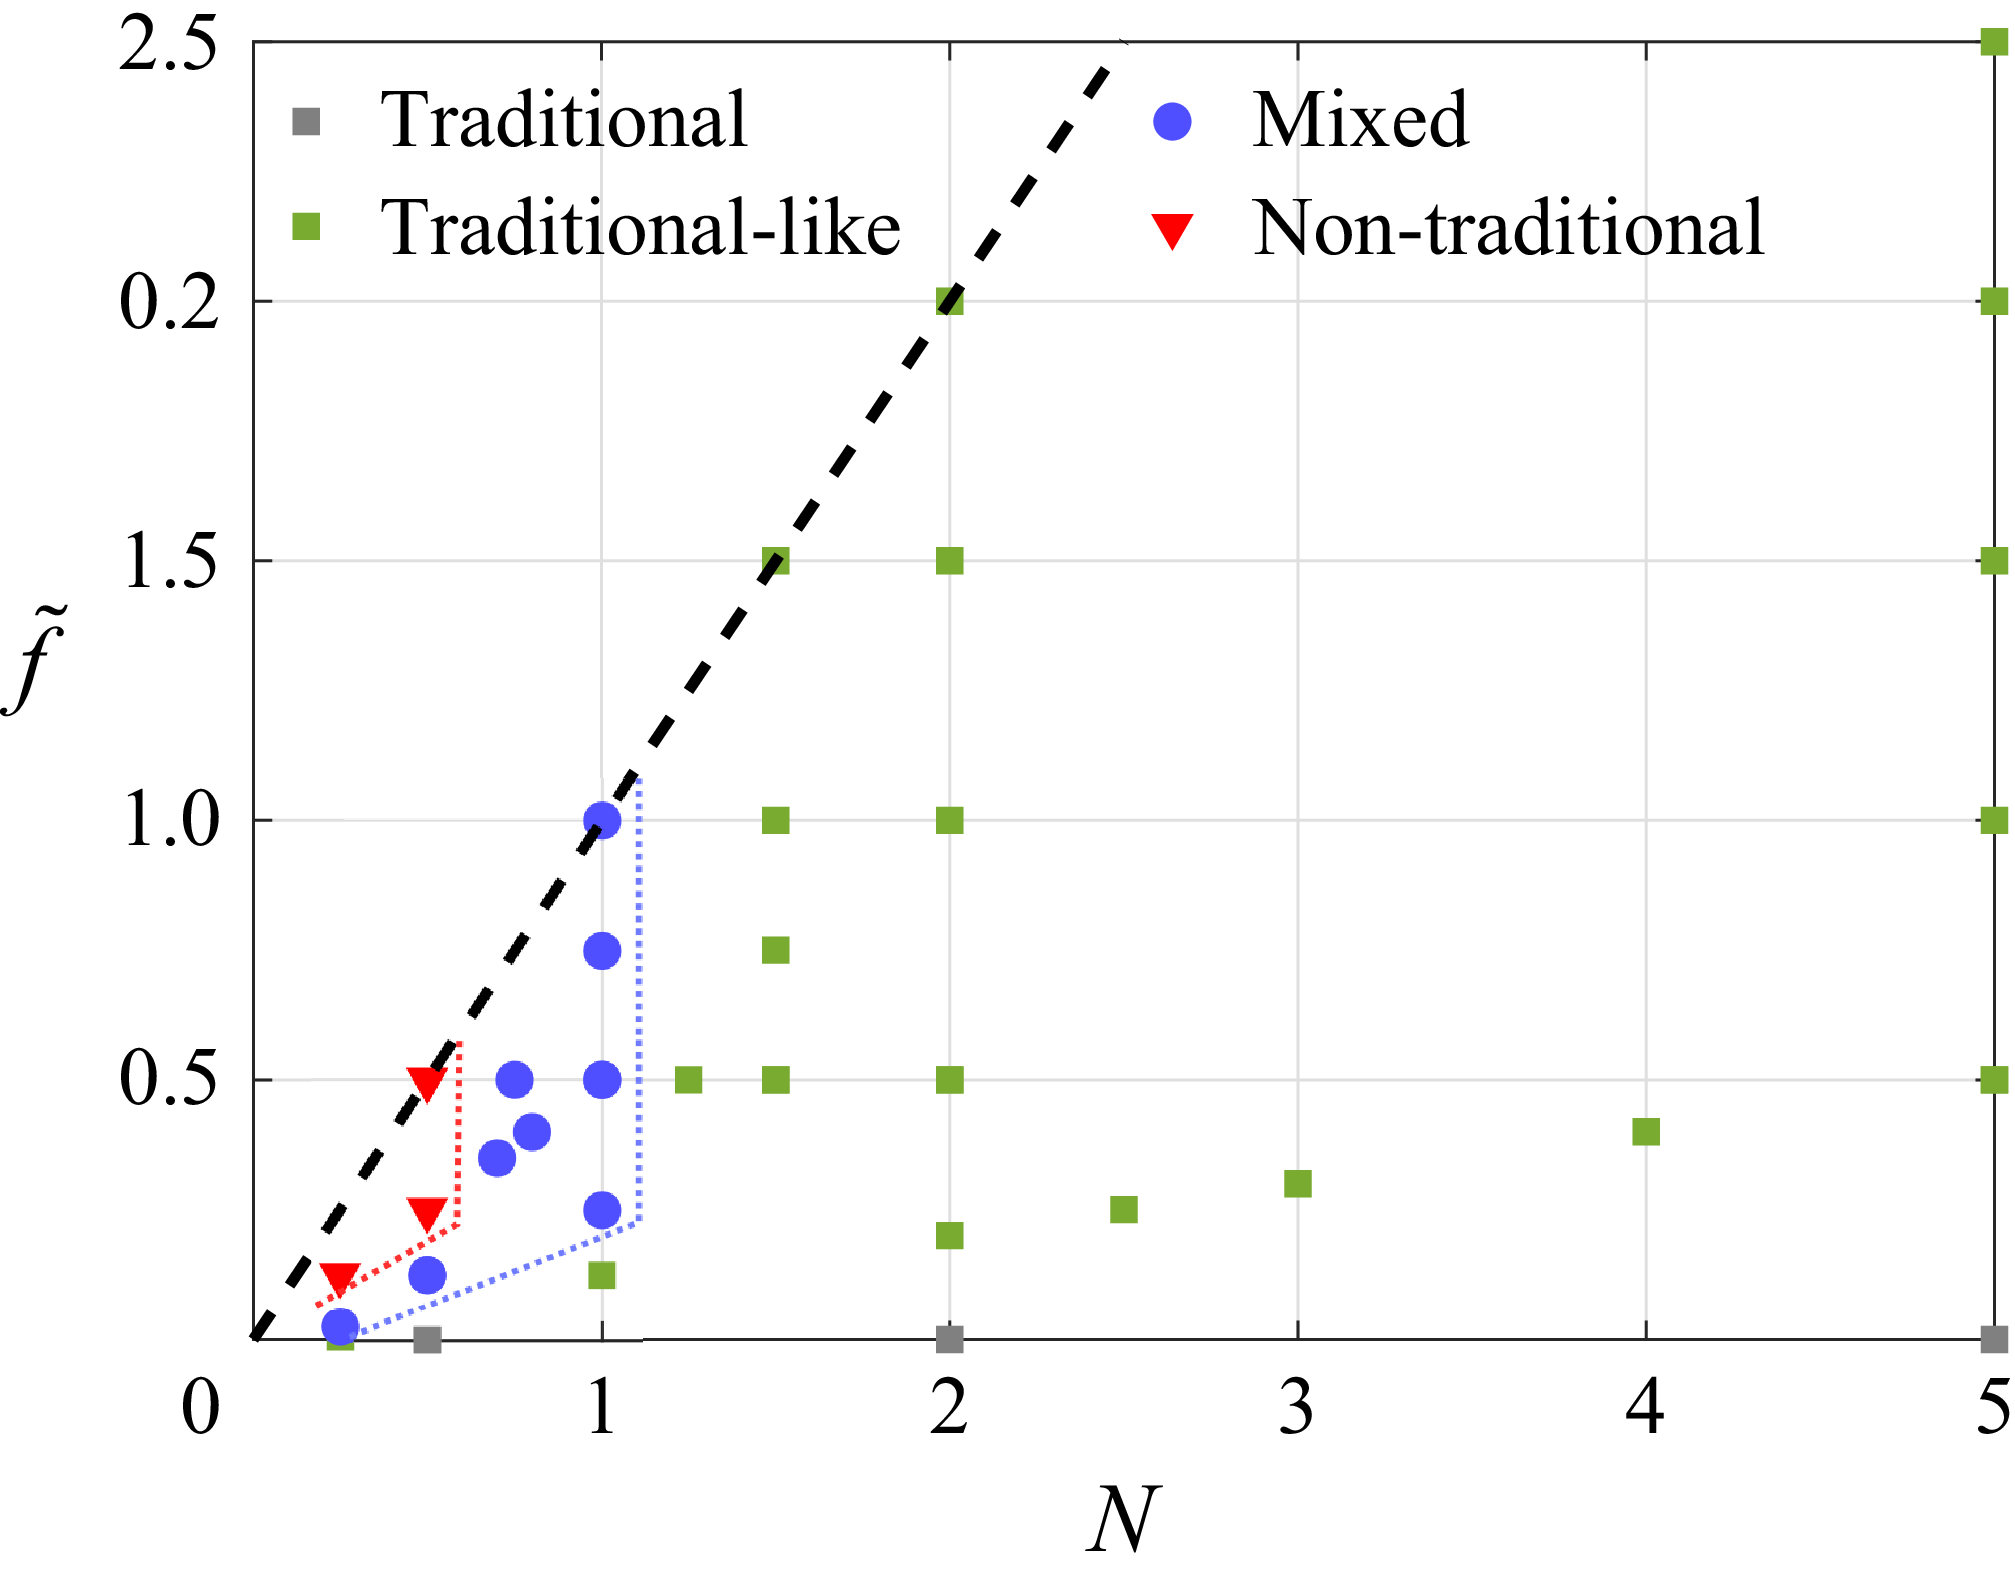
. Four distinct nonlinear evolutions have been observed as indicated by the different symbols in figure 3. The limits between the different domains are indicated approximately by red and blue dotted lines.
Map of the simulations in the parameter space
 $(N,\tilde {f})$
for
 $ \textit{Re}=2000$
and
 $ \textit{Sc}=1$
. Grey, green, blue and red symbols represent the simulations where ‘traditional’, ‘traditional-like’, ‘mixed’ and ‘non-traditional’ behaviours have been observed, respectively. The black dashed line corresponds to the line
 $N=\tilde {f}$
delimiting the explored region in the present paper. The blue and red dotted lines indicate approximately the limits of the ‘mixed’ domain.

Total vertical vorticity (
 $\xi =\partial _x v-\partial _y u$
) at (a)
 $t=60$
, (b)
 $t=67$
, (c)
 $t=78$
, (d)
 $t=200$
for
 $\tilde {f}=0$
,
 $ \textit{Re}=2000$
and
 $ \textit{Sc}=1$
(traditional evolution).

Same as figure 4 but for
 $(N, \tilde {f})=(2, 1.5)$
and (a)
 $t=51$
, (b)
 $t=58$
, (c)
 $t=70$
, (d)
 $t=200$
(traditional-like evolution).The
 $y$
-axis has been cropped compared with the original computational domain.

Same as figure 4 but for
 $(N, \tilde {f})=(1, 0.5)$
and (a)
 $t=65$
, (b)
 $t=73$
, (c)
 $t=145$
, (d)
 $t=200$
(mixed evolution).The
 $y$
-axis has been cropped compared with the original computational domain.

Same as figure 4 but for
 $(N, \tilde {f})=(0.5, 0.5)$
and (a)
 $t=89$
, (b)
 $t=110$
, (c)
 $t=119$
, (d)
 $t=146$
(non-traditional evolution). The
 $y$
-axis has been cropped compared with the original computational domain.

First, the traditional evolution (figure 4) is observed for
 $\tilde {f}=0$
and any value of
 $N$
since the governing equations for the horizontal velocity ((2.5a
), (2.5b
), (2.5e
)) are decoupled from those for
 $\hat {w}$
,
 $\hat {b}$
((2.5c
), (2.5d
)) when
 $\tilde {f}=0$
. As seen in figure 4, the total vertical vorticity
 $\xi =\partial _x v-\partial _y u$
evolves towards a quasisteady vortex. No pairing instability occurs since the streamwise length of the domain
 $L_{x}$
accommodates only one wavelength. As already mentioned, Appendix B describes the consequences of allowing two wavelengths to develop within a double-sized domain for the parameters
 $(N,\tilde {f})=(0.5, 0.5)$
.
When the stratification is sufficiently strong
 $N\gtrsim 1$
for any value of
 $\tilde {f}$
or when
 $N\lesssim 1$
for sufficiently low values of
 $\tilde {f}$
(green symbols in figure 3), the evolution of the total vertical vorticity (figure 5) is very similar to the one observed in the traditional limit. However, we can notice the generation of positive vorticity in the (reddish) region surrounding the vorticity braid. The negative vorticity also goes slightly below the initial minimum value
 $-1$
. This contrasts with the traditional case where the vertical vorticity is conserved in the inviscid limit and remains in the range
 $-1\leqslant \xi \leqslant 0$
for
 $ \textit{Re}=2000$
(figure 4). However, the instability generates a stable and coherent vortex like in figure 4. These cases will be called `traditional-like’ since we will see in the following that some differences exist compared with the traditional scenario depending on
 $N$
and
 $\tilde {f}$
.
For moderate stratification
 $0.7\lesssim N\lesssim 1$
and sufficiently large values of
 $\tilde {f}$
or for
 $N \lesssim 0.5$
and intermediates values of
 $\tilde {f}$
(blue symbols in figure 3), the total vertical vorticity first evolves like in the traditional case (figures 6
a and 6
b) but, subsequently, small secondary vortices develop within the core of the primary Kelvin–Helmholtz vortex (figures 6
c and 6
d). Nevertheless, it keeps its integrity. We can also notice that thin positive vorticity layers are generated and entrained inside or at the periphery of the Kelvin–Helmholtz vortex (figure 6
b,c,d). In addition, the minimum of the vertical vorticity decreases significantly below the initial value
 $-1$
. Such evolution will be termed as `mixed’ in the following.
Finally, when the stratification is weak
 $(N\leqslant 0.5)$
and
 $\tilde {f}$
larger than a critical value depending on
 $N$
(
 $\tilde {f}\geqslant$
0.25 for
 $N=0.5$
and
 $\tilde {f}\geqslant$
0.125 for
 $N=0.25$
, red symbols in figure 3), the nonlinear evolution of the shear instability differs widely from the traditional case (figure 7). Thin layers with large positive and negative values of vertical vorticity are generated (figure 7
b) and, subsequently, stretched and amplified (figure 7
c) leading to an abrupt transition to small-scale turbulence (figure 7
d). This evolution will be called `non-traditional’ in the following. It is also noteworthy that the size in the
 $y$
direction of the developing Kelvin–Helmholtz billow is around 12, i.e. twice the one for the traditional case (figure 7
b compared with figure 4
c). This is the main reason why the size of the domain
 $L_{y}$
has to be increased for small and moderate values of
 $N$
as
 $\tilde {f}$
is increased (table 1). We can also notice that the shear instability appears slightly later (figure 7
a) since its growth rate is somewhat smaller than in the traditional limit (figure 2
a). Although this regime is represented by only three points in the parameter space (figure 3), several preliminary simulations with a lower resolution for other parameter values in this region are fully consistent with the existence of this regime.
The origin of these different behaviours of the vertical vorticity field is the vertical velocity and buoyancy. Indeed, while they are zero in the traditional limit, we see that the non-traditional Coriolis acceleration forces the vertical momentum (2.6c
) as soon as the streamwise velocity perturbation
 $\hat u$
is non-zero. Similarly, the advection of the base buoyancy
 $B$
by the cross-stream velocity
 $\hat v$
forces the buoyancy (2.6d
). In turn, the non-traditional Coriolis acceleration due to the vertical velocity forces the horizontal momentum (2.6a
). Equivalently, looking at the vertical vorticity equation,
 \begin{align} \frac {D \xi }{Dt}=\partial _{t}\hat {\xi }+U\partial _{x}\hat {\xi }-\hat {v}\partial _{y}^{2}U+\boldsymbol{\hat {u}}\boldsymbol{\cdot }\boldsymbol{\nabla }\hat {\xi }=\tilde {f}\partial _{y}\hat {w}+\frac {1}{\textit{Re}}{\nabla ^{2}}\hat {\xi }, \end{align}
where
 $D/Dt$
is the Lagrangian derivative and
 $\hat {\xi }=\partial _{x}\hat {v}-\partial _{y}\hat {u}$
is the vertical vorticity perturbation, we see that the right-hand side contains a tilting term of the horizontal background vorticity by the vertical velocity:
 $\tilde {f}\partial _{y}\hat {w}$
.
Figure 8 shows the vertical velocity at one instant for the traditional-like, mixed and non-traditional simulations. The instant displayed corresponds to the ones in figures 5(c), 6(b), 7(b), i.e. at the beginning of the nonlinear saturation regime and prior to the onset of secondary instabilities when they develop. In the three cases, the vertical velocity field has a global dipolar structure with positive/negative values on the left/right of the core of the primary vortex. Hence, the tilting term
 $\tilde {f}\partial _{y}\hat {w}$
of (3.1) is negative in the transverse band encompassing the vortex core and positive outside of it. This explains the appearance of vorticity in the regions surrounding the core and the braid (reddish and blueish regions in figures 5, 6, 7). In addition, thin bands of enhanced vertical velocity are superimposed on the dipolar structure of the vertical velocity, especially when
 $N \le 1$
. However, the main difference between the three cases is the amplitude of the vertical velocity: while its maximum is around 0.15 in figure 8(a), it is two and 10 times larger in figures 8(b) and 8(c), i.e. of the same order as the horizontal velocity. It is therefore not surprising that the vertical vorticity dynamics can be more or less modified compared with the traditional case due to the tilting term
 $\tilde {f} \partial _y \hat w$
on the right-hand side of (3.1).
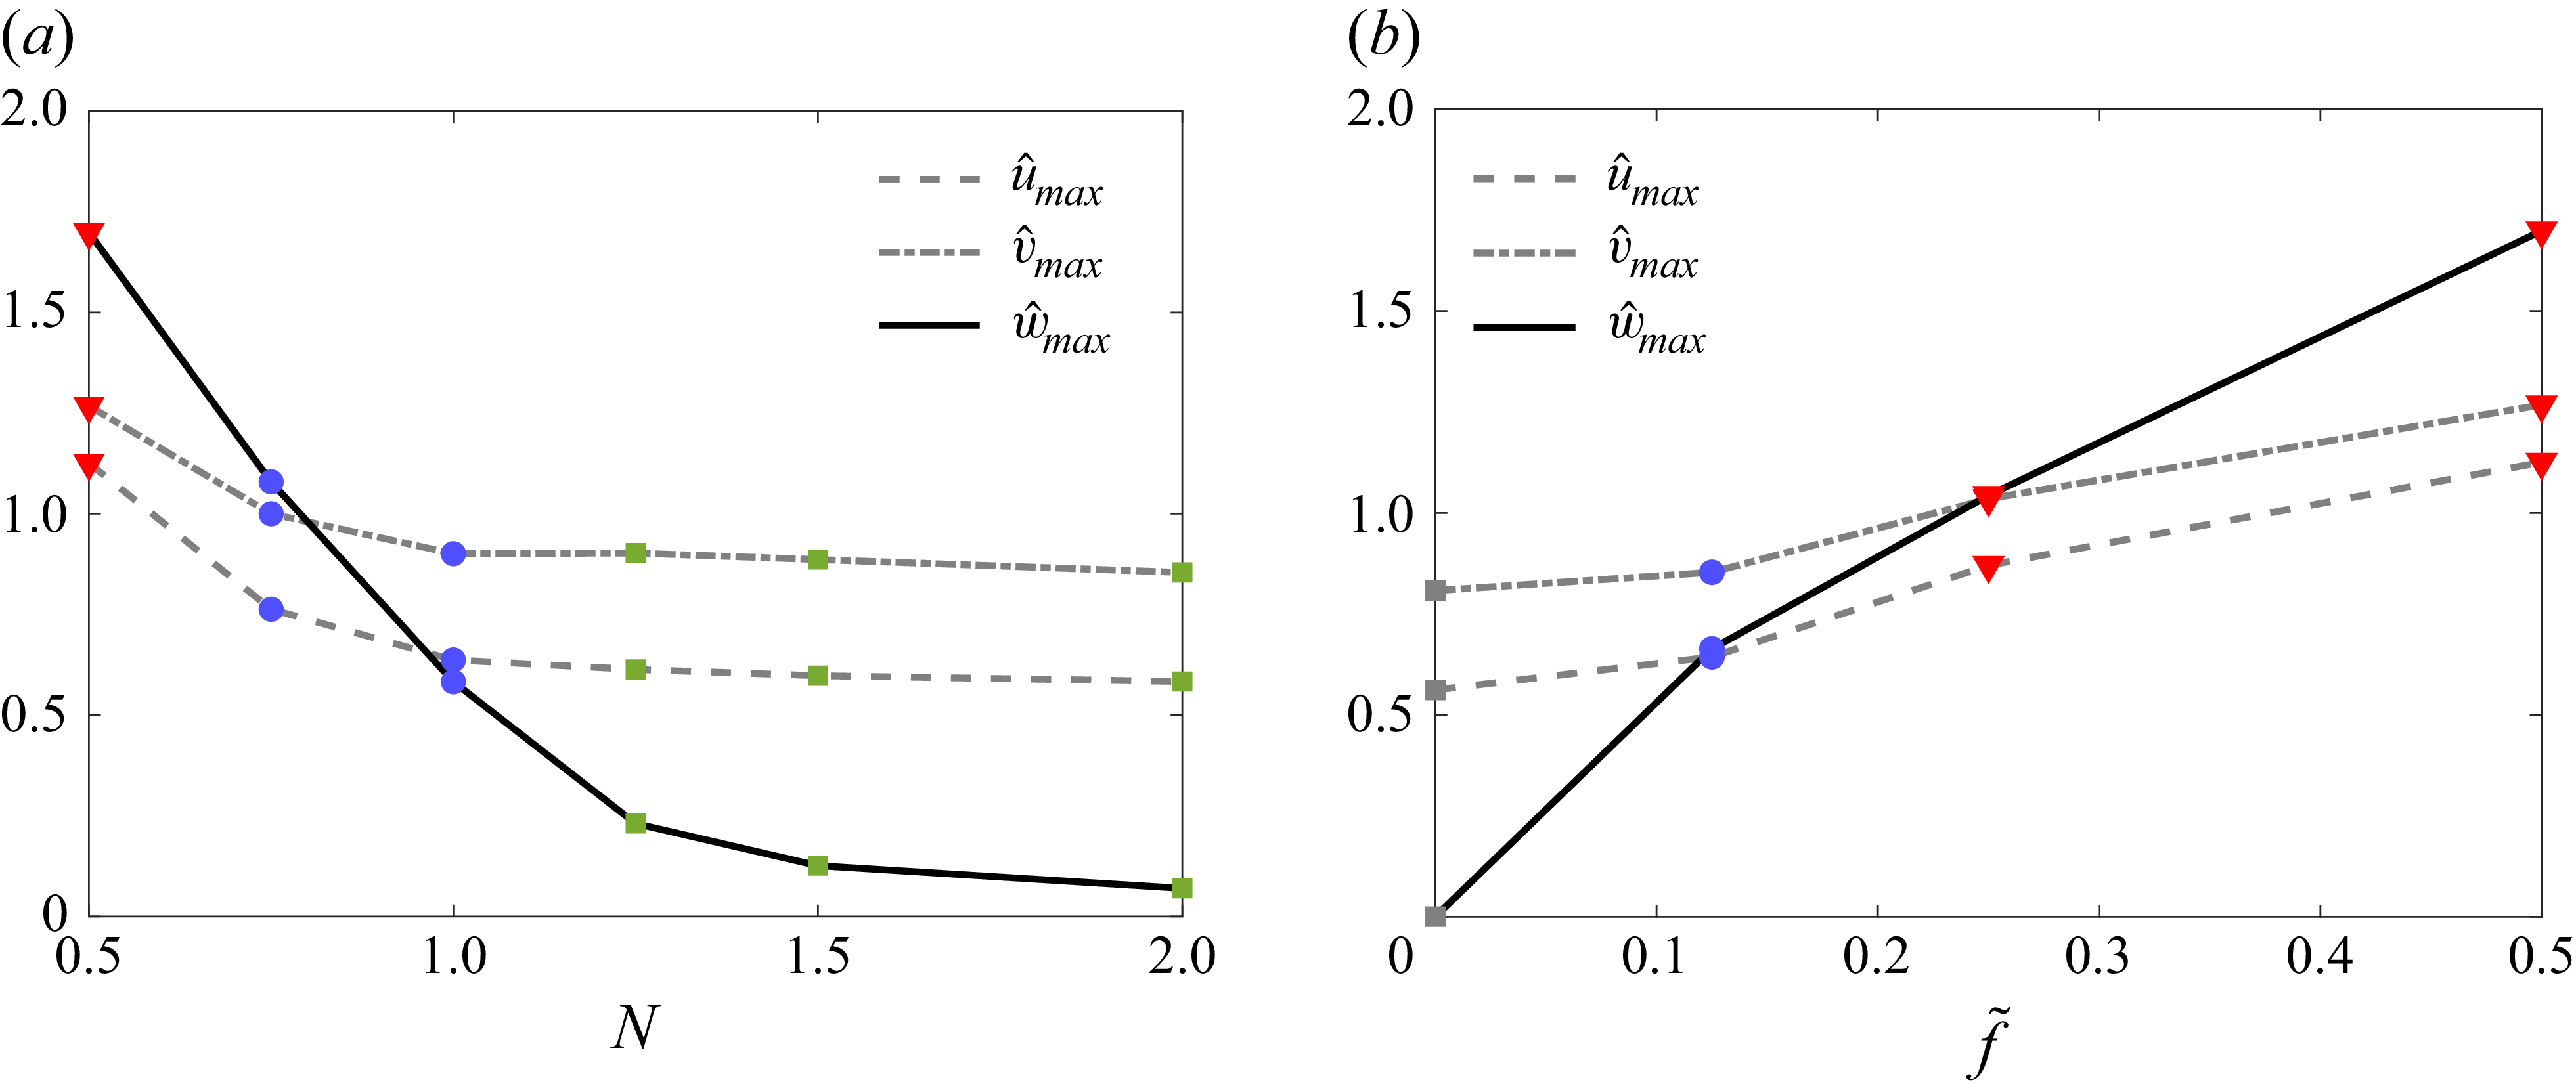
Figure 9 summarises the maxima of the three velocity components of the perturbation observed at the times prior to the onset of secondary instabilities (when they occur), for varying
 $N$
for
 $\tilde {f}=0.5$
(figure 9
a) and for varying
 $\tilde {f}$
for
 $N=0.5$
(figure 9
b). We see that the maximum of the vertical velocity increases when
 $N$
decreases for a fixed
 $\tilde {f}$
or when
 $\tilde {f}$
increases for a constant value of
 $N$
. In contrast, the maxima of the horizontal velocities (
 $\hat {u}_{{max}}$
and
 $\hat {v}_{{max}}$
) vary much less and remain always of order unity. The non-traditional and traditional-like evolutions are observed when the maximum vertical velocity is typically larger and much smaller than the maxima of the horizontal velocity components, respectively. The mixed evolution occurs when the maximum vertical velocity is in the intermediate range between these two cases.
Vertical velocity for (a)
 $(N,\tilde {f})=(2,1.5)$
,
 $t=70$
, (b)
 $(N,\tilde {f})=(1,0.5)$
,
 $t=73$
, (c)
 $(N,\tilde {f})=(0.5,0.5)$
,
 $t=110$
for
 $ \textit{Re}=2000$
and
 $ \textit{Sc}=1$
.

Maximum of the velocity component of the perturbation
 $\hat {w}$
(solid line),
 $\hat {u}$
(dashed line),
 $\hat {v}$
(dashed dotted line) observed at the beginning of the saturated regime and before the onset of secondary instabilities as a function of (a)
 $N$
for
 $\tilde {f}=0.5$
and (b)
 $\tilde {f}$
for
 $N=0.5$
. The symbols indicate the different nonlinear behaviours as in figure 3.

The approximate boundaries between the different domains in the parameter space depend both on
 $N$
and
 $\tilde {f}$
(red and blue dotted lines in figure 3). Although there are only few points in some regions, they seem, however, to occur for fixed values of the non-dimensional buoyancy frequency
 $N$
:
 $N \simeq 0.5$
and
 $N \simeq 1$
, for sufficiently large
 $\tilde {f}$
. This feature is reminiscent of the dynamics of a vertical vortex under the complete Coriolis acceleration in a stratified fluid (Toghraei & Billant Reference Toghraei and Billant2022). A strong vertical velocity field is generated when the buoyancy frequency is smaller than the maximum angular velocity of the vortex. This field develops near the critical radius where the angular velocity of the vortex is equal to the buoyancy frequency. In turn, the vertical velocity generates an anomaly of vertical vorticity which may trigger a shear instability above a critical non-traditional Coriolis parameter which depends on the Reynolds number.
In the present case, when the non-traditional parameter is weak, the vortex generated by the Kelvin–Helmholtz instability has a maximum absolute angular velocity approximately equal to 1/2 since the minimum vertical vorticity is around −1. Therefore, if the same mechanism as in Toghraei & Billant (Reference Toghraei and Billant2022) is at play, we could expect that strong vertical velocities may develop via critical layers when the non-dimensional Brunt–Väisälä frequency is less than
 $1/2$
. Since this critical value should probably be considered only as an order of magnitude, it could explain why the transition between the regimes in figure 3 seem to occur for fixed values of the non-dimensional buoyancy frequency
 $N$
. In addition, the thin bands of enhanced vertical velocity seen in figure 8 could be a signature of the presence of critical layers. However, it is difficult to make more quantitative comparisons since, here, the dynamics is more intricate and complicated than in Toghraei & Billant (Reference Toghraei and Billant2022). In particular, the Kelvin–Helmholtz vortex and the vertical velocity field develop concomitantly and there is an instantaneous mutual interaction between them, while the vortex is assumed to pre-exist in the study of Toghraei & Billant (Reference Toghraei and Billant2022).
3.2. Energy analysis
We now study the influence of the parameters
 $N$
and
 $\tilde {f}$
on the evolution of the kinetic and potential energies of the perturbations, defined as
 \begin{align} \hat {K}=\frac {1}{2L_{x}}\int _0^{L_x}\int _0^{L_y} \big(\hat {u}^2+\hat {v}^2+\hat {w}^2 \big){\rm d}y {\rm d}x, \quad \hat {P}=\frac {1}{2L_{x}}\frac {1}{N^2}\int _0^{L_x}\int _0^{L_y}\hat {b}^2\,{\rm d}y {\rm d}x, \end{align}
respectively. The surface integrals in (3.2) are normalised by
 $L_{x}$
, i.e. these energies are per unit wavelength in order to be able to compare simulations for different wavelengths. In contrast, they are not normalised by
 $L_y$
because the perturbations decay in the
 $y$
direction. In other words, the energies are
 $x$
-averaged and
 $y$
-integrated.
The kinetic energy can be further decomposed into horizontal and vertical components:
 \begin{align} \hat {K}_h=\frac {1}{2L_{x}}\int _0^{L_x}\int _0^{L_y} \big(\hat {u}^2+\hat {v}^2 \big){\rm d}y {\rm d}x, \quad \hat {K}_v=\frac {1}{2L_{x}}\int _0^{L_x}\int _0^{L_y}\hat {w}^2\,{\rm d}y {\rm d}x. \end{align}
Evolutions of the (a,b) horizontal kinetic energy, (c,d) vertical kinetic energy and (e,f), potential energy of the perturbations for different stratifications
 $N$
and non-traditional parameter
 $\tilde {f}$
values for
 $ \textit{Re}=2000$
,
 $ \textit{Sc}=1$
: (a,c,e)
 $\tilde {f}=0.5$
and
 $N$
variable; (b,d,f)
 $N=2$
and
 $\tilde {f}$
variable.

Figure 10(a,c,e) shows the evolution of the horizontal and vertical kinetic energy and potential energy of the perturbations, for varying stratification
 $N$
and a non-traditional parameter fixed to
 $\tilde {f}=0.5$
. They all start at small values corresponding to the amplitude of the white noise and, after a transient period, increase exponentially before nonlinear saturation. However, the level of saturation oscillates slightly but regularly, especially when
 $N\geq 1$
. As discussed by Klaassen & Peltier (Reference Klaassen and Peltier1985a
) and Klaassen & Peltier (Reference Klaassen and Peltier1991), the oscillation is linked to a nutation of the Kelvin–Helmholtz vortex, during which an exchange of energy between the mean-flow and the perturbations occurs. The four typical nonlinear evolutions described in the previous section are present in figure 10(a,c,e), namely: traditional (figure 4), traditional-like for
 $N=2$
and
 $N=5$
(figure 5), mixed for
 $N=1$
and
 $N=0.75$
(figure 6) and non-traditional for
 $N=0.5$
(figure 7). As seen in figure 10(a), the level of saturation of the horizontal kinetic energy decreases as
 $N$
increases and tend, when
 $N\geqslant 1$
, to the traditional case (dashed line). When
 $N$
increases, the levels of saturation of the vertical kinetic energy and potential energy also decrease but in a much more pronounced manner than the horizontal kinetic energy. They are identically zero in the traditional limit (hence, not plotted), very low for
 $N=5$
while for
 $N=0.5$
, they are comparable to the horizontal kinetic energy. In § 3.5, we will further investigate what govern the levels of saturation of these different energies.
In turn, figure 10(b,d,f) show the evolution of the energies for a fixed stratification
 $N=2$
and varying
 $\tilde {f}$
. In this case, all the simulations shown exhibit a traditional-like behaviour. The growth rate and level of saturation of the horizontal kinetic energy slightly increases with
 $\tilde {f}$
but remains close to the one in the traditional limit (figure 10
b). In contrast, the amplitudes of saturation of the vertical kinetic energy and potential energy (figure 10
d,f) increase strongly with
 $\tilde {f}$
but they remain below the level of the horizontal kinetic energy for
 $\tilde {f}\leqslant N$
. Analytical expressions for the energies in terms of
 $N$
and
 $\tilde {f}$
will be derived in § 3.5 in the limit of strong stratification. In summary, the stratification and non-traditional effects have a competing influence on the nonlinear dynamics of the shear instability: when the stratification is increased keeping
 $\tilde {f}$
constant, the evolutions of the energies tend to the traditional ones while, when the non-traditional parameter is increased for fixed
 $N$
, they depart more and more from the traditional case.
3.3. Enstrophy analysis
The evolution of the total enstrophy,
 \begin{align} Z=\frac {1}{2L_{x}}\int _0^{L_x}\int _0^{L_y}\boldsymbol{\omega }^{2}\,{\rm d}y {\rm d}x, \end{align}
where
 $\boldsymbol{\omega }$
is the total vorticity
 $\boldsymbol{\omega }=\boldsymbol{\omega _{h}}+\xi \boldsymbol{e_{z}}$
, with
 $\boldsymbol{\omega _{h}}=\partial _{y}w\boldsymbol{e_{x}}-\partial _{x}w\boldsymbol{e_{y}}$
the horizontal vorticity, has been studied for the four simulations presented in § 3.1. Like for the energy, the total enstrophy can be further decomposed into horizontal and vertical components,
 \begin{align} Z_{h}=\frac {1}{2L_{x}}\int _0^{L_x}\int _0^{L_y}\omega _{h}^{2}\,{\rm d}y {\rm d}x, \quad Z_{v}=\frac {1}{2L_{x}}\int _0^{L_x}\int _0^{L_y}\xi ^{2}\,{\rm d}y {\rm d}x. \end{align}
Equivalent quantities denoted with a hat
 $\hat {Z}$
,
 $\hat {Z}_{h}$
,
 $\hat {Z}_{v}$
can be defined for the vorticity of the perturbation
 $\boldsymbol{\hat {\omega }}$
.
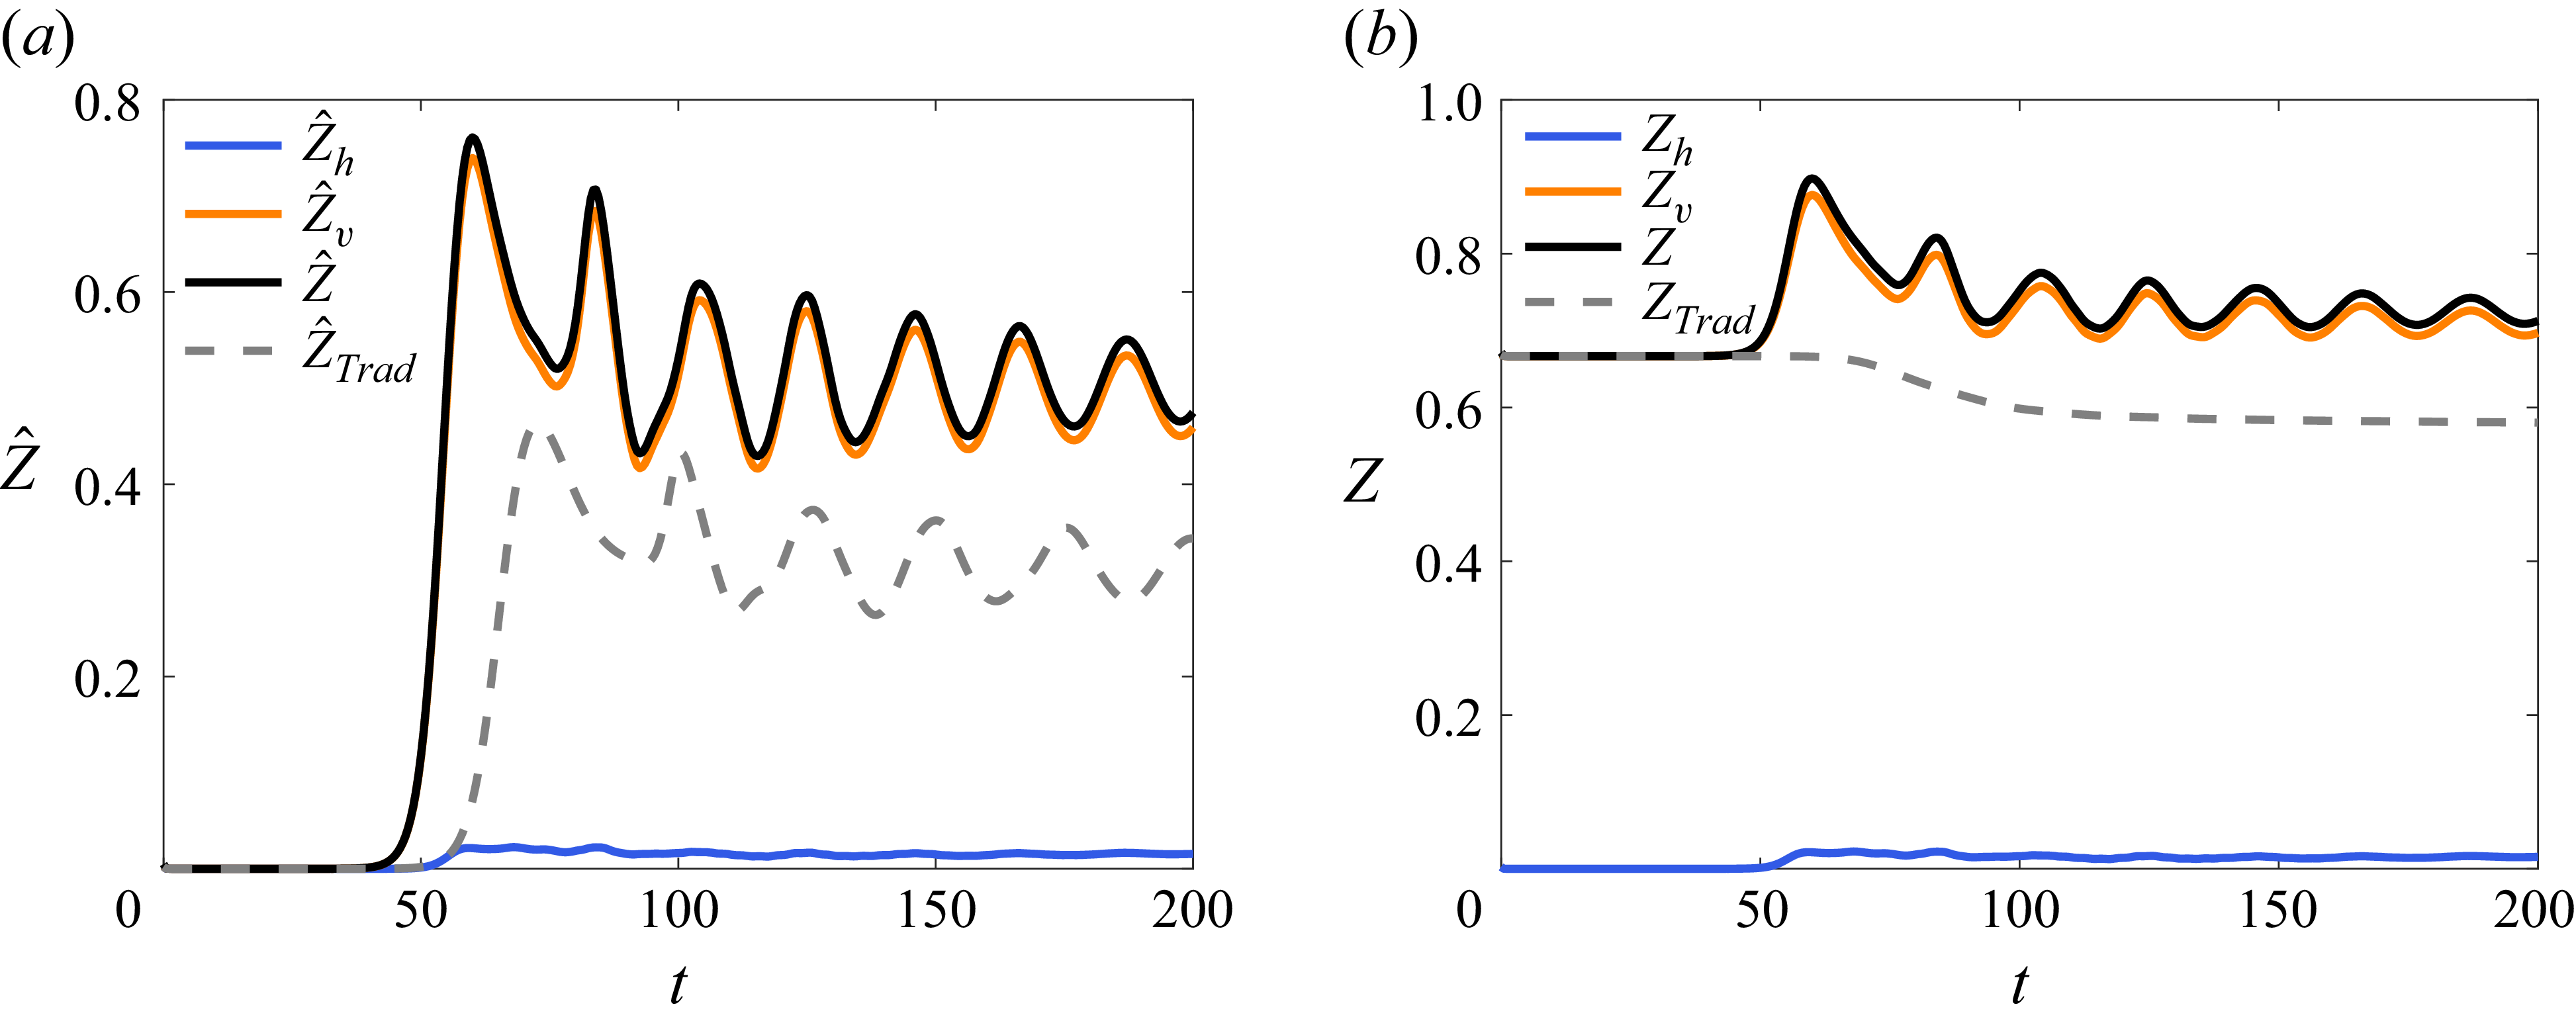
(a) Evolution of the horizontal (blue line), vertical (orange line) and total (black line) enstrophy of the perturbations for
 $(N, \tilde {f})=(2, 1.5)$
. The grey dashed line corresponds to the total enstrophy of the perturbation in the traditional limit. Panel (b) is the same as (a) but for the total enstrophies
 $Z_{h}$
,
 $Z_{v}$
and
 $Z$
.

(a) Evolution of the horizontal (blue line), vertical (orange line) and total (black line) enstrophy of the perturbations for
 $(N, \tilde {f})=(1, 0.5)$
. Panel (b) is the same as (a) but for the total enstrophies
 $Z_{h}$
,
 $Z_{v}$
and
 $Z$
.

Figure 11 shows the evolutions of
 $\hat {Z}_{h}$
,
 $\hat {Z}_{v}$
,
 $\hat {Z}$
and of the total enstrophy for the simulation in the traditional limit (figure 4) and for the traditional-like simulation for
 $(N, \tilde {f})=(2, 1.5)$
(figure 5). In the traditional limit, only the total enstrophy is shown (dashed line) since the horizontal enstrophy remains zero. As seen in figure 11(a), the enstrophy of the perturbations for
 $\tilde {f}=0$
rises exponentially and then tends to saturate but with some oscillations superimposed as observed for the kinetic energy. The total enstrophy
 $Z$
(dashed line in figure 11
b) decreases monotonically as expected since the flow is purely two-dimensional for
 $\tilde {f}=0$
. The total decay of
 $Z$
is, however, relatively small (note the vertical scale). We remind that the dissipation of the base flow is not taken into account.
For the traditional-like simulation (solid lines in figure 11), the horizontal enstrophy remains always small since the vertical velocity is small. The evolution of
 $\hat {Z}$
is very similar to the one in the traditional limit but with a higher value as the maximum and minimum vertical vorticity are no longer 0 and −1 but are outside this range. For this reason, the total enstrophy
 $Z$
increases somewhat before oscillating (figure 11
b). This is possible since the vorticity is no longer conserved in the inviscid limit for non-zero
 $\tilde {f}$
.
Figure 12 shows the evolution of the enstrophy for the mixed case for
 $(N, \tilde {f})=(1, 0.5)$
(figure 6). The vertical enstrophy of the perturbation
 $\hat {Z}_{v}$
saturates at approximately the same level as in figure 11. When
 $\hat {Z}_{v}$
begins to saturate, the horizontal enstrophy of the perturbation
 $\hat {Z}_{h}$
starts to grow and becomes dominant afterwards. Thereby, the total enstrophy (figure 12
b) increases significantly instead of decaying. The total vertical enstrophy remains approximately constant. It is worth pointing out that the increase of the enstrophies of the perturbation occurs during the linear and nonlinear stages of the primary Kelvin–Helmholtz instability while the secondary instabilities develop only later
 $t\geqslant 120$
(small wiggles are then visible on the curves in figure 12).
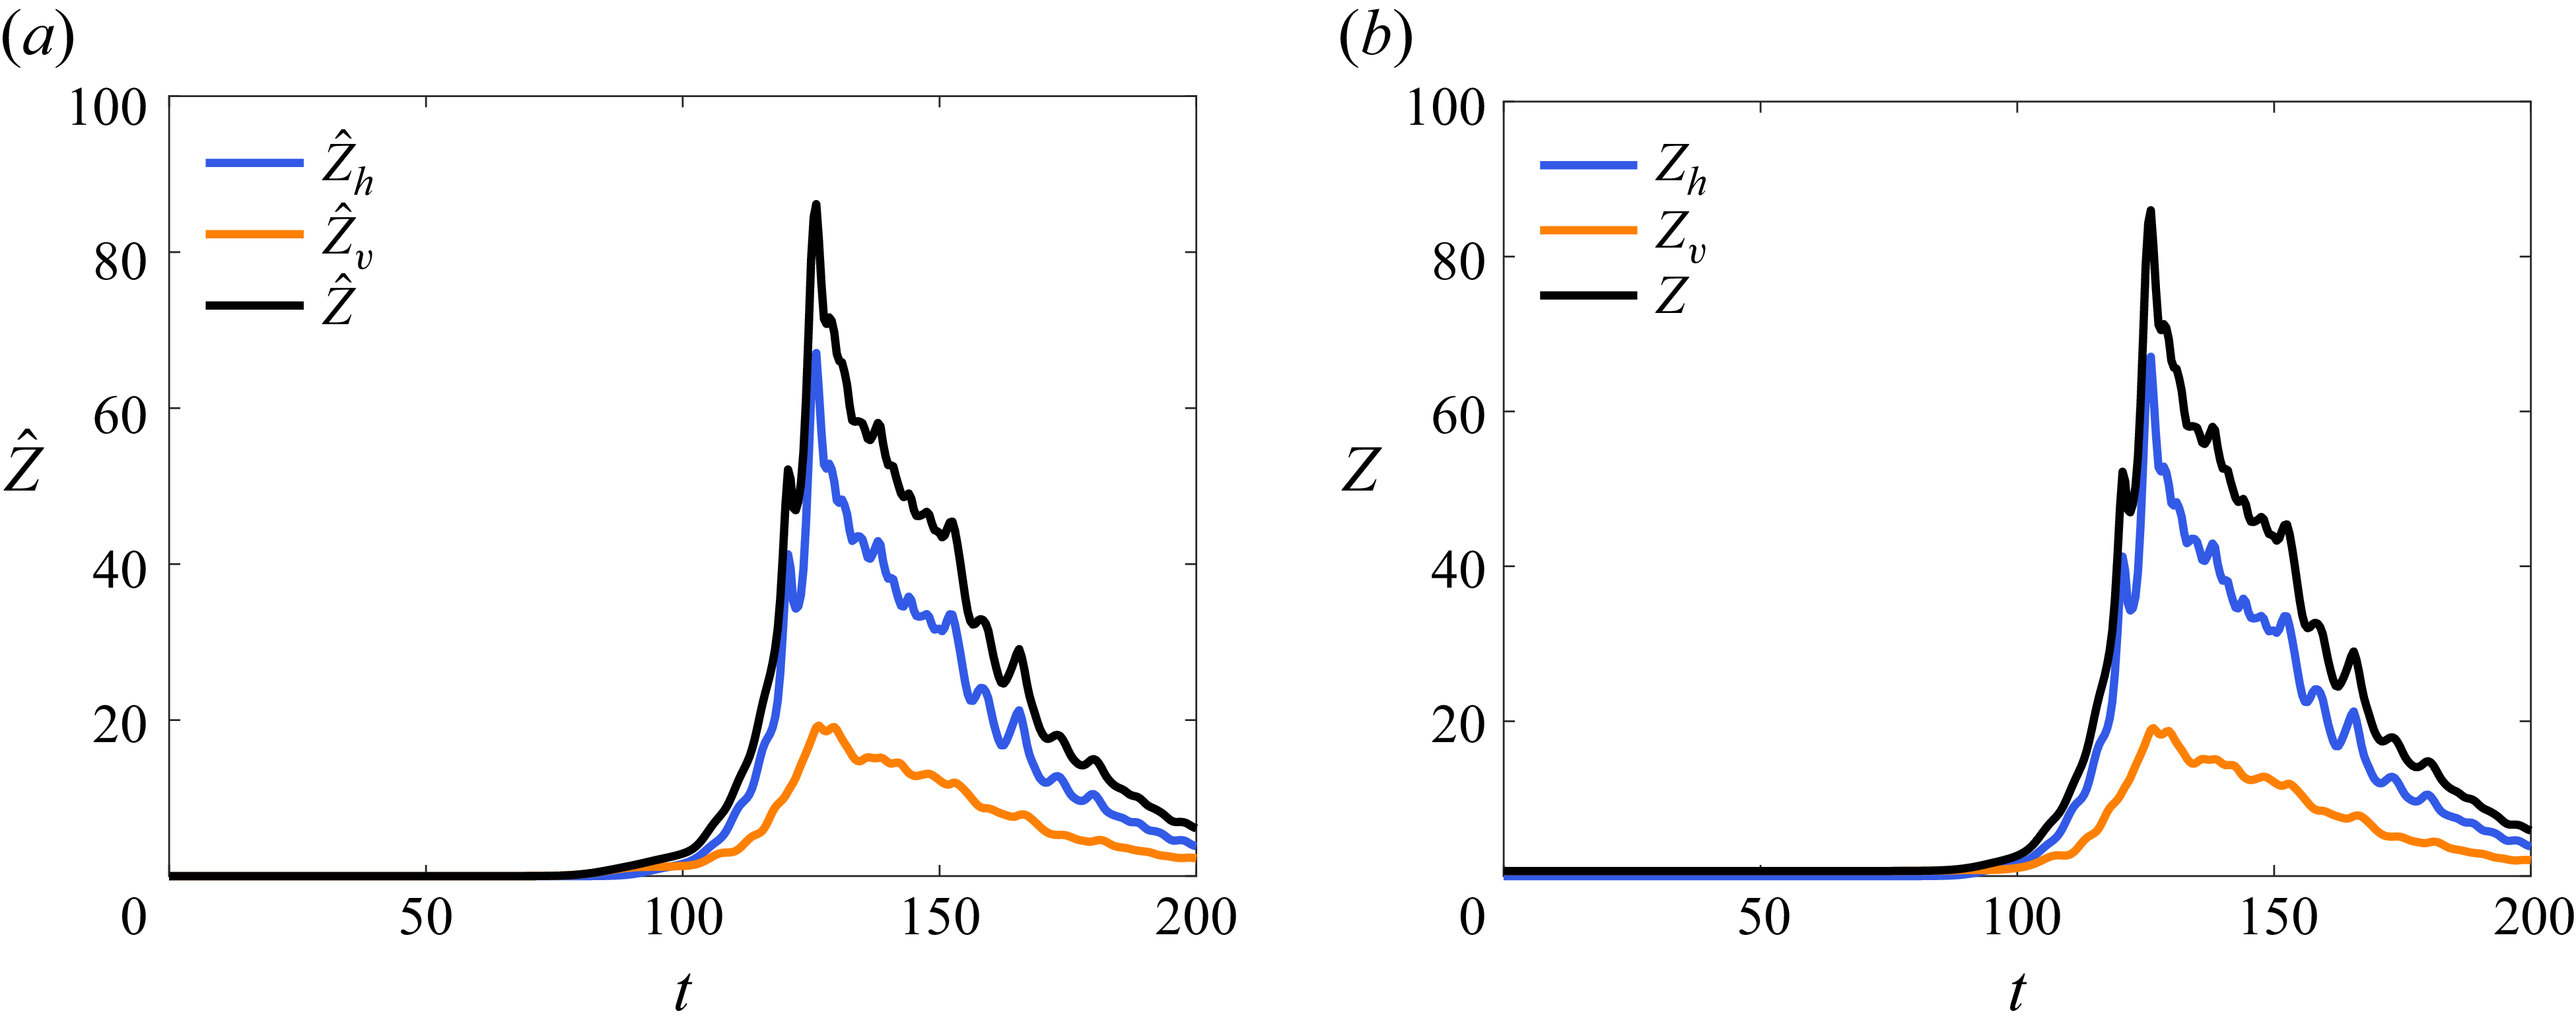
For the non-traditional case for
 $(N, \tilde {f})=(0.5, 0.5)$
(figure 13), there is a dramatic increase of the horizontal enstrophy of the perturbation up to
 $\hat {Z}_{h}\sim 70$
and then it eventually decays. The vertical enstrophy
 $\hat {Z}_{v}$
increases also but in a less pronounced manner. It is interesting to note that both components of enstrophy begin to increase when the nonlinear regime sets in at
 $t\sim 90$
as in figure 12, but the main increase actually occurs later at
 $t\sim 120$
when the secondary instabilities develop and the flow becomes turbulent. A high peak of enstrophy has been also observed by Staquet (Reference Staquet1995) when secondary instabilities develop in a stratified vertically sheared flow. The influence of the Reynolds number and Schmidt number on the level of this enstrophy maximum will be investigated in a future paper.
Same as figure 12 but for
 $(N, \tilde {f})=(0.5, 0.5)$
.

To interpret the evolution of the enstrophy, we consider the equation for the vertical vorticity (3.1) and the one for the horizontal vorticity of the perturbations
 $\boldsymbol{\hat {\omega }_{h}}$
, which can be derived from (2.6):
 \begin{align} \displaystyle \partial _t \boldsymbol{\hat {\omega }_{h}}+U\partial _x\boldsymbol{\hat {\omega }_{h}}+(\boldsymbol{\hat {u}}\boldsymbol{\cdot }\boldsymbol{\nabla })\boldsymbol{\hat {\omega }_{h}}=\tilde {f}\partial _{y}\boldsymbol{\hat {u}}+(\boldsymbol{\hat {\omega }_{h}}\boldsymbol{\cdot }\boldsymbol{\nabla })(U\boldsymbol{e_{x}}+\boldsymbol{\hat {u}})+\boldsymbol{\nabla }\times (\hat {b}\boldsymbol{e_{z}})+\frac {1}{\textit{Re}}{\nabla ^2}\boldsymbol{\hat {\omega }_{h}}. \end{align}
It is worth noticing that the right-hand side of (3.6) contains the following effects: first, the tilting and stretching of the horizontal background vorticity
 $\tilde {f}$
; second, the tilting and stretching of the horizontal vorticity of the perturbation by the base flow and the velocity of the perturbations; third, the baroclinic torque and, finally, the viscous effects.
Equations (3.1) and (3.6) can be combined to give an equation for the evolution of the enstrophy of the perturbation,
 \begin{align} \displaystyle \frac {D\hat {Z}}{Dt}&=\mathcal{S}+\mathcal{I}+\mathcal{B}+\mathcal{D},\,\,\,\,\quad\quad\quad\quad\quad\quad\quad\quad\quad\quad\quad\quad\quad\quad\quad\quad\quad\quad\quad\quad \\[-9pt] \nonumber \end{align}
where
 \begin{align} \displaystyle \mathcal{S}&=\frac {1}{L_{x}}\int _{0}^{L_{x}}\int _{0}^{L_{y}}\boldsymbol{\hat {\omega }}\boldsymbol{\cdot }\left [(\boldsymbol{\hat {\omega }}+\tilde {f}\boldsymbol{e_{y}})\boldsymbol{\cdot }\boldsymbol{\nabla }\boldsymbol{\hat {u}}\right ]\,{\rm d}y{\rm d}x, \\[-9pt] \nonumber \end{align}
 \begin{align} \displaystyle \mathcal{I}&=\frac {1}{L_{x}}\int _{0}^{L_{x}}\int _{0}^{L_{y}}\boldsymbol{\hat {\omega }}\boldsymbol{\cdot }\left [(\boldsymbol{\hat {\omega }}\boldsymbol{\cdot }\boldsymbol{\nabla })U\boldsymbol{e_{x}}+(\boldsymbol{\omega _{b}}\boldsymbol{\cdot }\boldsymbol{\nabla })\boldsymbol{\hat {u}}-(\boldsymbol{\hat {u}}\boldsymbol{\cdot }\boldsymbol{\nabla })\boldsymbol{\omega _{b}}\right ]\,{\rm d}y{\rm d}x, \\[-9pt] \nonumber \end{align}
 \begin{align} \displaystyle \mathcal{B}&=\frac {1}{L_{x}}\int _{0}^{L_{x}}\int _{0}^{L_{y}}\boldsymbol{\hat {\omega }}\boldsymbol{\cdot }\boldsymbol{\nabla }\times (\hat {b}\boldsymbol{e_{z}})\,{\rm d}y{\rm d}x, \\[-9pt] \nonumber \end{align}
 \begin{align} \displaystyle \mathcal{D}&=-\frac {1}{L_{x}}\frac {1}{\textit{Re}}\int _{0}^{L_{x}}\int _{0}^{L_{y}}(\boldsymbol{\nabla }\boldsymbol{\hat {\omega }})^{2}\,{\rm d}y{\rm d}x, \\[9pt] \nonumber \end{align}
are, respectively, stretching/tilting effect, interaction with the base flow, baroclinic and viscous effects. Here
 $\boldsymbol{\omega _{b}}=-\partial _{y}U\,\boldsymbol{e_{z}}$
is the vorticity of the base flow.
Different terms of the enstrophy budget (3.7) for (a)
 $(N, \tilde {f})=(5, 0)$
, (b)
 $(N, \tilde {f})=(2, 1.5)$
, (c)
 $(N, \tilde {f})=(1, 0.5)$
, (d)
 $(N, \tilde {f})=(0.5, 0.5)$
.

Figure 14(a) shows these four terms in the traditional case. Only the interaction with the base flow and the dissipation contribute to the enstrophy budget as expected. In the traditional-like case for
 $(N, \tilde {f})=(2, 1.5)$
, a similar evolution is observed (figure 14
b) except that the baroclinic term is of the same order as the interaction with the base flow. The stretching/tilting term is no longer exactly zero but remains small. For the mixed case for
 $(N, \tilde {f})=(1, 0.5)$
(figure 14
c), the interaction, baroclinic and dissipation terms are still dominant but the stretching/tilting is almost of the same order. It can be noticed also that the dissipation term is one order of magnitude larger than in the previous cases. Finally, for the non-traditional case for
 $(N, \tilde {f})=(0.5, 0.5)$
, figure 14(d) shows that the considerable increase of
 $\hat {Z}$
(figure 13
a) is due to the vortex stretching/tilting that becomes, by far, the dominant source of enstrophy when secondary instabilities develop at
 $t\geqslant 120$
. Simultaneously, the dissipation (in absolute value) grows to the same level: it is the dissipative anomaly linked to the development of turbulence. These pronounced peaks are indeed observed when secondary instabilities arise and lead to a transition to turbulence. Such enstrophy evolution is characteristic of a three-dimensional flow even if the present configuration is only two-dimensional. This is because the flow has three velocity components, enabling the stretching and tilting of vorticity. In contrast, the interaction with the base flow and the baroclinic terms are much smaller.
3.4. Origin of secondary instabilities
In this section, we analyse the origin of secondary instabilities observed in the `mixed’ simulation for
 $(N,\tilde {f})=(1, 0.5)$
and in the `non-traditional’ simulation for
 $(N,\tilde {f})=(0.5, 0.5)$
(see figure 3). In the first case, the secondary instabilities develop in the periphery of the vortex core but remain localised (figures 6
c and 6
d). In the second case
 $(N,\tilde {f})=(0.5, 0.5)$
, the secondary instabilities arise in the same region but quickly contaminate the whole flow and lead to a transition to small-scale turbulence (figure 7
c,d).
In order to interpret the origin of these instabilities, we will check whether or not the Fjørtoft necessary condition for instability is satisfied (Fjørtoft Reference Fjørtoft1950). It is a more stringent criterion than the inflection point condition of Rayleigh. For an inviscid parallel shear flow, it reads
 \begin{align} \partial _{yy}u(y)(u(y)-u(y_{i}))\lt 0, \end{align}
where
 $u(y_{i})$
is the velocity at the inflection point
 $y_{i}$
. There exists also a version of this criterion for an inviscid axisymmetric vortex (Fjørtoft Reference Fjørtoft1950; Smyth & Carpenter Reference Smyth and Carpenter2019),
 \begin{align} \partial _{r}\xi (r)(\varOmega (r)-\varOmega (r_{i}))\lt 0, \end{align}
where
 $(r, \theta , z)$
are cylindrical coordinates in the radial, azimuthal and vertical directions, respectively. Here
 $\xi$
is the axial vorticity,
 $\varOmega$
the angular velocity and
 $r_{i}$
the inflection point where
 $\partial _{r}\xi (r_{i})=0$
.
As shown by Smyth & Carpenter (Reference Smyth and Carpenter2019), the Fjørtoft criterion in Cartesian coordinates is equivalent to require that the inflection point is a maximum of shear:
 \begin{align} S=\sqrt {(\partial _{y}u)^{2}+(\partial _{x}v)^{2}}. \end{align}
Although these criteria are strictly valid for an axisymmetric vortex and for a parallel shear flow, we will apply them to the flows observed prior to the secondary instabilities onset in the ‘mixed case’ and in the ‘non-traditional’ case, respectively. Indeed, as seen in figure 15(a), the vortex in the mixed case is approximately axisymmetric whereas, in the non-traditional case (figure 15
b), the vorticity filaments are strongly elongated and can be reasonably approximated as locally parallel. Furthermore, one can remark that these criteria apply only to traditional flows, i.e. purely two-dimensional flows, which is not the case here. Nonetheless, the typical scale
 $\ell$
of the vorticity filaments is much smaller than the initial scale
 $L_{0}$
of the shear flow:
 $\ell \ll L_{0}$
. This implies that the local non-dimensional Brunt–Väisälä frequency
 $N_{\ell }$
and non-traditional Coriolis parameter
 $\tilde {f}_{\ell }$
are much smaller:
 $N_{\ell }=N_{0}\ell /U_{0}=N\ell /L_{0}\ll 1$
and
 $\tilde {f}_{\ell }=\tilde {f}_{0}\ell /U_{0}=\tilde {f}\ell /L_{0}\ll 1$
. Thus, we have
 $N_{\ell }\simeq 0$
and
 $\tilde {f}_{\ell }\simeq 0$
and it is legitimate to assume that the local dynamics is approximately two-dimensional.
Total vertical vorticity
 $\xi$
at (a)
 $t=112$
for
 $(N,\tilde {f})=(1, 0.5)$
and at (b)
 $t=117.5$
for
 $(N,\tilde {f})=(0.5, 0.5)$
. The black solid lines indicate the lines along which Fjørtoft criteria are computed. (c,d) Shear
 $S$
corresponding to (a) and (b). (e) Vorticity (blue) and cylindrical Fjørtoft criterion (3.9) (orange), computed along the black line in (a). The centre of the vortex corresponds to
 $r=0$
. (f) Vorticity (blue) and cartesian Fjørtoft criterion (3.8) (orange) along the black line in (b). The black dotted vertical lines in (e) and (f) indicate the location of
 $r_i$
and
 $y_i$
, respectively.

In the mixed case
 $(N,\tilde {f})=(1, 0.5)$
, figure 15(c) shows that
 $S$
is maximum in the region where secondary instabilities will develop a few time units later. In addition, the criterion (3.9) is computed along the solid black line in figure 15(a) and the results are presented in figure 15(e). It is indeed satisfied around the inflection point which is at
 $r=1.96$
. Furthermore, the associated vorticity profile exhibits also a minimum at
 $r=2.2$
, i.e. there is a second inflection point. Therefore, the configuration is similar to that of a jet, with contiguous maximum and minimum of vorticity. The instability (figure 6
c) indeed resembles the most unstable mode of jet instability, i.e. the sinuous mode.
For the non-traditional case
 $(N,\tilde {f})=(0.5, 0.5)$
, the maximum of shear (figure 15
d) is also located in the region where the secondary instabilities will emerge, but it is much more intense than in the previous case. Figure 15(f) shows the cartesian Fjørtoft criterion (3.8) along the straight black line drawn in figure 15(b) across the corresponding vorticity filament. In this case, there is a single inflection point located at
 $y_{i}=34.52$
(figure 15
f) like for a shear layer. The cartesian Fjørtoft criterion for instability (3.8) is satisfied in its neighbourhood.
Therefore, in both mixed and non-traditional simulations, the secondary instabilities can be interpreted as new shear instabilities developing on the vertical vorticity anomalies generated by non-traditional effects.
3.5. Analysis for strong stratification
In this section, we will show that the governing equation (2.6) can be greatly simplified when the stratification is strong. This will enable us to derive scaling laws for the kinetic and potential energies in terms of
 $N$
and
 $\tilde {f}$
when
 $N\gg 1$
. We will consider the inviscid limit for simplicity but the following analysis is expected to be valid as long as the Reynolds number is large.
By taking the derivative
 $D/Dt=\partial _{t}+U\partial _{x}+\boldsymbol{\hat {u}}\boldsymbol{\cdot }\boldsymbol{\nabla }$
of (2.6c
), by using (2.6d
) and (2.6a
), the buoyancy can be eliminated, giving
 \begin{align} \frac {D^2\hat {w}}{Dt^2}+ \big(\tilde {f}^2+N^2 \big)\hat {w}=-\tilde {f}\partial _x\hat {p}. \end{align}
Even if the linear stability analysis shows that the maximum growth rate
 $\sigma _{{m}}$
and most amplified wavenumber
 $k_{x{m}}$
vary somewhat with
 $N$
and
 $\tilde {f}$
, we will assume a priori here that
 $D/Dt\sim O(\sigma _{{m}})\sim O(k_{x{m}})\sim O(1)$
. Therefore, when
 $N^{2}+\tilde {f}^{2}\gg 1$
, (3.11) simplifies to
 \begin{align} \hat {w}\simeq \frac {-1}{\tilde {f}\left (1+\left (\frac {N}{\tilde {f}}\right )^2\right )}\partial _x\hat {p}. \end{align}
The approximation (3.12) seems to be valid as soon as
 $N^{2}+\tilde {f}^{2}\gg 1$
, i.e. if either
 $N\gg 1$
or/and
 $\tilde {f}\gg 1$
. However, we will see a posteriori that the final results are self-consistent with the approximation (3.12) only if
 $N\gg 1$
.
Inserting (3.12) in the horizontal momentum ((2.6a
), (2.6b
) and (2.6e
) leads to a closed system of equations for
 $(\hat {u}, \hat {v}, \hat {p})$
,
 \begin{align} \displaystyle \partial _t \hat {u}+U\partial _x\hat {u}+\hat {v}\partial _y U+\hat {u}\partial _{x}\hat {u}+\hat {v}\partial _{y}\hat {u}&=-\alpha \partial _x \hat {p}, \\[-9pt] \nonumber \end{align}
 \begin{align} \displaystyle \partial _t \hat {v}+U\partial _x\hat {v}+\hat {u}\partial _{x}\hat {v}+\hat {v}\partial _{y}\hat {v}&=-\partial _y \hat {p}, \\[-9pt] \nonumber \end{align}
 \begin{align} \partial _x \hat {u}+\partial _y \hat {v}&=0, \\[9pt] \nonumber \end{align}
which are very similar to the equations in the traditional limit except for the presence of the parameter
 $\alpha$
in (3.13a
):
 \begin{align} \alpha =\frac {N^{2}}{\tilde {f}^{2}+N^{2}}. \end{align}
This parameter is a measure of the non-traditional Coriolis parameter compared with the Brunt–Väisälä frequency: it is equal to unity in the traditional limit
 $\tilde {f}=0$
, and it decreases as
 $\tilde {f}/N$
increases. When
 $\tilde {f}$
is non-zero, (3.13) can be, however, transformed into the traditional equations by applying the following change of variables:
 \begin{align} \hat {u}=\hat {u}', \quad \hat {v}=\frac {1}{\sqrt {\alpha }}\hat {v}', \quad \hat {p}=\frac {1}{\alpha }\hat {p}', \\[-28pt] \nonumber \end{align}
 \begin{align} \partial _{x}=\frac {1}{\sqrt {\alpha }}\partial _{x}', \quad \partial _{y}=\partial _{y}', \quad \partial _{t}=\frac {1}{\sqrt {\alpha }}\partial _{t}'. \\[-2pt] \nonumber \end{align}
Indeed, the equations for the primed variables are strictly two-dimensional:
 \begin{align} \displaystyle \partial _t' \hat {u}'+U\partial _x'\hat {u}'+\hat {v}'\partial _y' U+\hat {u}'\partial _{x}'\hat {u}'+\hat {v}'\partial _{y}'\hat {u}'&=-\partial _x' \hat {p}', \\[-9pt] \nonumber \end{align}
 \begin{align} \displaystyle \partial _t' \hat {v}'+U\partial _x'\hat {v}'+\hat {u}'\partial _{x}'\hat {v}'+\hat {v}'\partial _{y}'\hat {v}'&=-\partial _y' \hat {p}', \\[-9pt] \nonumber \end{align}
 \begin{align} \partial _x'\hat {u}'+\partial _y'\hat {v}'&=0. \\[9pt] \nonumber \end{align}
Before discussing some properties associated with (3.17) and (3.15)–(3.16), we first check a posteriori whether or not the assumption
 $N^{2}+\tilde {f}^{2}\gg d^{2}/{\rm d}t^{2}$
used to derive (3.17) is satisfied. The change of variable (3.16) implies that
 $D/Dt\sim \partial _{t}\sim \partial _{x}=O(1/\sqrt {\alpha })$
since
 $\partial _{t}'\sim O(1)$
and
 $\partial _{x}'\sim O(1)$
. Hence, we should have
 \begin{align} N^{2}+\tilde {f}^{2}\gg 1/\alpha . \end{align}
From (3.14), we see that this is the case only if
 $N^{2}\gg 1$
and not if
 $\tilde {f}\gg 1$
with
 $N\leqslant O(1)$
contrary to what (3.11) suggests. Hence, the reduced system (3.13) is expected to be valid only if the stratification is strong, i.e.
 $N\gg 1$
.
The transformation (3.15)–(3.16) has several interesting properties. First, concerning the linear stability of the base flow (§ 2.3), it implies that the dispersion relation for any
 $\tilde {f}$
and
 $N\gg 1$
is
 $\sigma =\mathcal{F}(k_{x}\sqrt {\alpha })/\sqrt {\alpha }$
, where
 $\sigma =\mathcal{F}(k_{x})$
is the dispersion relation for
 $\tilde {f}=0$
. Figure 2(b) indeed shows that the rescaled growth rate
 $\sigma \sqrt {\alpha }$
represented as a function of
 $k_{x}\sqrt {\alpha }$
collapses towards the growth rate curve for
 $\tilde {f}=0$
when
 $N\gg 1$
and
 $\tilde {f}$
is non-zero.
Another important property of (3.17) is that the total vertical vorticity
 $\xi '=\partial _{x}'\hat {v}'-\partial _{y}'\hat {u}'-\partial _{y}'U$
is conserved following the motion since these equations are purely two-dimensional. When rewritten in terms of the unprimed variables, the total vertical vorticity becomes
 $\xi '=\alpha \partial _{x}\hat {v}-\partial _{y}\hat {u}-\partial _{y}U$
and its governing equation remains
 \begin{align} \partial _{t}\xi '+U\partial _{x}\xi '+\boldsymbol{\hat {u}}\boldsymbol{\cdot }\boldsymbol{\nabla }\xi '=0. \end{align}
It can be easily shown that (3.19) derives from the conservation of potential vorticity
 $\varPi =(\boldsymbol{\omega }+\tilde {f}\boldsymbol{e_{y}})\boldsymbol{\cdot }(N^{2}\boldsymbol{e_{z}}+\boldsymbol{\nabla }b)$
.
In the following sections, we further show that the levels of saturation of the different energy components for any
 $\tilde {f}$
and sufficiently large
 $N$
can be deduced from those for
 $\tilde {f}=0$
thanks to the transformation (3.15)–(3.16).
3.5.1. Scaling for the horizontal kinetic energy of the perturbation
The transformation (3.15)–(3.16) implies that the horizontal kinetic energy can be written as
 \begin{align} \hat {K}_h=\frac {1}{2L_{x}}\int _0^{L_x}\int _0^{L_y} \big(\hat {u}^2+\hat {v}^{2} \big)\,{\rm d}y {\rm d}x=\frac {1}{2L_{x}'}\int _0^{L_x'}\int _0^{L_y'}\left (\hat {u}'^2+\frac {\hat {v}'^2}{\alpha }\right )\,{\rm d}y' {\rm d}x', \end{align}
where
 $L_{x}'=L_{x}\sqrt {\alpha }$
and
 $L_{y}'=L_{y}$
.
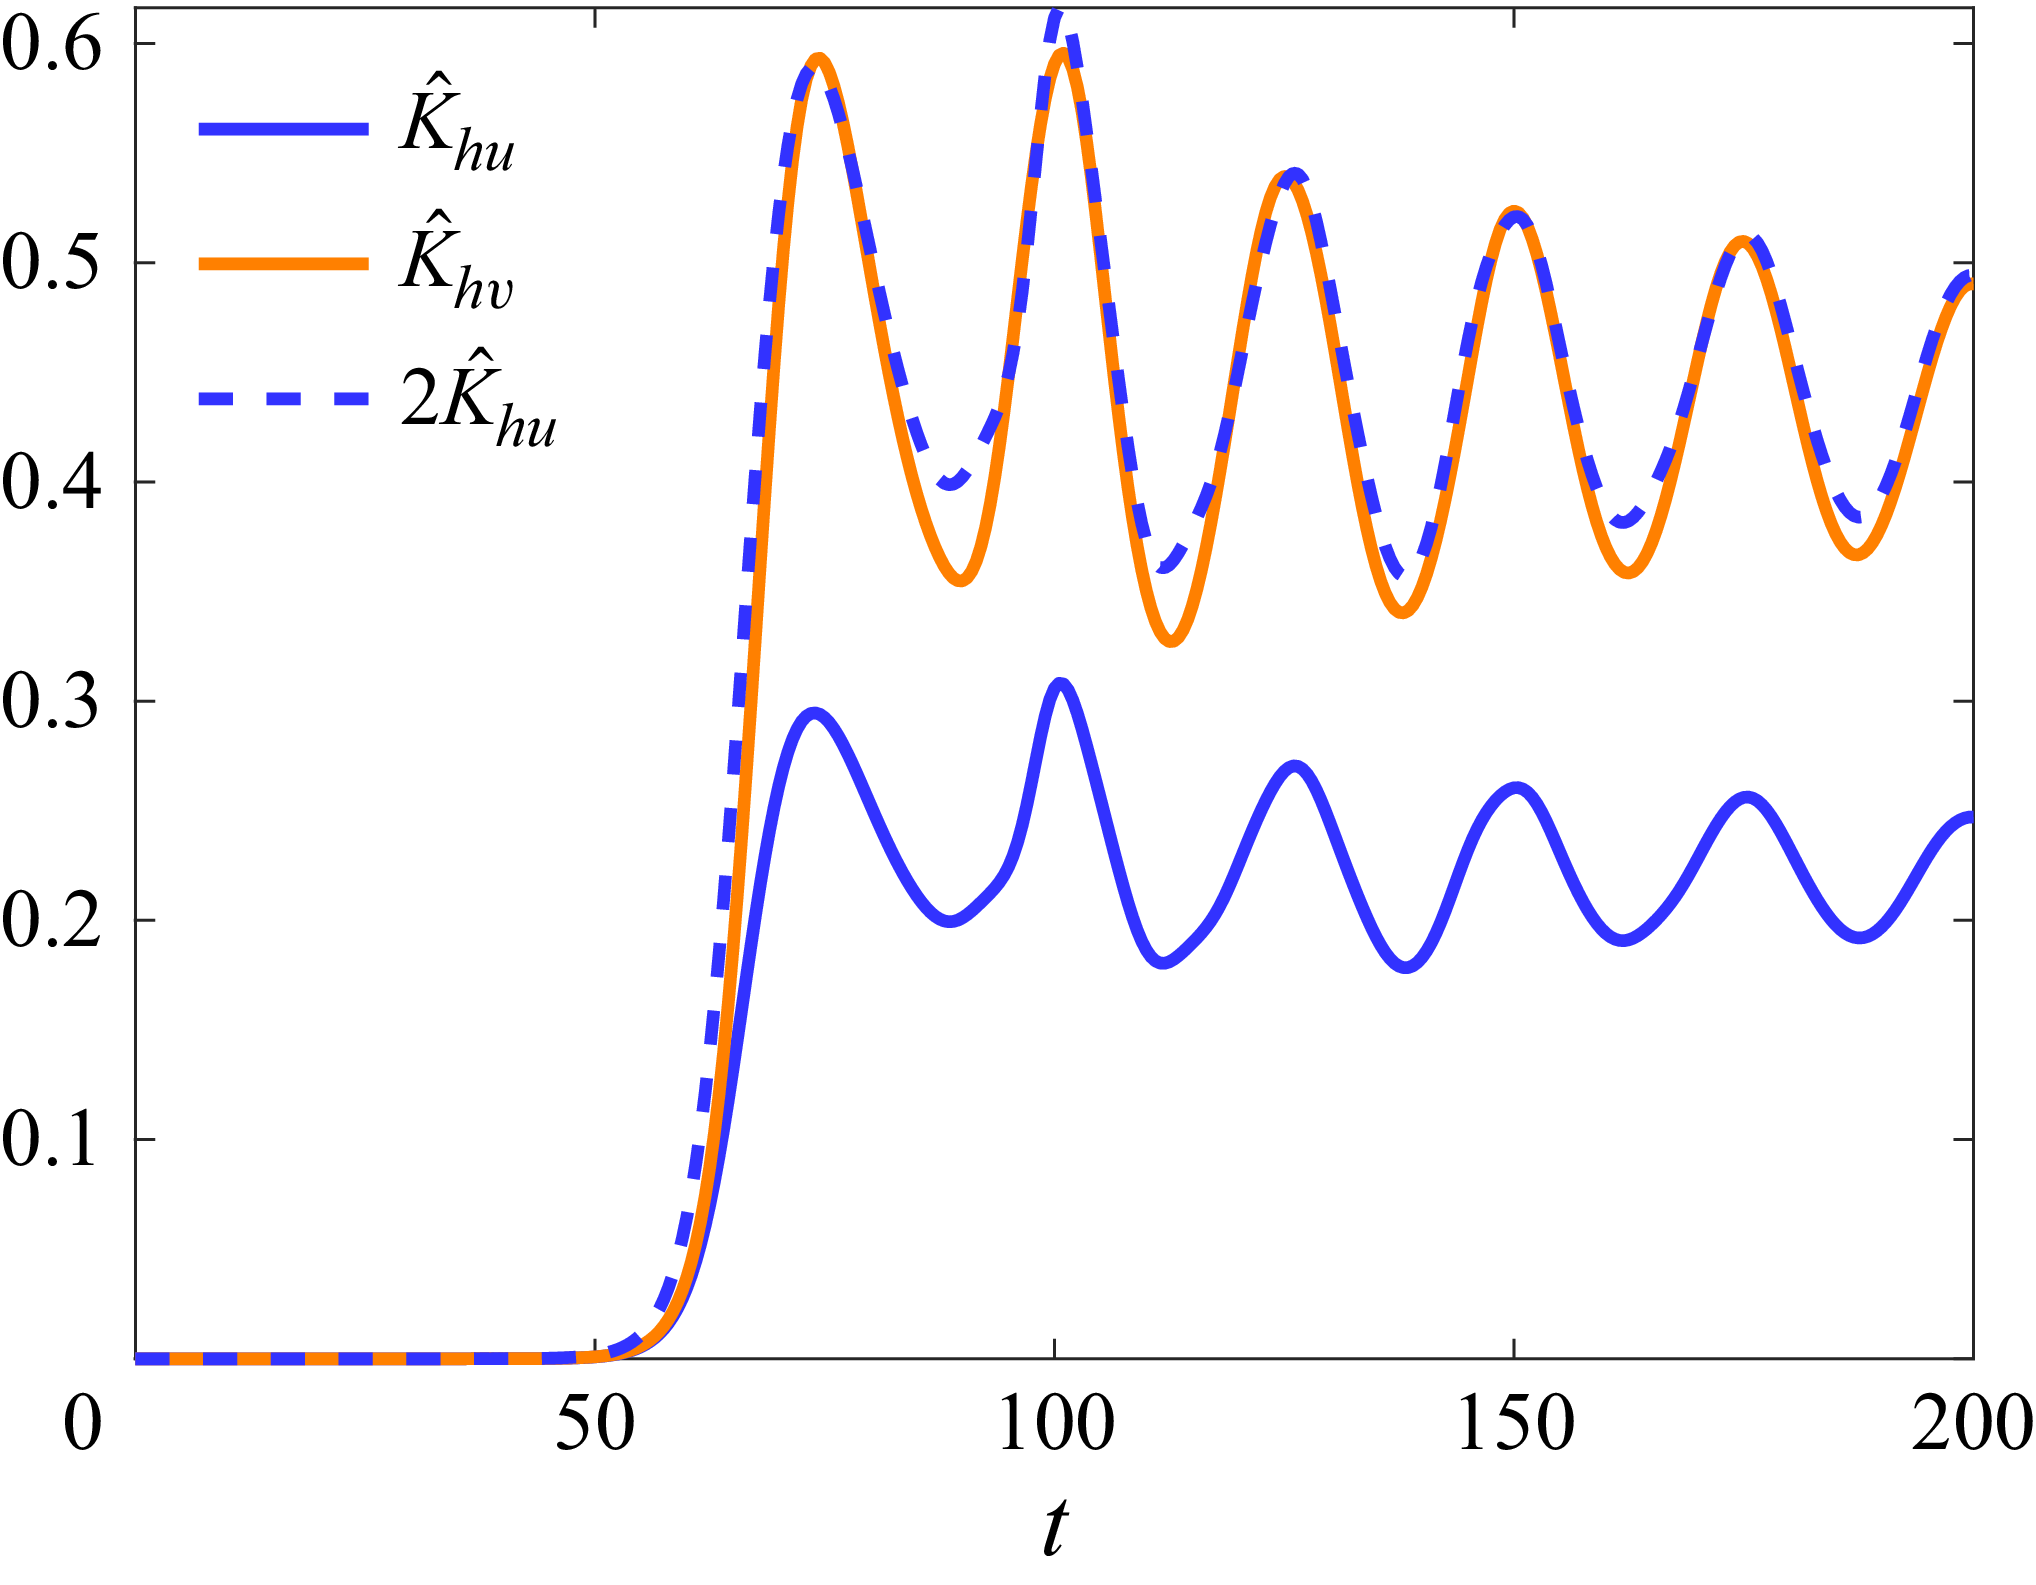
The numerical simulations show that, at saturation, we have the empiric approximate relation (see figure 16),
 \begin{align} \int _0^{L_x'}\int _0^{L_y'}\hat {v}'^2\,{\rm d}y' {\rm d}x' \simeq 2 \int _0^{L_x'}\int _0^{L_y'}\hat {u}'^2\,{\rm d}y' {\rm d}x' . \end{align}
Evolution of
 $\displaystyle \hat {K}_{hu}= 1/(2L_x)\int _0^{L_x}\int _0^{L_y}\hat {u}^2\,{\rm d}y {\rm d}x$
and
 $\displaystyle \hat {K}_{hv}= 1/(2L_x)\int _0^{L_x}\int _0^{L_y}\hat {v}^2\,{\rm d}y {\rm d}x$
for
 $\tilde {f}=0$
,
 $ \textit{Re}=2000$
and
 $ \textit{Sc}=1$
. The dashed line, which represents
 $2\hat {K}_{hu}$
shows that
 $\hat {K}_{hv}\simeq 2\hat {K}_{hu}$
as assumed in (3.21).

Therefore, the horizontal kinetic energy for any
 $\tilde {f}$
and
 $N\gg 1$
is approximately given by
 \begin{align} \hat {K}_h\simeq \frac {1}{3}\left (3+2\left (\frac {\tilde {f}}{N}\right )^{2}\right )\hat {K}_h', \end{align}
where
 $\hat {K}_h'$
is the horizontal kinetic energy for
 $\tilde {f}=0$
. Thus, the horizontal kinetic energy of the perturbations depends only on the ratio
 $\tilde {f}/N$
. It increases with
 $\tilde {f}$
and decreases with
 $N$
in agreement with the trends observed in figure 10. The relation (3.22) is further tested in figure 17. Figure 17(a) displays the evolutions of
 $\hat {K}_h$
for various sets of parameters
 $(N, \tilde {f})$
such that
 $N\geqslant 1$
. Figure 17(b) shows
 $\hat {K}_h$
rescaled by
 $(1+2/3(\tilde {f}/N)^{2})$
for the same parameters. All the horizontal kinetic energies in the saturated regime then collapse approximately around the same mean value. This value is indicated in figure 17(b) by a horizontal black dotted line corresponding to the mean horizontal kinetic energy at saturation of the simulation for
 $(N,\tilde {f})=(5, 0.5)$
which is closest to the traditional limit. We can notice that even the curve for
 $(N, \tilde {f})=(1, 1)$
collapses relatively well on the others, even if
 $N$
is not much larger than unity.
(a) Horizontal kinetic energy of the perturbations for different parameters
 $N$
and
 $\tilde {f}$
. (b) Horizontal kinetic energy of the perturbations rescaled by
 $A=(1+(2/3)(\tilde {f}/N)^{2})$
for the same parameters as in (a). The black dotted line in (b) shows the mean value towards which the rescaled curves collapse.

3.5.2. Scaling for the vertical kinetic energy
Using (3.12) and the transformation (3.15)–(3.16), the vertical velocity can be written as
 \begin{align} \hat {w}\simeq -\frac {\tilde {f}}{N^{2}+\tilde {f}^{2}}\frac {\partial _{x}'\hat {p}'}{\alpha ^{3/2}}. \end{align}
Hence, the vertical kinetic energy can be expressed as
 \begin{align} \hat {K}_v=\frac {1}{2L_{x}}\int _0^{L_x}\int _0^{L_y}\hat {w}^2\,{\rm d}y {\rm d}x\simeq \left (\frac {\tilde {f}}{N}\right )^{2}\left (\frac {N^{2}+\tilde {f}^{2}}{N^{4}}\right )\left (\frac {1}{2L_{x}'}\int _0^{L_x'}\int _0^{L_y'} \big(\partial _{x}'\hat {p}' \big)^2\,{\rm d}y' {\rm d}x' \! \right )\!. \end{align}
(a) Vertical kinetic energy of the perturbations for different parameters
 $N$
and
 $\tilde {f}$
. (b) Vertical kinetic energy of the perturbations rescaled by
 $ A = (\tilde {f}/N)^{2}(\tilde {f}^{2}+N^{2})/N^{4}$
for the same parameters as in (a). The black dotted line in (b) shows the mean value towards which the rescaled curves collapse.

In other words,
 $\hat {K}_v$
should be proportional to the factor
 $A=(\tilde {f}/N)^{2}(1+(\tilde {f}/N)^{2})/N^{2}$
. As seen in figure 18(a), the vertical kinetic energy saturates at very different levels when
 $\tilde {f}$
and
 $N$
are varied (keeping
 $N\geqslant 1$
) but when rescaled by
 $A$
(figure 18
b), all the curves collapse around the same mean level of saturation (shown by a black dotted line). The rescaled vertical kinetic energy for
 $(N, \tilde {f})=(1, 1)$
is 30 % away from the others since the assumption
 $N\gg 1$
is less well verified than for the other sets of parameters.
3.5.3. Scaling for the potential energy
Similarly, the vertical momentum (2.6c ) in the inviscid limit, i.e.
 \begin{align} \frac {D\hat {w}}{Dt}-\tilde {f}\hat {u}=\hat {b} \end{align}
can be used to obtain an expression for
 $\hat {b}$
in terms of primed quantities, thanks to (3.15), (3.16) and (3.23):
 \begin{align} \hat {b}=-\tilde {f}\hat {u}'+\left (\frac {\tilde {f}}{N}\right )^{2}\left (1+\left (\frac {\tilde {f}}{N}\right )^{2}\right )\frac {D}{Dt'} \big(\partial _{x}'\hat {p}' \big). \end{align}
It shows that for strong stratification
 $N\gg 1$
, the buoyancy can be approximated by
 $\hat {b}=-\tilde {f}\hat {u}'$
, which corresponds to the quasihydrostatic balance, i.e. the hydrostatic equilibrium in presence of the non-traditional Coriolis force (Gerkema et al. Reference Gerkema, Zimmerman, Maas and van Haren2008) and in the absence of the vertical pressure gradient.
Therefore, the potential energy of the perturbations can be approximated by
 \begin{align} \hat {P}=\frac {1}{2L_{x}N^{2}}\int _0^{L_x}\int _0^{L_y}\hat {b}^2\,{\rm d}y {\rm d}x\simeq \left (\frac {\tilde {f}}{N}\right )^{2}\frac {1}{2L_{x}'}\int _0^{L_x'}\int _0^{L_y'}\hat {u}'^{2}\,{\rm d}y' {\rm d}x'. \end{align}
(a) Potential energy of the perturbations for different parameters
 $N$
and
 $\tilde {f}$
. (b) Potential energy of the perturbations rescaled by
 $(\tilde {f}/N)^{2}$
for the same parameters as in (a). The black dotted line in (b) shows the mean value towards which the rescaled curves collapse.

Figures 19(a) and 19(b) show the bare potential energy and the potential energy rescaled by
 $(\tilde {f}/N)^2$
respectively, for the same values of
 $\tilde {f}$
and stratification as in figures 17 and 18. While the levels of saturation of the potential energy are widely spread in figure 19(a), they gather approximately around the same mean value when rescaled (black dotted line on figure 19
b). However, the rescaling is less satisfactory for
 $(N, \tilde {f})=(1, 1)$
because the assumption of a strong stratification is not well satisfied and because the relative amplitude of the neglected term in the quasihydrostatic balance is proportional to
 $(1/N^{2})(1+(\tilde {f}/N)^{2})$
, i.e. unity, as seen in (3.26).
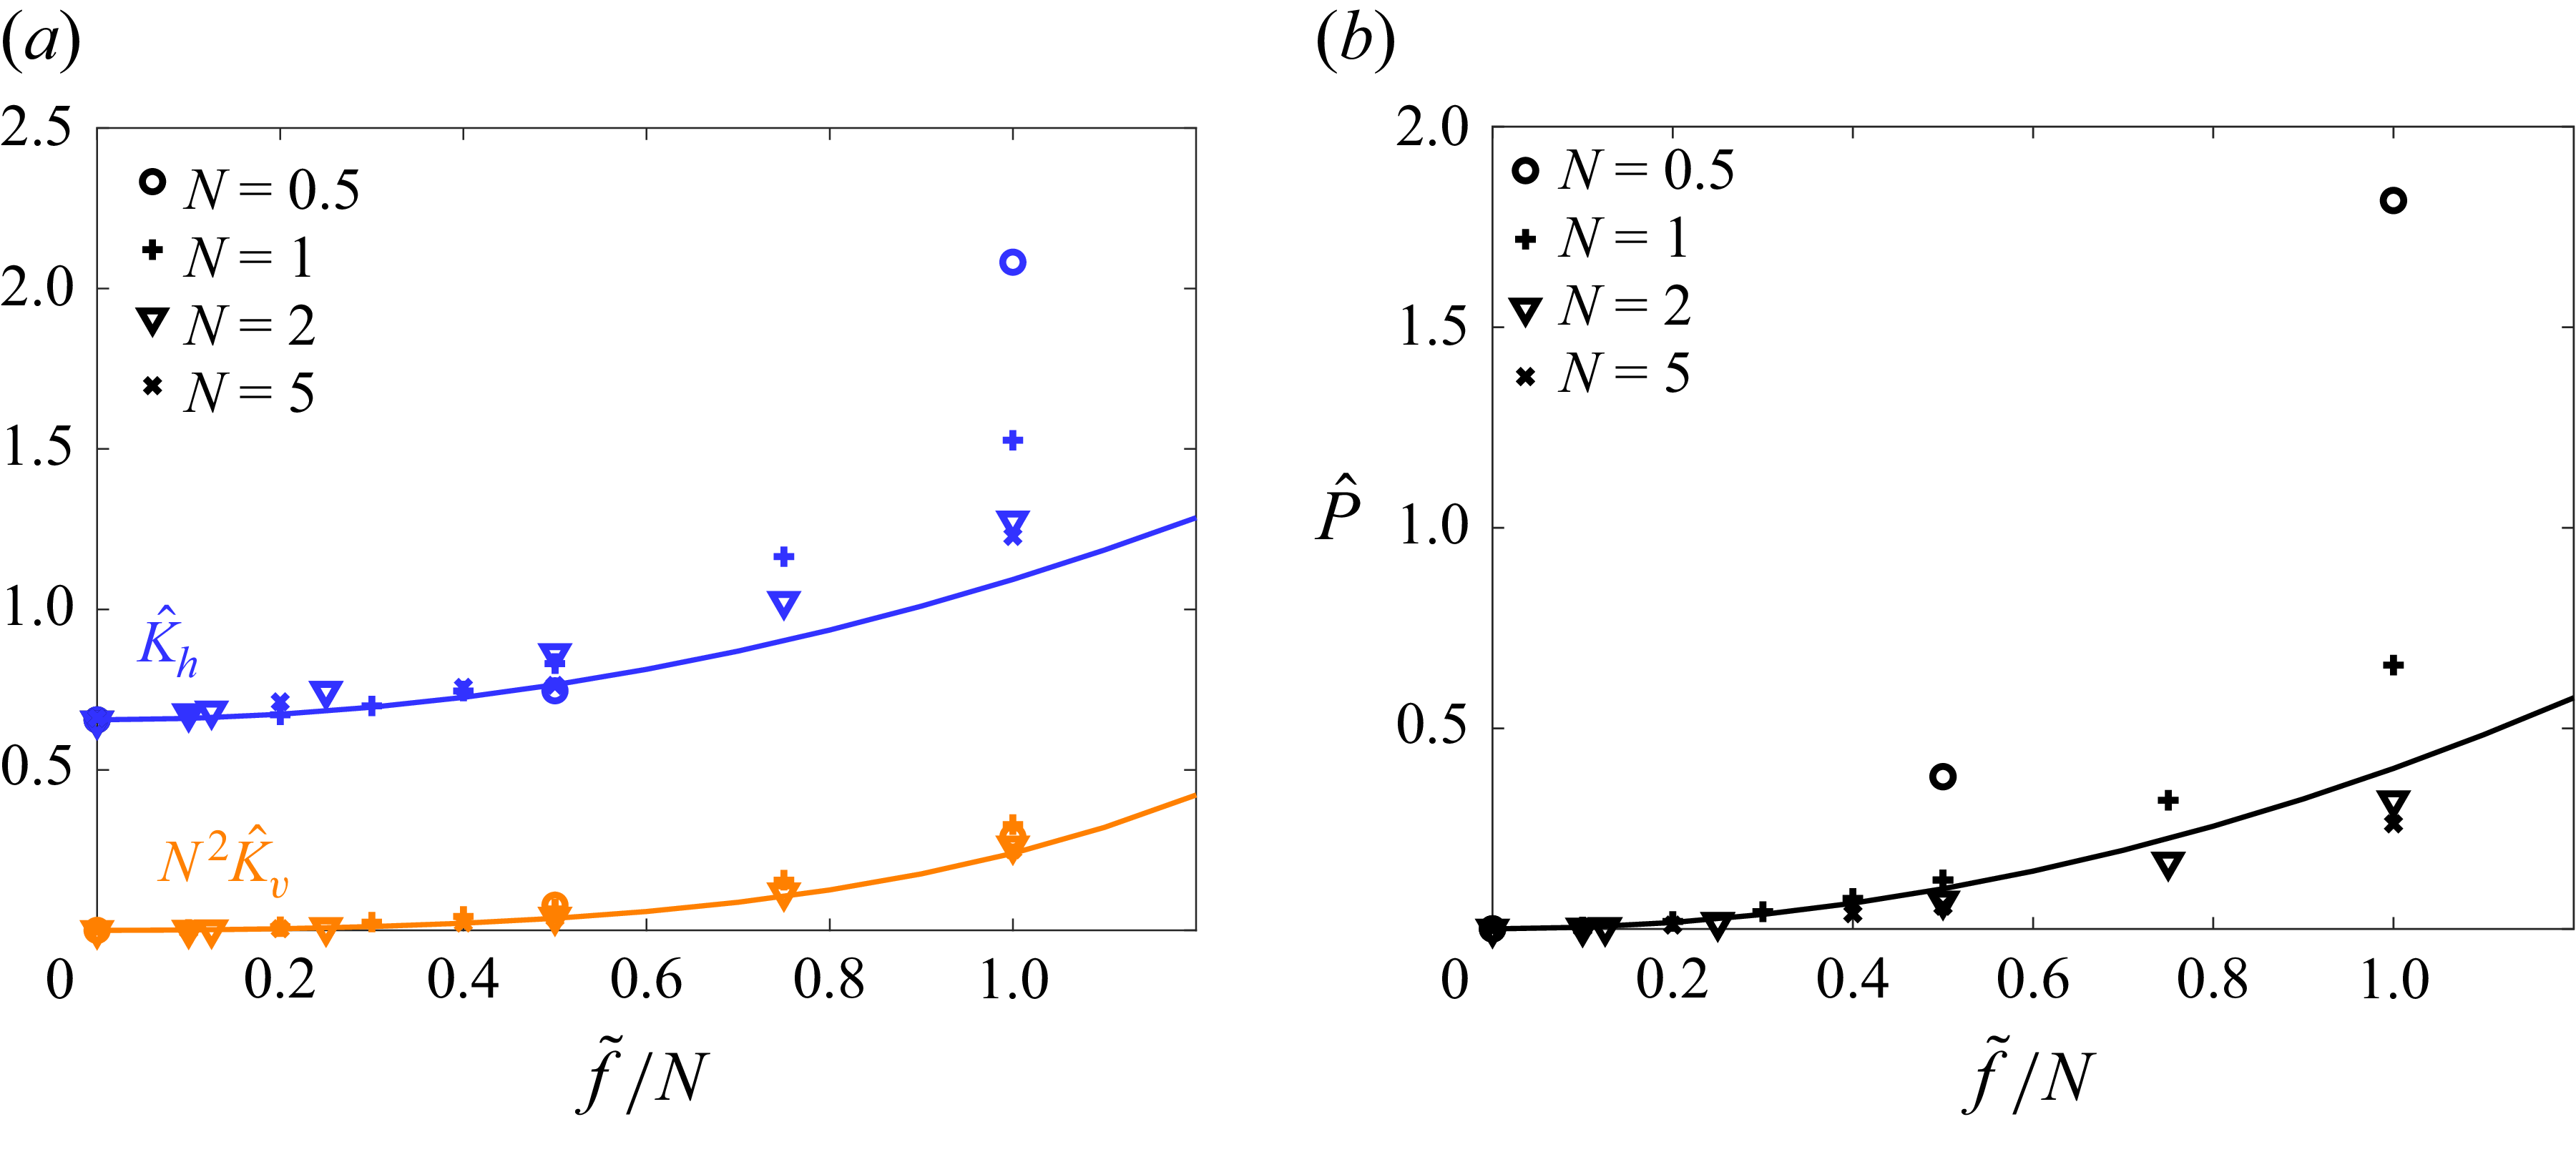
3.5.4. Summary of the scaling of the energies
The scalings for the three energies are summarised in figure 20. The symbols in this figure show the mean level at saturation of
 $\hat {K}_{h}$
,
 $N^{2}\hat {K}_{v}$
and
 $\hat {P}$
averaged over a range of
 $100$
time units after nonlinear saturation, as a function of
 $\tilde {f}/N$
for four values of
 $N$
. The solid lines represent the scaling relations derived in the strongly stratified limit for the three energies. The relation (3.22) for the horizontal kinetic energy is entirely given by the kinetic energy in the traditional limit
 $\hat {K}_{h}'\simeq 0.65$
and the ratio
 $\tilde {f}/N$
. In contrast, the multiplying factors in front of the relations (3.24) and (3.27) for the vertical kinetic energy and potential energy have been determined by a fit. These scaling relations are in good agreement with the simulations when
 $\tilde {f}/N$
is small and
 $N$
is large:
 $\tilde {f}/N\leqslant 0.5$
and
 $N\geqslant 2$
. On the other hand, some slight and significant departures exist for
 $N\geqslant 2$
and when
 $N\leqslant 1$
, respectively, for
 $\tilde {f}/N\geqslant 0.5$
, especially for
 $\hat {K}_{h}$
and
 $\hat {P}$
. This is expected because the assumption of a strongly stratified fluid used to compute these scaling laws is satisfied only when
 $N\gg 1$
.
(a) Mean horizontal kinetic energy (blue) and vertical kinetic energy multiplied by
 $N^{2}$
(orange) at saturation as a function of the ratio
 $\tilde {f}/N$
. (b) Mean potential energy (black). The different symbols represent simulations at different
 $N$
. Solid lines show the relations
 $\hat {K}_h\simeq (1/3)(3+2(\tilde {f}/N)^{2})\hat {K}_h'$
(blue),
 $N^{2}\hat {K}_v\,=\,0.12(\tilde {f}/N)^{2}(1+(\tilde {f}/N)^{2})$
(orange) and
 $P=0.4(\tilde {f}/N)^{2}$
(black).

4. Conclusion and discussion
In this paper, we have investigated, by means of direct numerical simulations, the nonlinear dynamics of a horizontal parallel shear flow in the presence of the full Coriolis acceleration and of stable stratification. Building upon the linear stability analysis of Park et al. (Reference Park, Prat, Mathis and Bugnet2021), we have studied the effects of the non-dimensional non-traditional Coriolis parameter
 $\tilde {f}$
and non-dimensional stratification
 $N$
for constant Reynolds and Schmidt numbers
 $ \textit{Re}=2000$
,
 $ \textit{Sc}=1$
, in the case of the hyperbolic tangent velocity profile. The study has been restricted to two-dimensional perturbations but with three velocity components in order to focus only on the shear instability associated with the inflection point.
We have identified three different types of nonlinear evolutions for the shear instability. For a sufficiently strong stratification
 $N\gt 1$
and
 $\tilde {f}\lt N$
, the evolution is similar to the traditional case leading to the formation of a stable and coherent vortex. In contrast, for weak stratification
 $N\lesssim 0.5$
and for sufficiently large
 $\tilde {f}$
, secondary instabilities develop vigorously and lead to small-scale turbulence in a large part of the flow. In between, i.e. for moderate stratification, secondary instabilities develop but remain confined within the Kelvin–Helmholtz billow.
A key quantity at the origin of these different evolutions is the vertical velocity field. Indeed, the horizontal dynamics generates vertical velocity and buoyancy perturbations through the vertical non-traditional Coriolis acceleration and the advection of the base buoyancy field. In turn, the horizontal non-traditional Coriolis acceleration due to the vertical velocity modifies the horizontal dynamics, i.e. creates vertical vorticity anomalies. The typical amplitude of the vertical velocity increases as the non-traditional Coriolis parameter increases for a given stratification, or as the stratification decreases for a given non-traditional Coriolis parameter. Accordingly, the analysis of the evolution of the kinetic and potential energies have shown that an increase of the stratification tends to render the dynamics closer to the traditional one whereas an increase of the non-traditional Coriolis parameter leads to the opposite effect.
The study of the enstrophy evolution shows that the enstrophy in the traditional-like cases remains close to the one in the traditional case. Nevertheless, it may increase slightly in contrast to the traditional limit due to the active vortex stretching and tilting. In the `mixed’ and `non-traditional’ cases, the enstrophy increases moderately and dramatically, respectively. Hence, the enstrophy dynamics resembles the one of fully three-dimensional flows, especially in the `non-traditional’ case, even if the flow is two-dimensional.
The nature of the secondary instabilities has also been investigated. We have shown that inflection points satisfying locally the Fjørtoft necessary condition for instability exist prior to the onset of secondary instabilities. This suggests that they are shear instabilities due to the vorticity generated by tilting of the horizontal component of background rotation.
Finally, the strongly stratified regime
 $N\gg 1$
has been further studied in the inviscid limit. It has been shown that the traditional equations can be recovered by means of a transformation only depending on
 $N$
and
 $\tilde {f}$
. This implies that the linear stability characteristics for any
 $\tilde {f}$
for
 $N\gg 1$
can be deduced from those of the traditional limit. Similarly, the dependencies on
 $\tilde {f}$
and
 $N$
of the horizontal and vertical kinetic energies as well as the potential energy at saturation have been predicted thanks to this transformation. A good agreement with the simulations has been observed when
 $N\gg 1$
. Although all these results pertain to the specific case of a hyperbolic tangent velocity profile, we expect that similar results would be obtained for other base velocity profiles.
In summary, the nonlinear dynamics of the horizontal shear instability under the complete Coriolis acceleration can be widely different from the classical scenario under the traditional approximation. Such emergence of small-scale turbulence can render transport and mixing processes much more efficient than expected from studies and parametrisations assuming the traditional approximation. As such, our study is a first step towards the improvement of parametrisations of transport and mixing processes for stellar interiors, planetary atmospheres and oceans. In particular, the effects of both
 $N$
and
 $\tilde {f}$
should be critically taken into account in the parametrisations (e.g. turbulent effective viscosity, wave damping rates, see Mathis et al. (Reference Mathis, Prat, Amard, Charbonnel, Palacios, Lagarde and Eggenberger2018) and Mathis (Reference Mathis2025)).
Strikingly, such transition to turbulence occurs for weakly stratified fluid for non-dimensional buoyancy frequency
 $N\lesssim 0.5$
and even if the non-dimensional non-traditional Coriolis parameter is small
 $\tilde {f}\gtrsim 0.025$
. Hence, the ratio
 $\tilde {f}/N$
should be above
 $0.05$
. Interestingly, this range corresponds to the typical values in the atmosphere, oceans and solar-like stars for which
 $\tilde {f}/N\sim 0.01$
,
 $\tilde {f}/N\sim 0.05-0.1$
and
 $\tilde {f}/N\sim 0.01-0.1$
, respectively. Hence, the transition to turbulence could potentially happen in many regions sufficiently close to the equator in stars, the atmosphere and oceans provided that the effect of the stratification is sufficiently weak.
In the present paper, the Reynolds number and Schmidt number were fixed to
 $ \textit{Re}=2000$
and
 $ \textit{Sc}=1$
. In the future, we plan to investigate the effects of varying these parameters. This should allow us to determine what controls the size of small-scale motions and the maximum level of the enstrophy when turbulence arises. In addition, we will study low values of the Schmidt number such as
 $ \textit{Sc}=10^{-6}$
pertaining to stars but not the atmosphere and oceans, where
 $ \textit{Sc}$
is of order unity for temperature or very large for salt
 $ \textit{Sc}\sim 700$
.
In the linear case, Park et al. (Reference Park, Prat, Mathis and Bugnet2021) have already shown that the destabilising effect of the non-traditional Coriolis acceleration on the shear instability is reduced as the Schmidt number is decreased. We will determine if this is also the case in the nonlinear regime.
It would also be interesting to study the full three-dimensional dynamics for the present configuration. In particular, the shear associated with the vertical velocity field might trigger secondary shear instabilities in the vertical plane as observed by Toghraei & Billant (Reference Toghraei and Billant2025) for a stratified vortex under the complete Coriolis force or by Boulanger et al. (Reference Boulanger, Meunier and Le Dizès2007, Reference Boulanger, Meunier and Le Dizès2008) for a tilted vortex in a stratified fluid. In addition, other orientations of the shear could be considered, especially vertical shear (Park & Mathis Reference Park and Mathis2025) which is also ubiquitous in geophysical and astrophysical flows.
Acknowledgements
The authors thank the referees for their detailed and constructive reports, which helped them to improve the article. We also thank F. Gallaire and A. Loyer for insightful discussions and V. Toai for technical assistance.
Funding
C.M. and S.M. acknowledge support from the European Research Council (ERC) under the Horizon Europe programme (Synergy grant agreement 101071505: 4D-STAR), from the CNES SOHO-GOLF and PLATO grants at CEA-DAp, and from PNP and PNPS (CNRS/INSU). While partially funded by the European Union, views and opinions expressed are, however, those of the authors only and do not necessarily reflect those of the European Union or the European Research Council. Neither the European Union nor the granting authority can be held responsible for them. A part of this work was performed using HPC resources from GENCI-IDRIS (grant 2023- AD012A07419R2).
Declaration of interests
The authors report no conflict of interest.
Appendix A. Effect of the viscous and mass diffusions of the base flow
The numerical simulations presented in the paper are based upon (2.5) where the flow is decomposed into a steady base state and a perturbation. The advantage is that the problem can be simulated in a doubly periodic domain, even if the base state is not periodic in the
 $y$
direction, because the perturbation tends to zero for large
 $y$
. However, the viscous and diffusive dissipations of the base state
 $(U,B)$
are omitted in (2.5). In this appendix, we check the effect of the latter approximation by replacing the base velocity (2.2) by a double hyperbolic tangent profile,
 \begin{align} U(y)=U_0 \left [ \tanh \left (\frac {y}{L_{0}}-\frac {L_{y}}{4} \right ) - \tanh \left (\frac {y}{L_{0}}-\frac {3\,L_{y}}{4} \right ) - 1 \right ] \!, \end{align}
as done, for example, by Lecoanet et al. (Reference Lecoanet, McCourt, Quataert, Burns, Vasil, Oishi, Brown, Stone and O’Leary2016). Then, the base state
 $(U,B)$
tends to constant values for large
 $\vert y \vert$
and the simulations can be performed directly using (2.1) in a doubly periodic domain, i.e. without the decomposition (2.4). Nevertheless, to have the same confinement and resolution in the
 $y$
direction as in the simulations with a single hyperbolic tangent profile, the size
 $L_y$
and the number of points
 $N_y$
need to be doubled. As such, the computational cost of these simulations is doubled.
(a) Total kinetic energy for
 $(N, \tilde {f})=(2,1.5)$
and
 $ \textit{Re}=2000$
,
 $ \textit{Sc}=1$
when the dissipation of the base state is omitted (dotted line) and when it is taken into account (solid line). Panel (b) is the same as (a) but for
 $(N, \tilde {f})=(1,0.5)$
.

The dotted lines in figure 21 show the evolutions of the total kinetic energy
 \begin{align} K=\frac {1}{2L_{x}}\int _0^{L_x}\int _0^{L_y} \big(u^2+v^2+w^2 \big)\,{\rm d}y {\rm d}x, \end{align}
for the simulations for
 $(N,\tilde f)=(2,1.5)$
(traditional-like; figure 21
a) and
 $(N,\tilde f)=(1,0.5)$
(mixed; figure 21
b) listed in table 1. The solid lines represent half the total kinetic energy of the same simulations but with the double hyperbolic tangent profile (A1). In the latter case, the total kinetic energy slightly decays because of the viscous diffusion of the base flow (2.2) before the instability develops instead of being constant. However, the evolutions are globally similar. In particular, the instability develops at the same time for each case. Oscillations at saturation are also visible in both simulations for
 $(N,\tilde f)=(2,1.5)$
(figure 21
a) even if they are less pronounced when the dissipation of the base state is taken into account. For
 $(N,\tilde f)=(1,0.5)$
, the evolutions of the total kinetic energy are also very close and the secondary instabilities appear around the same time.
Appendix B. Simulation of two shear instability wavelengths
In the paper, the box size in the streamwise direction
 $L_{x}$
is set to one wavelength of the shear instability in order to focus on the nonlinear evolution of the Kelvin–Helmholtz instability. In this appendix, we present a simulation of the typical `non-traditional’ evolution for
 $(N,\tilde {f})=(0.5,0.5)$
in which the length
 $L_{x}$
of the domain is doubled,
 $L_{x}=41.88$
, so that two Kelvin–Helmholtz vortices can develop and the paring instability can occur. To keep the same resolution,
 $N_{x}$
is also doubled
 $N_{x}=2048$
. Consequently, the computational cost of these simulations is twice higher. All the other parameters are the same as in table 1.
Total vertical vorticity
 $(\xi =\partial _{x}v-\partial _{y}u)$
at (a),
 $t=87$
, (b)
 $t=108$
, (c)
 $t=117$
, (d)
 $t=160$
for
 $N=0.5$
,
 $\tilde {f}=0.5$
(non-traditional evolution),
 $ \textit{Re}=2000$
and
 $ \textit{Sc}=1$
. The box size is
 $L_{x}=41.88$
instead of
 $L_{x}=20.94$
in figure 7. The
 $y$
-axis has been cropped compared with the original computational domain.

(a) Total kinetic energy for
 $(N, \tilde {f})=(0.5,0.5)$
and
 $ \textit{Re}=2000$
,
 $ \textit{Sc}=1$
for
 $L_{x}=20.94$
(dotted line) and
 $L_{x}=41.88$
(solid line). Panel (b) is the same as (a) but for the total enstrophy.

Figure 22 shows the total vertical vorticity at several instances. At first, the shear layer begins to roll at two distinct locations (figure 22 a). This creates two vortices (figure 22 b) that are slightly asymmetric due to the subharmonic instability, i.e. the pairing instability. They exhibit thin layers of intense positive and negative vorticity as observed in figure 7(b). This leads to the formation of secondary instabilities (figure 22 c). They appear first in the right-hand vortex and then slightly later in the left-hand vortex. Simultaneously, the two vortices merge, creating a large vortex colonised by small-scale turbulence (figure 22 d) as observed for a single wavelength (figure 7 d). Overall, the dynamics is therefore qualitatively similar to figure 7 except that the pairing instability occurs concomitantly with the secondary instability.
However, there exist quantitative differences. Figure 23(a) compares the total kinetic energy
 $K$
between the simulations with one (dotted line) and two (solid line) wavelengths of the shear instability. In the latter case,
 $K$
exhibits a peak when the two vortices merge and form a larger vortex. In addition, the peak of total enstrophy (figure 23
b) is smaller in the case of the simulation with two Kelvin–Helmholtz vortices. This is because the transition to small-scale turbulence does not happen simultaneously in the two vortices but successively. Since the enstrophy is an average per unit wavelength, the maximum is consequently smaller. Hence, while the results are qualitatively similar regardless of the number of wavelengths, all the quantitative results reported in the body of the paper apply only to the case of a single wavelength of the shear instability. Similar observations have been made for the other typical sets of parameters of table 1 when the size
 $L_{x}$
is doubled.